the Creative Commons Attribution 4.0 License.
the Creative Commons Attribution 4.0 License.
 | 02 Oct 2024
A 2001–2022 global gross primary productivity dataset using an ensemble model based on the random forest method
Xin Chen
Tiexi Chen
Xiaodong Li
Yuanfang Chai
Shengjie Zhou
Renjie Guo
Jie Dai
Advancements in remote sensing technology have significantly contributed to the improvement of models for estimating terrestrial gross primary productivity (GPP). However, discrepancies in the spatial distribution and interannual variability within GPP datasets pose challenges to a comprehensive understanding of the terrestrial carbon cycle. In contrast to previous models that rely on remote sensing and environmental variables, we developed an ensemble model based on the random forest method (denoted ERF model). This model used GPP outputs from established models: Eddy Covariance Light Use Efficiency (EC-LUE), GPP estimate model based on Kernel Normalized Difference Vegetation Index (GPP-kNDVI), GPP estimate model based on Near-Infrared Reflectance of Vegetation (GPP-NIRv), Revised-EC-LUE, Vegetation Photosynthesis Model (VPM), and GPP estimate model based on the Moderate Resolution Imaging Spectroradiometer (MODIS). These outputs were used as inputs to estimate GPP. The ERF model demonstrated superior performance, explaining 85.1 % of the monthly GPP variations at 170 sites and surpassing the performance of selected GPP estimate models (67.7 %–77.5 %) and an independent random forest model using remote sensing and environmental variables (81.5 %). Additionally, the ERF model improved accuracy across each month and with various subranges, mitigating the issue of “high-value underestimation and low-value overestimation” in GPP estimates. Over the period from 2001 to 2022, the global GPP estimated by the ERF model was 132.7 PgC yr−1, with an increasing trend of 0.42 PgC yr−2, which is comparable to or slightly better than the accuracy of other mainstream GPP datasets in terms of validation results of GPP observations independent of FLUXNET (i.e., ChinaFLUX). Importantly, for a growing number of GPP datasets, our study provides a way to integrate these GPP datasets, which may lead to a more reliable estimate of global GPP.
- Article
(5690 KB) - Full-text XML
-
Supplement
(2676 KB) - BibTeX
- EndNote


Gross primary productivity (GPP) is the largest carbon flux in the global carbon cycle, and it serves as the primary input of carbon into the terrestrial carbon cycle. Uncertainties in GPP estimates can propagate to other carbon flux estimates, making it crucial to clarify the spatiotemporal patterns of GPP (Ruehr et al., 2023; Xiao et al., 2019). However, global GPP is variously estimated from 90 to 160 PgC yr−1 across different studies, with these variations becoming more pronounced when scaled down to regional scales or specific ecosystem types (Anav et al., 2015; Ryu et al., 2019; Jung et al., 2020). This variability underscores the necessity for innovative methods to reduce uncertainty in GPP estimates.
The light use efficiency (LUE) model is one of the most widely adopted methods for estimating GPP. It assumes that GPP is proportional to the photosynthetically active radiation absorbed by vegetation and optimizes the spatiotemporal pattern of GPP through meteorological constraints such as temperature and moisture (Pei et al., 2022). However, variations in these constraints vary significantly, leading to differences of over 10 % in model explanatory power (Yuan et al., 2014). Recent studies have proposed some novel vegetation indices that have been shown to be effective proxies for GPP through theoretical derivation and observed validation (Badgley et al., 2017; Camps-Valls et al., 2021). However, these vegetation indices often only use remote sensing data as the input for estimating long-term GPP without considering meteorological factors, which has led to some controversy (Chen et al., 2024b; Dechant et al., 2022, 2020). Both LUE and vegetation index models use linear mathematical formulas to estimate GPP, but ecosystems are inherently complex, and the biases introduced by these numerical models increase the uncertainty of GPP estimates. Machine learning models have shown great potential for improving GPP estimates in previous studies (Guo et al., 2023; Jung et al., 2020). These models are trained by non-physical means directly using GPP observations and selected environmental and vegetation variables, and the performance of the models depends on the quantity and quality of observed data and the representativeness of input data. Nevertheless, direct validation from flux towers of FLUXNET reveals that these models typically explain only about 70 % of monthly GPP variations, with a similar performance compared to other GPP estimate models (Wang et al., 2021; Badgley et al., 2019; Zheng et al., 2020; Jung et al., 2020). Due to deviations in the model structure, a common limitation across these models is the poor estimate of monthly extreme GPP, leading to the phenomenon of “high-value underestimation and low-value overestimation” (Zheng et al., 2020). Especially for extremely high values, which usually occur during the growing season and largely determine the annual totals and interannual fluctuations of GPP, this underestimation may hinder our understanding of the global carbon cycle.
It is challenging for a single model to provide accurate estimates for all global regions. Previous studies have shown that ensemble models perform significantly better than single models and can handle some inherent issues in single models (Chen et al., 2020; Yao et al., 2014). Traditional multi-model ensemble methods usually use a simple multi-model average or a Bayesian model averaging. However, these methods typically assign fixed weights to each model and are essentially linear combinations. Recent studies have incorporated machine learning techniques into multi-model ensembles to establish nonlinear relationships between multiple simulated target variables and a real target variable, improving simulation performance (Bai et al., 2021; Tian et al., 2023; Yao et al., 2017). Whether this method can improve some common problems with individual GPP estimate models, such as high-value underestimation and low-value overestimation, is not clear and needs further investigation.
In this study, we attempt to use an ensemble model based on the random forest method (denoted ERF model) to improve global GPP estimates. Specifically, the work of this study includes the following: (1) recalibrating parameters for each model, as well as comparing the performance of six GPP estimate models and the ERF model; (2) focusing on the phenomenon of high-value underestimation and low-value overestimation in each model, as well as evaluating the performance of each model across different months, vegetation types, and subranges (high value, medium value, and low value); and (3) developing a global GPP dataset using the ERF model and validating its generalization using GPP observations from ChinaFLUX.
2.1 Data at the global scale
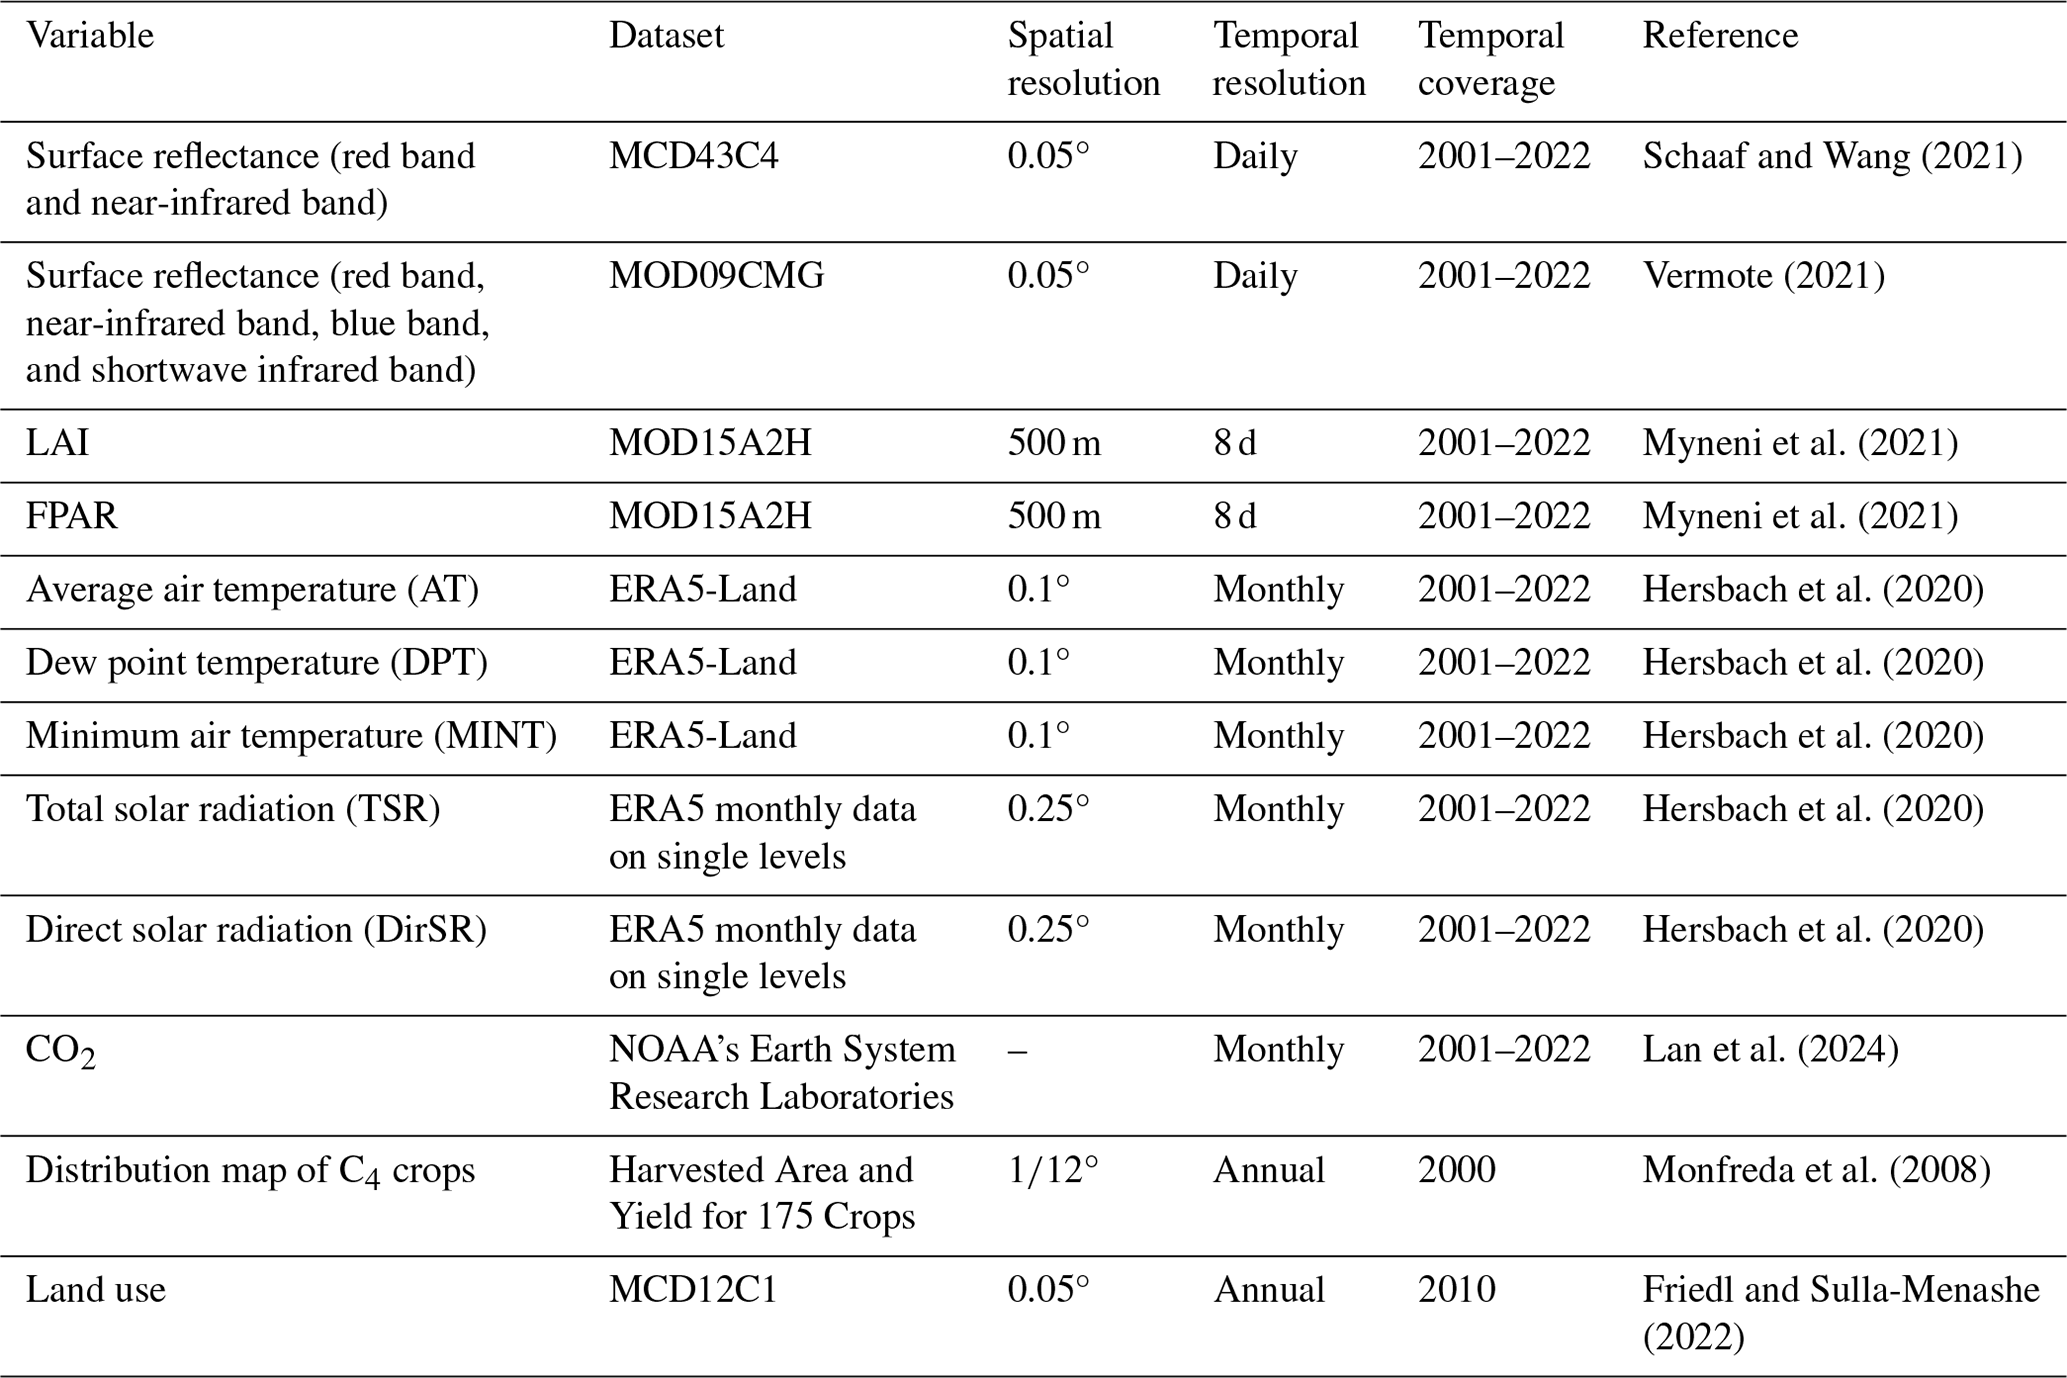
In this study, we selected remote sensing data from the Moderate Resolution Imaging Spectroradiometer (MODIS) and meteorological data from EAR5 (ECMWF Reanalysis v5) to estimate global GPP (Hersbach et al., 2020). For the remote sensing data, surface reflectance (red band, near-infrared band, blue band, and shortwave infrared band), leaf area index (LAI), and fraction of photosynthetically active radiation (FPAR) were used. For meteorological data, we selected average air temperature, dew point temperature, minimum air temperature, total solar radiation, and direct solar radiation. Dew point temperature and average air temperature were used to calculate saturated vapor pressure difference (VPD) (Yuan et al., 2019), and diffuse solar radiation (DifSR) was derived as the difference between total solar radiation and direct solar radiation. Minimum air temperature was obtained from the hourly air temperature. CO2 data were obtained from the monthly average carbon dioxide levels measured by the Mauna Loa Observatory in Hawaii. Table 1 provides an overview of the datasets used in this study.
Previous studies have shown that the photosynthetic capacity of C4 crops is much higher than that of C3 crops (Chen et al., 2014, 2011), so it is necessary to divide the cropland into C3 crops and C4 crops. To estimate the global GPP, we used the “Harvested Area and Yield for 175 Crops” dataset, which describes the global harvested area and yield of 175 crops in 2000 (Monfreda et al., 2008). We extracted the sum of the area ratios of all C4 crops (corn, corn feed, sorghum, sorghum feed, sugarcane, millet) at each grid as the coverage of C4 crops (Fig. S1 in the Supplement). Consequently, the estimated value of cropland GPP can be expressed as the coverage of C3 crops multiplied by the simulated GPP value of C3 crops plus the coverage of C4 crops multiplied by the simulated GPP value of C4 crops, which has been used in a previous study (Guo et al., 2023).
The land use map was derived from the International Geosphere-Biosphere Programme (IGBP) classification of MCD12C1, and 2010 was chosen as the reference year (that is, land use data are unchanged in the simulation of global GPP). In order to meet the requirements of subsequent research, land use types were grouped into nine categories: deciduous broadleaf forest (DBF), evergreen needleleaf forest (ENF), evergreen broadleaf forest (EBF), mixed forest (MF), grassland (GRA), cropland (including CRO-C3 and CRO-C4), savanna (SAV), shrub (SHR), and wetland (WET).
Finally, for higher-resolution data, we gridded the dataset to 0.05° by averaging all pixels whose center fell within each 0.05° grid cell for upscaling. For lower-resolution data, we used the nearest-neighbor resampling method to 0.05°. In addition, MODIS data were aggregated to a monthly temporal resolution to ensure spatiotemporal consistency.
2.2 Observation data at the site scale
GPP observations were sourced from the FLUXNET 2015 dataset, which includes carbon fluxes and meteorological variables from more than 200 flux sites around the world (Pastorello et al., 2020). GPP cannot be obtained directly from flux sites and usually needs to be obtained by decomposing the net ecosystem exchange. We chose a monthly level GPP based on the nighttime partitioning method and retained only high-quality data (NEE_VUT_REF_QC >0.8) for every year, ultimately selecting 170 sites with 10 824 monthly values for this study (Fig. S2). In addition, we selected monthly average air temperature, total solar radiation, and VPD. The site observations do not provide direct solar radiation, so we extracted data from ERA5 that cover the flux tower. Monthly minimum air temperature was derived from hourly air temperature. Since some required data in GPP simulations are not directly available at flux sites, LAI and FPAR were extracted from MOD15A2H (500 m), and surface reflectance data (red band, near-infrared band, blue band, and shortwave infrared band) were derived from MCD43A4 (500 m) and MOD09A1 (500 m). These data are roughly similar to the footprint of the flux site and can represent the land surface of the flux site (Chu et al., 2021).
2.3 The GPP estimate model
We selected six independent models to estimate GPP in this study. These models are widely used with few model parameters and have demonstrated reliable accuracy in previous studies (Zheng et al., 2020; Zhang et al., 2017; Badgley et al., 2017). The six models are Eddy Covariance Light Use Efficiency (EC-LUE), Revised-EC-LUE, GPP estimate model based on the Kernel Normalized Difference Vegetation Index (kNDVI), GPP estimate model based on Near-Infrared Reflectance of Vegetation (NIRv), Vegetation Photosynthesis Model (VPM), and the GPP estimate model based on MODIS. The VPM, MODIS, and EC-LUE models are LUE models based on remote sensing data and meteorological data (Running et al., 2004; Xiao et al., 2004; Yuan et al., 2007). Zheng et al. (2020) proposed the Revised-EC-LUE model, which divides the canopy into sunlit and shaded leaves, improving the estimate of global GPP (Zheng et al., 2020). The NIRv and kNDVI models are novel vegetation indices calculated from the red and near-infrared bands of the reflectance spectrum (Badgley et al., 2017; Camps-Valls et al., 2021). Similar to sun-induced chlorophyll fluorescence, they exhibit a linear relationship with GPP and are considered effective proxies for GPP. Detailed descriptions of all models can be found in Sect. S1 in the Supplement.
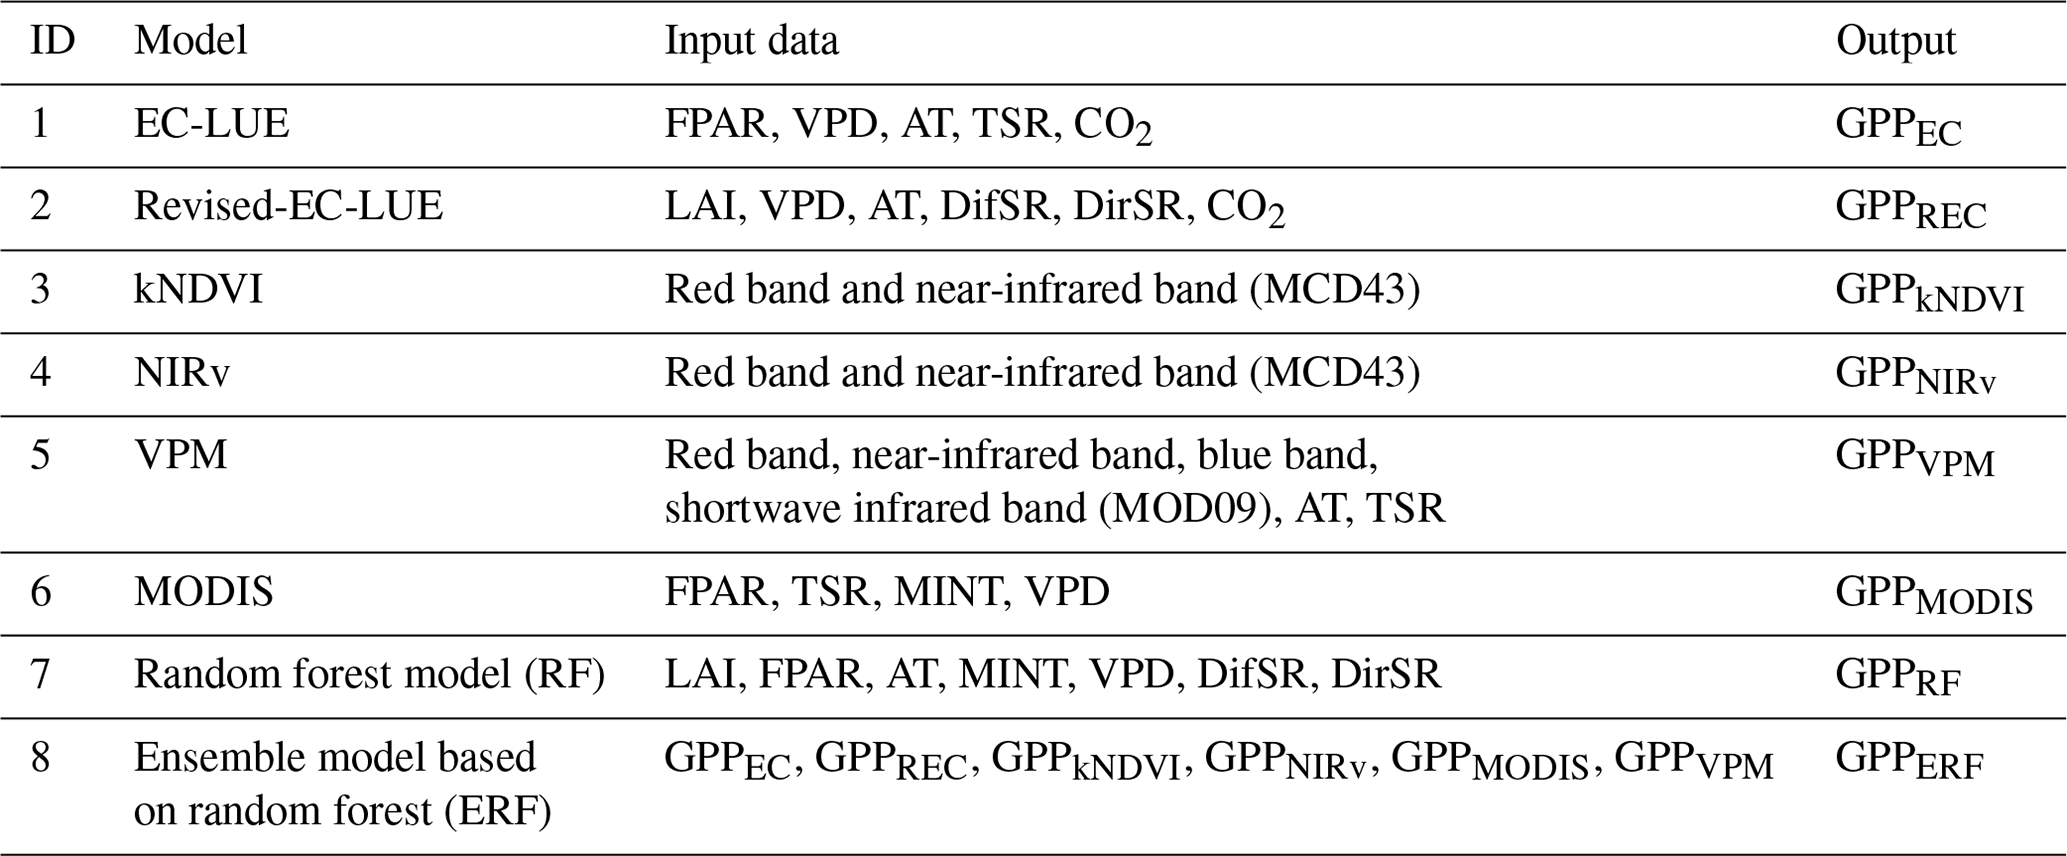
To reduce uncertainty in GPP estimates from a single model, we used the ERF model, where the basic idea is to restructure the simulated values of multiple models. In this study, we directly used the ERF model to establish the relationship between the GPP simulated by the six abovementioned models and GPP observations. In addition, for comparison with the ERF model, we also used the random forest (RF) method for modeling. In this study, we used average air temperature, minimum air temperature, VPD, direct solar radiation, diffuse solar radiation, FPAR, and LAI as explanatory variables. Both models used the random forest method, which has been widely used in previous studies of GPP estimates (Guo et al., 2023; Jung et al., 2020). The random forest method is an ensemble learning algorithm that combines the outputs of multiple decision trees to produce a single result, and it is commonly used for classification and regression problems (Belgiu and Drăguţ, 2016). In the regression problem, the output result of each decision tree is a continuous value, and the average of all decision tree outputs is taken as the final result. An overview of all models used can be found in Table 2.
2.4 Model parameter calibration and validation
FLUXNET only provides GPP observations and meteorological data, lacking direct measurements for LAI, FPAR, and surface reflectance, so remote sensing data are needed. Considering the variety of remote sensing data sources, such as MODIS and the Advanced Very-High-Resolution Radiometer, it is evident that calibrating the same GPP estimate model with different remote sensing data can yield varied parameters. In addition, the number of sites used to calibrate model parameters is also an important influencing factor for model parameters. The original parameters of these models were calibrated with only a limited number of sites (e.g., 95 sites for the Revised-EC-LUE model and 104 sites for NIRv) (Wang et al., 2021; Zheng et al., 2020). Therefore, to reduce the impact of the uncertainty of model parameters on simulation results, we did not use original parameters and conducted parameter calibration for GPP estimate models across different vegetation types. For EC-LUE, Revised-EC-LUE, VPM, and MODIS, the Markov chain Monte Carlo method was used to calibrate model parameters. Traditionally, the mean of the posterior distribution of parameters is taken as the optimal value. However, previous studies have indicated that some model parameters are not well constrained when calibrating multiple model parameters (Xu et al., 2006; Wang et al., 2017), so we selected the parameter with the smallest root-mean-square error (RMSE) as the optimal parameter in each iteration. For each vegetation type, we randomly selected 70 % of the data for parameter calibration, and we repeated the process 200 times. In order to avoid overfitting, we adopted the mean of the 200 calibrated parameters as the final model parameters. Similarly, for the two vegetation index models, we randomly selected 70 % of the data in each vegetation type for parameter calibration, repeating the process 200 times and using the mean of the 200 calibrated parameters as the final model parameters.
After obtaining GPP estimates from the six GPP models, we evaluated the simulation performance of the RF model and the ERF model. For both models, we evaluated the model performance using 5-fold cross-validation, where the process was repeated 200 times, and the mean of the 200 GPP estimates was considered the final GPP estimate. In addition, we used a second validation method in which all data from 70 % of the sites were selected for modeling, and only data from the remaining 30 % of the sites were validated, a process that was repeated 200 times. This validation will further illustrate the generalization of the model, i.e., its potential for estimating GPP without local observations. We utilized the determination coefficient (R2) and RMSE as metrics to evaluate the simulation performance of all models. Additionally, we used the ratio of GPP simulations to GPP observations (Sim / Obs) to measure whether the model overestimates or underestimates.
2.5 The global GPP estimate based on the ERF model and its uncertainty
Based on the ERF model, we estimated global GPP for 2001–2022 (ERF_GPP). It is important to note that in this process we used all the site data to build the model. The uncertainties of ERF_GPP can be attributed to two primary factors: the influence of the number of GPP observations and the influence of the number of features (that is, the simulated GPP). For the first type of uncertainty, we randomly selected 80 % of the data to build a model and simulated the multi-year average of global GPP. The process was repeated 100 times, yielding 100 sets of multi-year averages of ERF_GPP. Their standard deviations were considered to be the uncertainty of ERF_GPP caused by the number of GPP observations. For the second type of uncertainty, we selected a different number of features to build a model and simulated the multi-year average of global GPP. A total of 56 sets of multi-year averages of ERF_GPP were obtained. The standard deviation of different combinations was considered to be the uncertainty of ERF_GPP caused by the number of features.
2.6 Evaluation of the generalization of different GPP datasets
The majority of flux sites in FLUXNET are concentrated in Europe and North America; it is unclear whether the different GPP estimate methods are suitable for regions with sparse flux sites. Recently, ChinaFLUX has published GPP observations from several sites, offering an opportunity to evaluate the generalization of different GPP datasets. However, the spatial resolution of most GPP datasets is 0.05°, and a direct comparison with GPP observations at flux sites is challenging. Therefore, we extracted 0.05° MODIS land use data covering the flux sites. If the vegetation type of the flux site matched the MODIS land use data, then the site was used for the analysis. Finally, a total of 12 flux sites were selected (Fig. S2), and Table S1 in the Supplement shows the information for these sites. The same procedure was applied to FLUXNET, resulting in the selection of 52 sites. It should be noted that due to the absence of meteorological data from some sites in ChinaFLUX, we did not validate all GPP estimate models at the site scale (500 m).
We evaluated the generalization of ERF_GPP at 12 ChinaFLUX sites and 52 FLUXNET sites. In addition, we selected a number of widely used GPP datasets for comparison, including BESS (Li et al., 2023), GOSIF (Li and Xiao, 2019), FLUXCOM (the random-forest-based version, FLUXCOM-RF, and the ensemble version, FLUXCOM-ENS; Jung et al., 2020), NIRv (Wang et al., 2021), Revise-EC-LUE (Zheng et al., 2020), MODIS (Running et al., 2004), and VPM (Zhang et al., 2017), which were generated using different GPP estimate methods. These GPP datasets all have a spatial resolution of 500 m to 0.5°, similar to the resampling process in Sect. 2.1, and we have unified them to 0.05°. The common time range for these datasets spanned from 2001 to 2018, and the temporal resolution was unified to monthly to match the GPP observations.
3.1 Performance of the GPP estimate models at the site scale
Tables S2–S7 show the optimization results of the six GPP estimate model parameters. Consistent with a previous study, in the Revised-EC-LUE model the light use efficiency parameter of shaded leaves was significantly higher than that of sunlit leaves (Zheng et al., 2020). Therefore, it is necessary to divide cropland into C3 crops and C4 crops. In all models, the light use efficiency parameters of C4 crops were significantly higher than those of C3 crops, which was particularly reflected in the two vegetation index models of GPPkNDVI and GPPNIRv; the slope of the linear regression directly reflected the difference in photosynthetic capacity of the different crops.
Figure 1 shows the performance of all models across different vegetation types. Overall, the performance of the ERF model was better than that of the other GPP estimate models. GPPERF had a higher accuracy among all models, with R2 between 0.61–0.91 and RMSE between 0.72–2.78 gC m−2 d−1. In contrast, the LUE and vegetation index models performed slightly worse, especially in EBF, where R2 was below 0.5 for both. It is worth noting that, compared to other vegetation types, the RMSE was highest for cropland, with six out of eight models for C4 crops exceeding 3 gC m−2 d−1, suggesting that these existing GPP estimate models may not properly capture the seasonal changes in cropland GPP. The six models with calibrated parameters and the ERF model were found to have no significant deviation across vegetation types. However, GPPRF was significantly underestimated for C4 crops and overestimated for SHR.
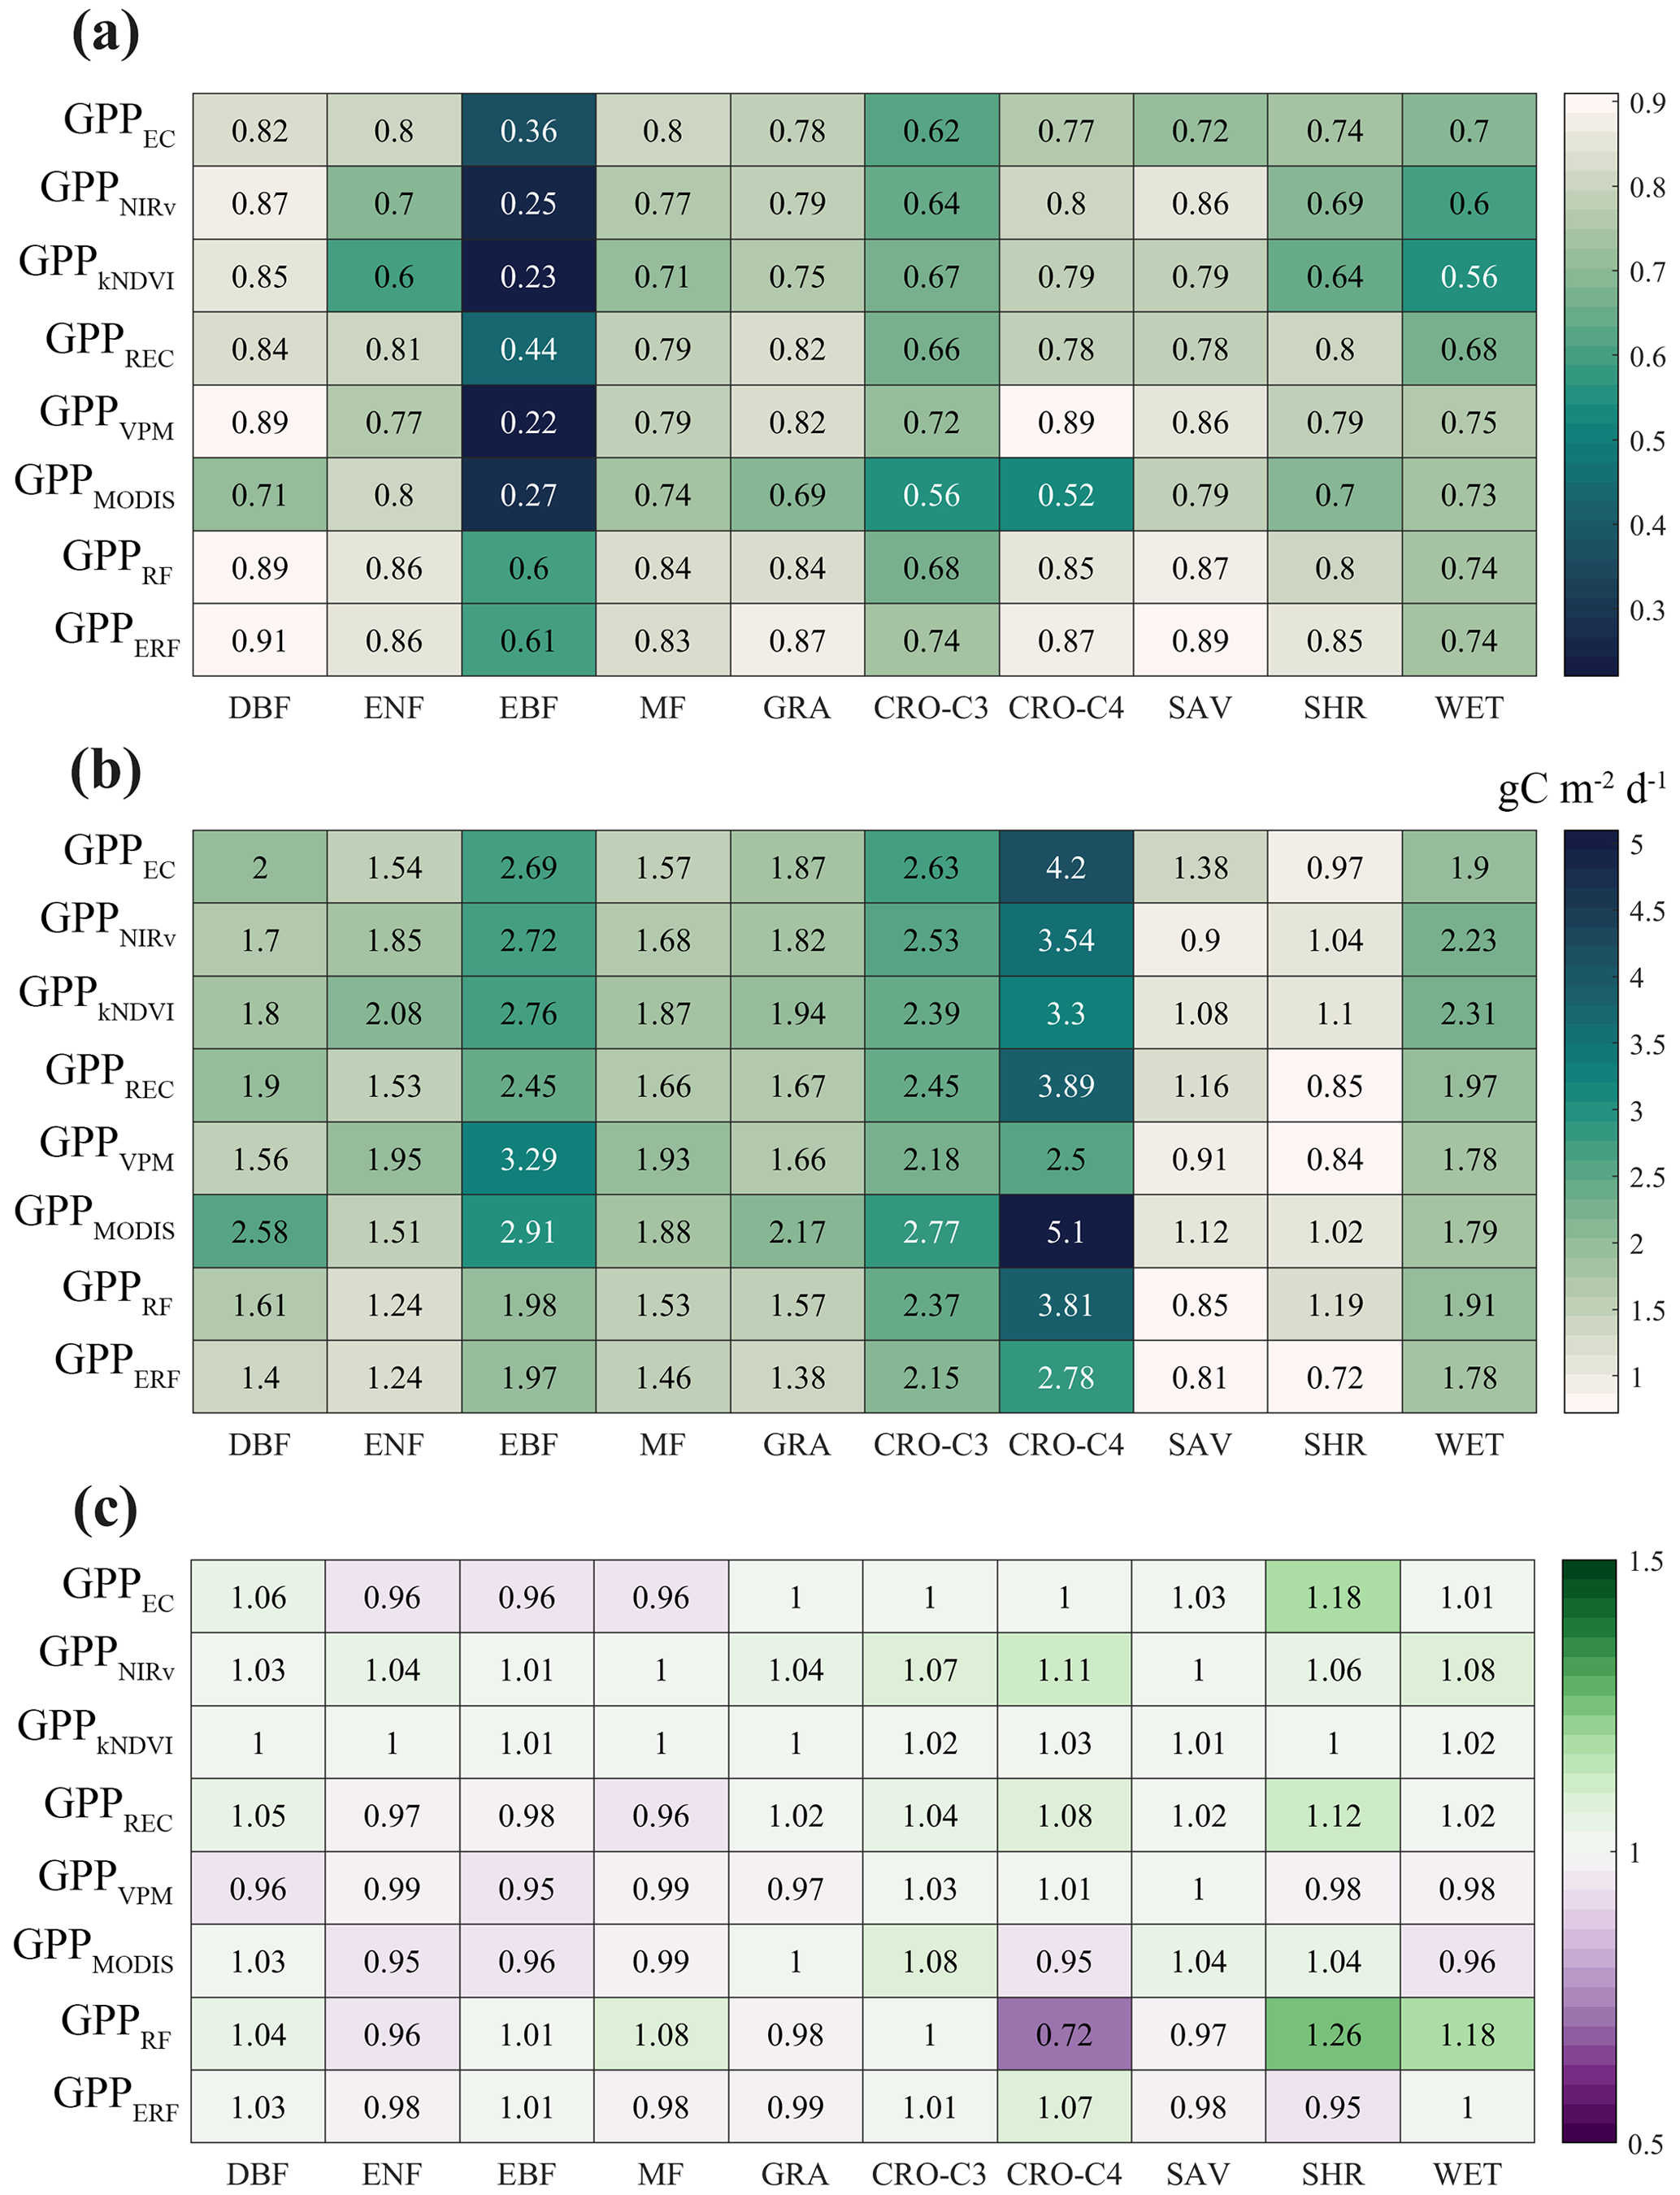
Figure 1The performance of the eight models on different vegetation types. Panels (a), (b), and (c) represent R2, RMSE, and Sim / Obs, respectively.
Combining the results of all flux sites, GPPERF explained 85.1 % of the monthly GPP variations, while the seven GPP estimate models only explained 67.7 %–81.5 % of the monthly GPP variations (Fig. 2). Another validation method in which the validation data were not selected randomly (but instead sites were entirely used for either training or validation) also showed similar results. The average R2 and RMSE of 200 validation results of the ERF model were 0.822 and 1.68 gC m−2 d−1, respectively, which were obviously better than other models (Fig. S3). In order to further prove the robustness of the ERF model, we also used GPP estimate models with original parameters for modeling and validation. As shown in Fig. S4, the performance of these GPP estimate models decreased significantly, with R2 ranging from 0.570 to 0.719 and RMSE ranging from 2.29 to 3.81 gC m−2 d−1. The phenomenon of high-value underestimation and low-value overestimation was also pronounced. However, the ERF model maintained a consistent advantage, with R2 significantly higher than other GPP estimate models (0.856). In addition, we tested the effect of the number of GPP estimate models on the accuracy of the ERF model. As shown in Table S8, as the number of GPP observations in the ERF model increased, the performance gain of the model gradually decreased.
In summary, GPPERF showed high accuracy in terms of vegetation type and the ability to interpret monthly variations in GPP, which also illustrates the potential of the ERF model to improve the GPP estimate. However, it was observed that most GPP simulations exhibited the phenomenon of high-value underestimation and low-value overestimation. For example, GPPEC, GPPREC, GPPMODIS, and GPPRF showed obvious underestimation in the months when the monthly GPP value surpassed 15 gC m−2 d−1 (Fig. 2). Therefore, it is necessary to evaluate the performance of different models in each month and with different subranges.
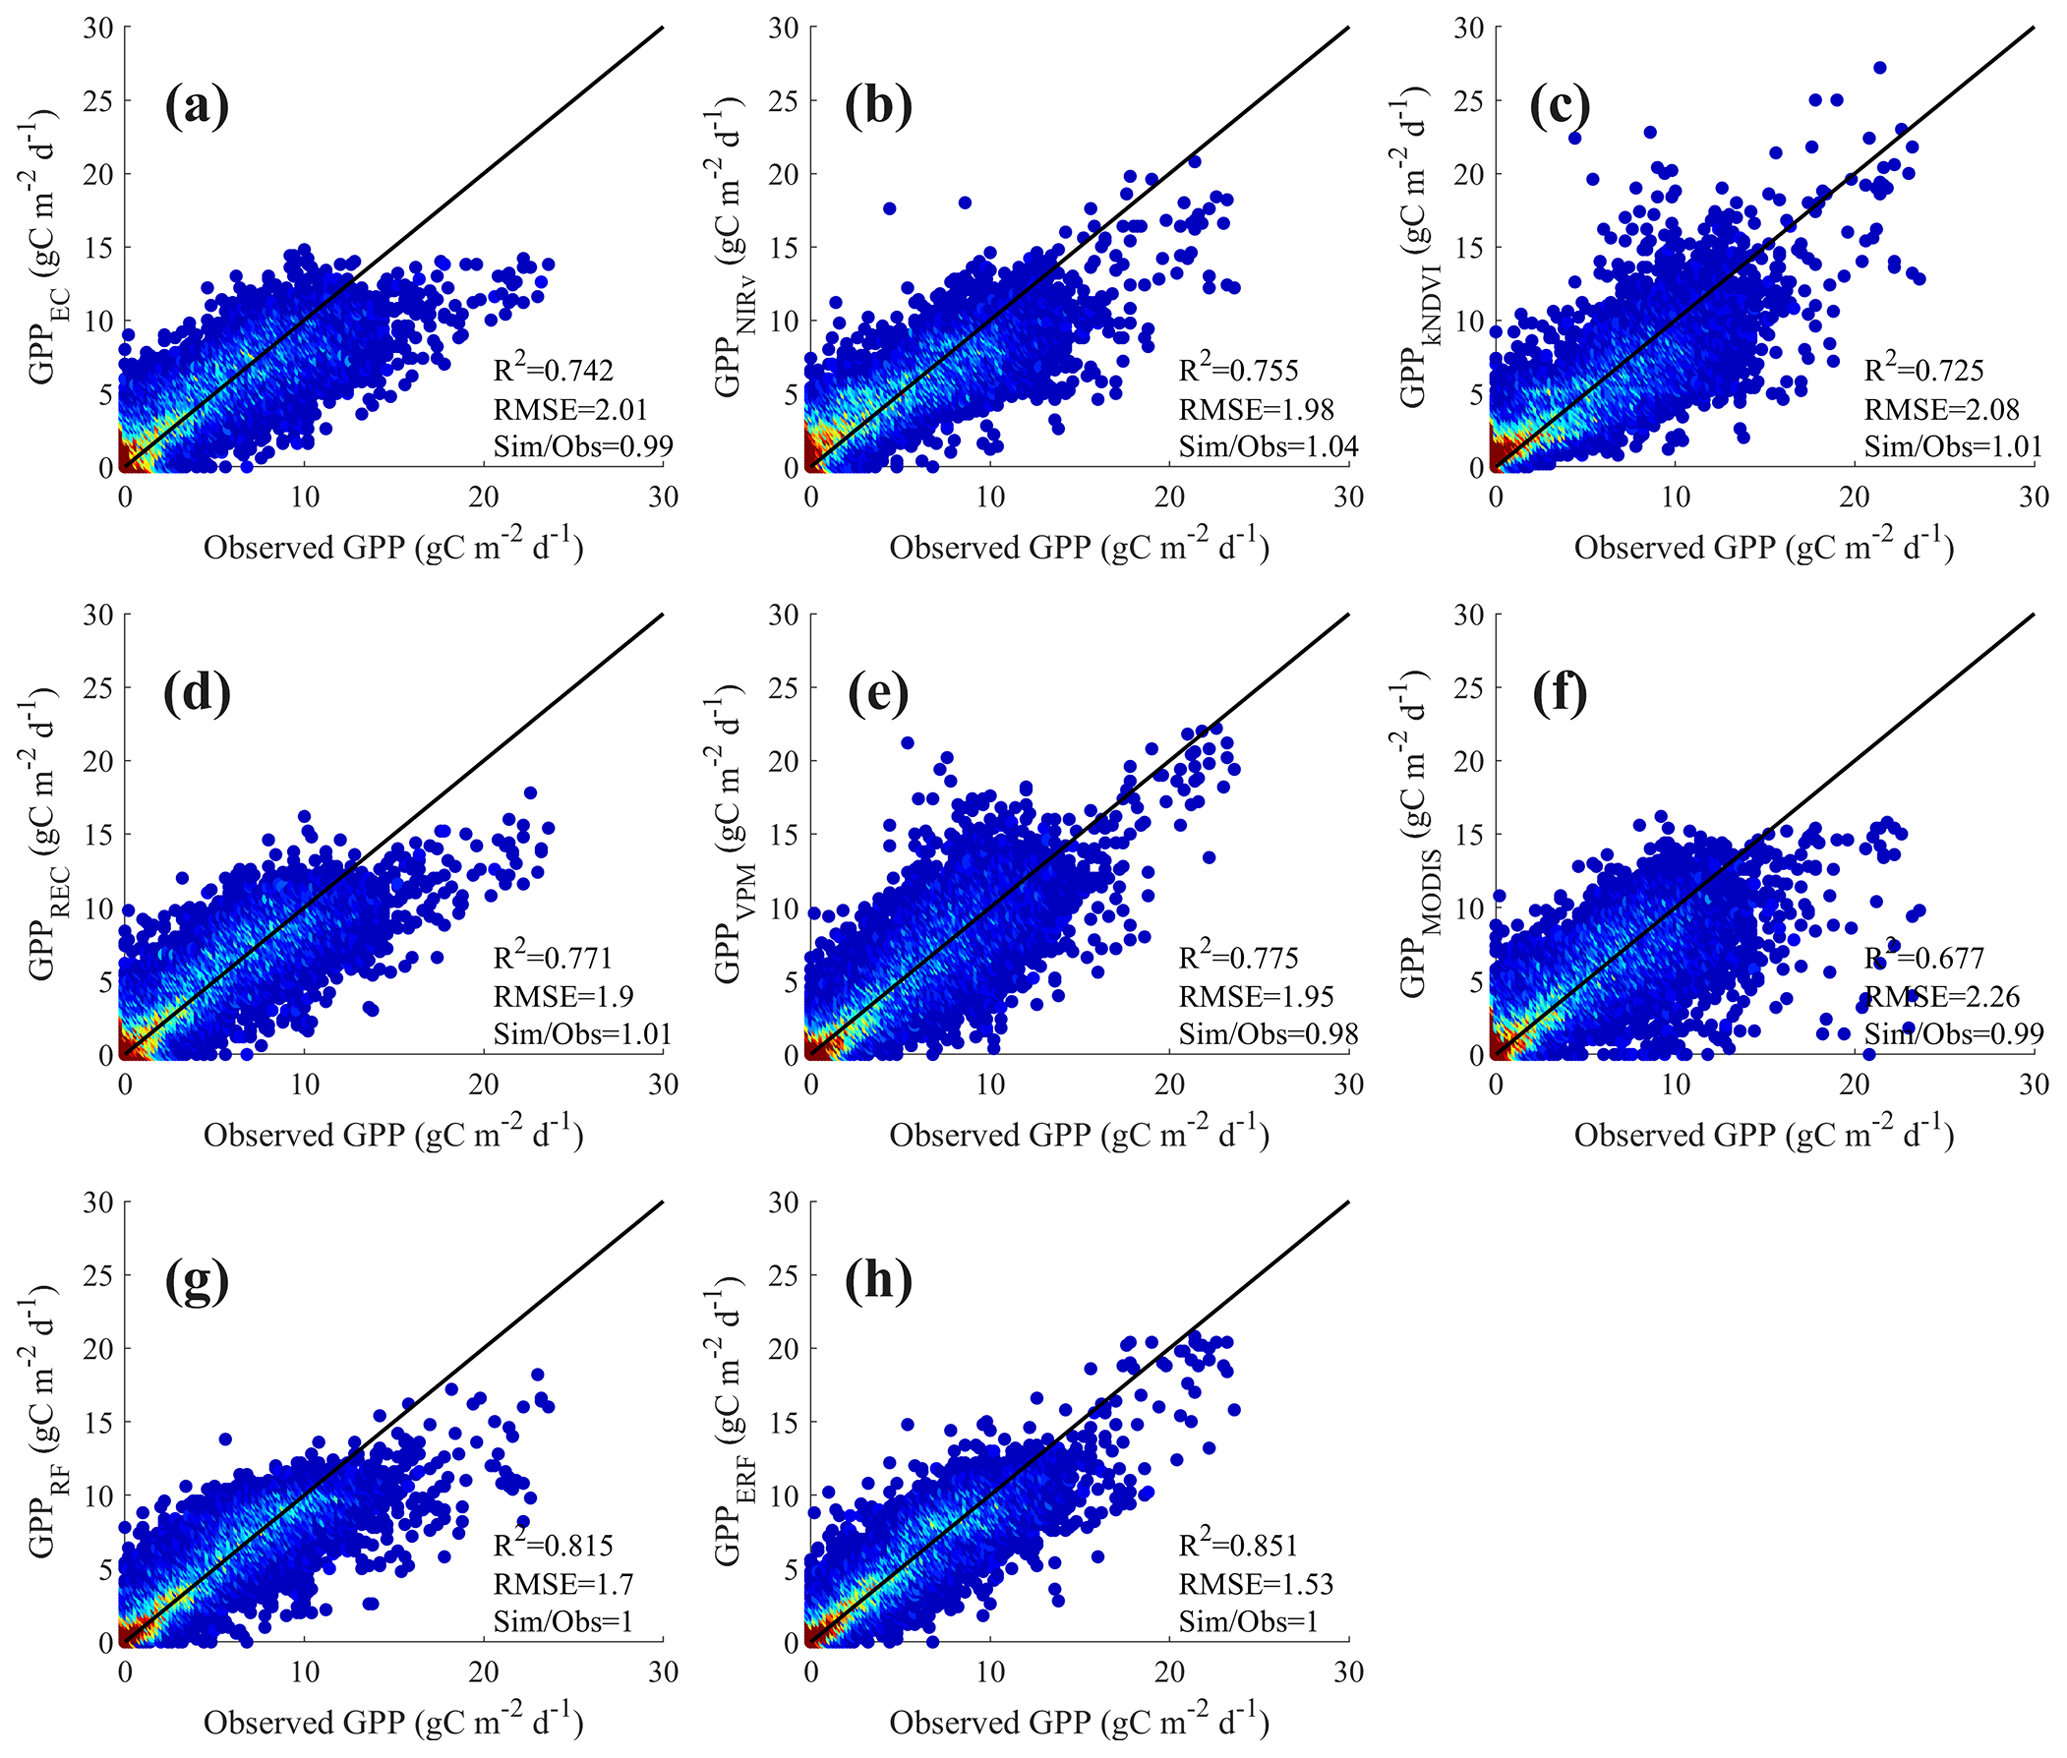
Figure 2Comparison between the GPP simulations of the eight models and the GPP observations. Panels (a)–(h) represent GPPEC, GPPNIRv, GPPkNDVI, GPPREC, GPPVPM, GPPMODIS, GPPRF, and GPPERF, respectively.
3.2 Performance of the GPP estimate models in each month and with different subranges
Figure 3 shows the simulation accuracy of the eight models in each month. The ERF model maintained a higher accuracy than other GPP estimate models, with GPPERF consistently achieving higher R2 and lower RMSE in most months and with no evident phenomenon of high-value underestimation and low-value overestimation. In contrast, the accuracy of other GPP estimate models was less satisfactory, especially during winter (most flux sites are concentrated in the Northern Hemisphere). The LUE models tended to underestimate GPP, and the Sim / Obs ratio remained in the range 0.72–1.01, although R2 values were above 0.7. Meanwhile, the vegetation index models overestimated GPP, Sim / Obs remained in the range 1.34–1.73, and R2 values were relatively low (mostly around 0.6).
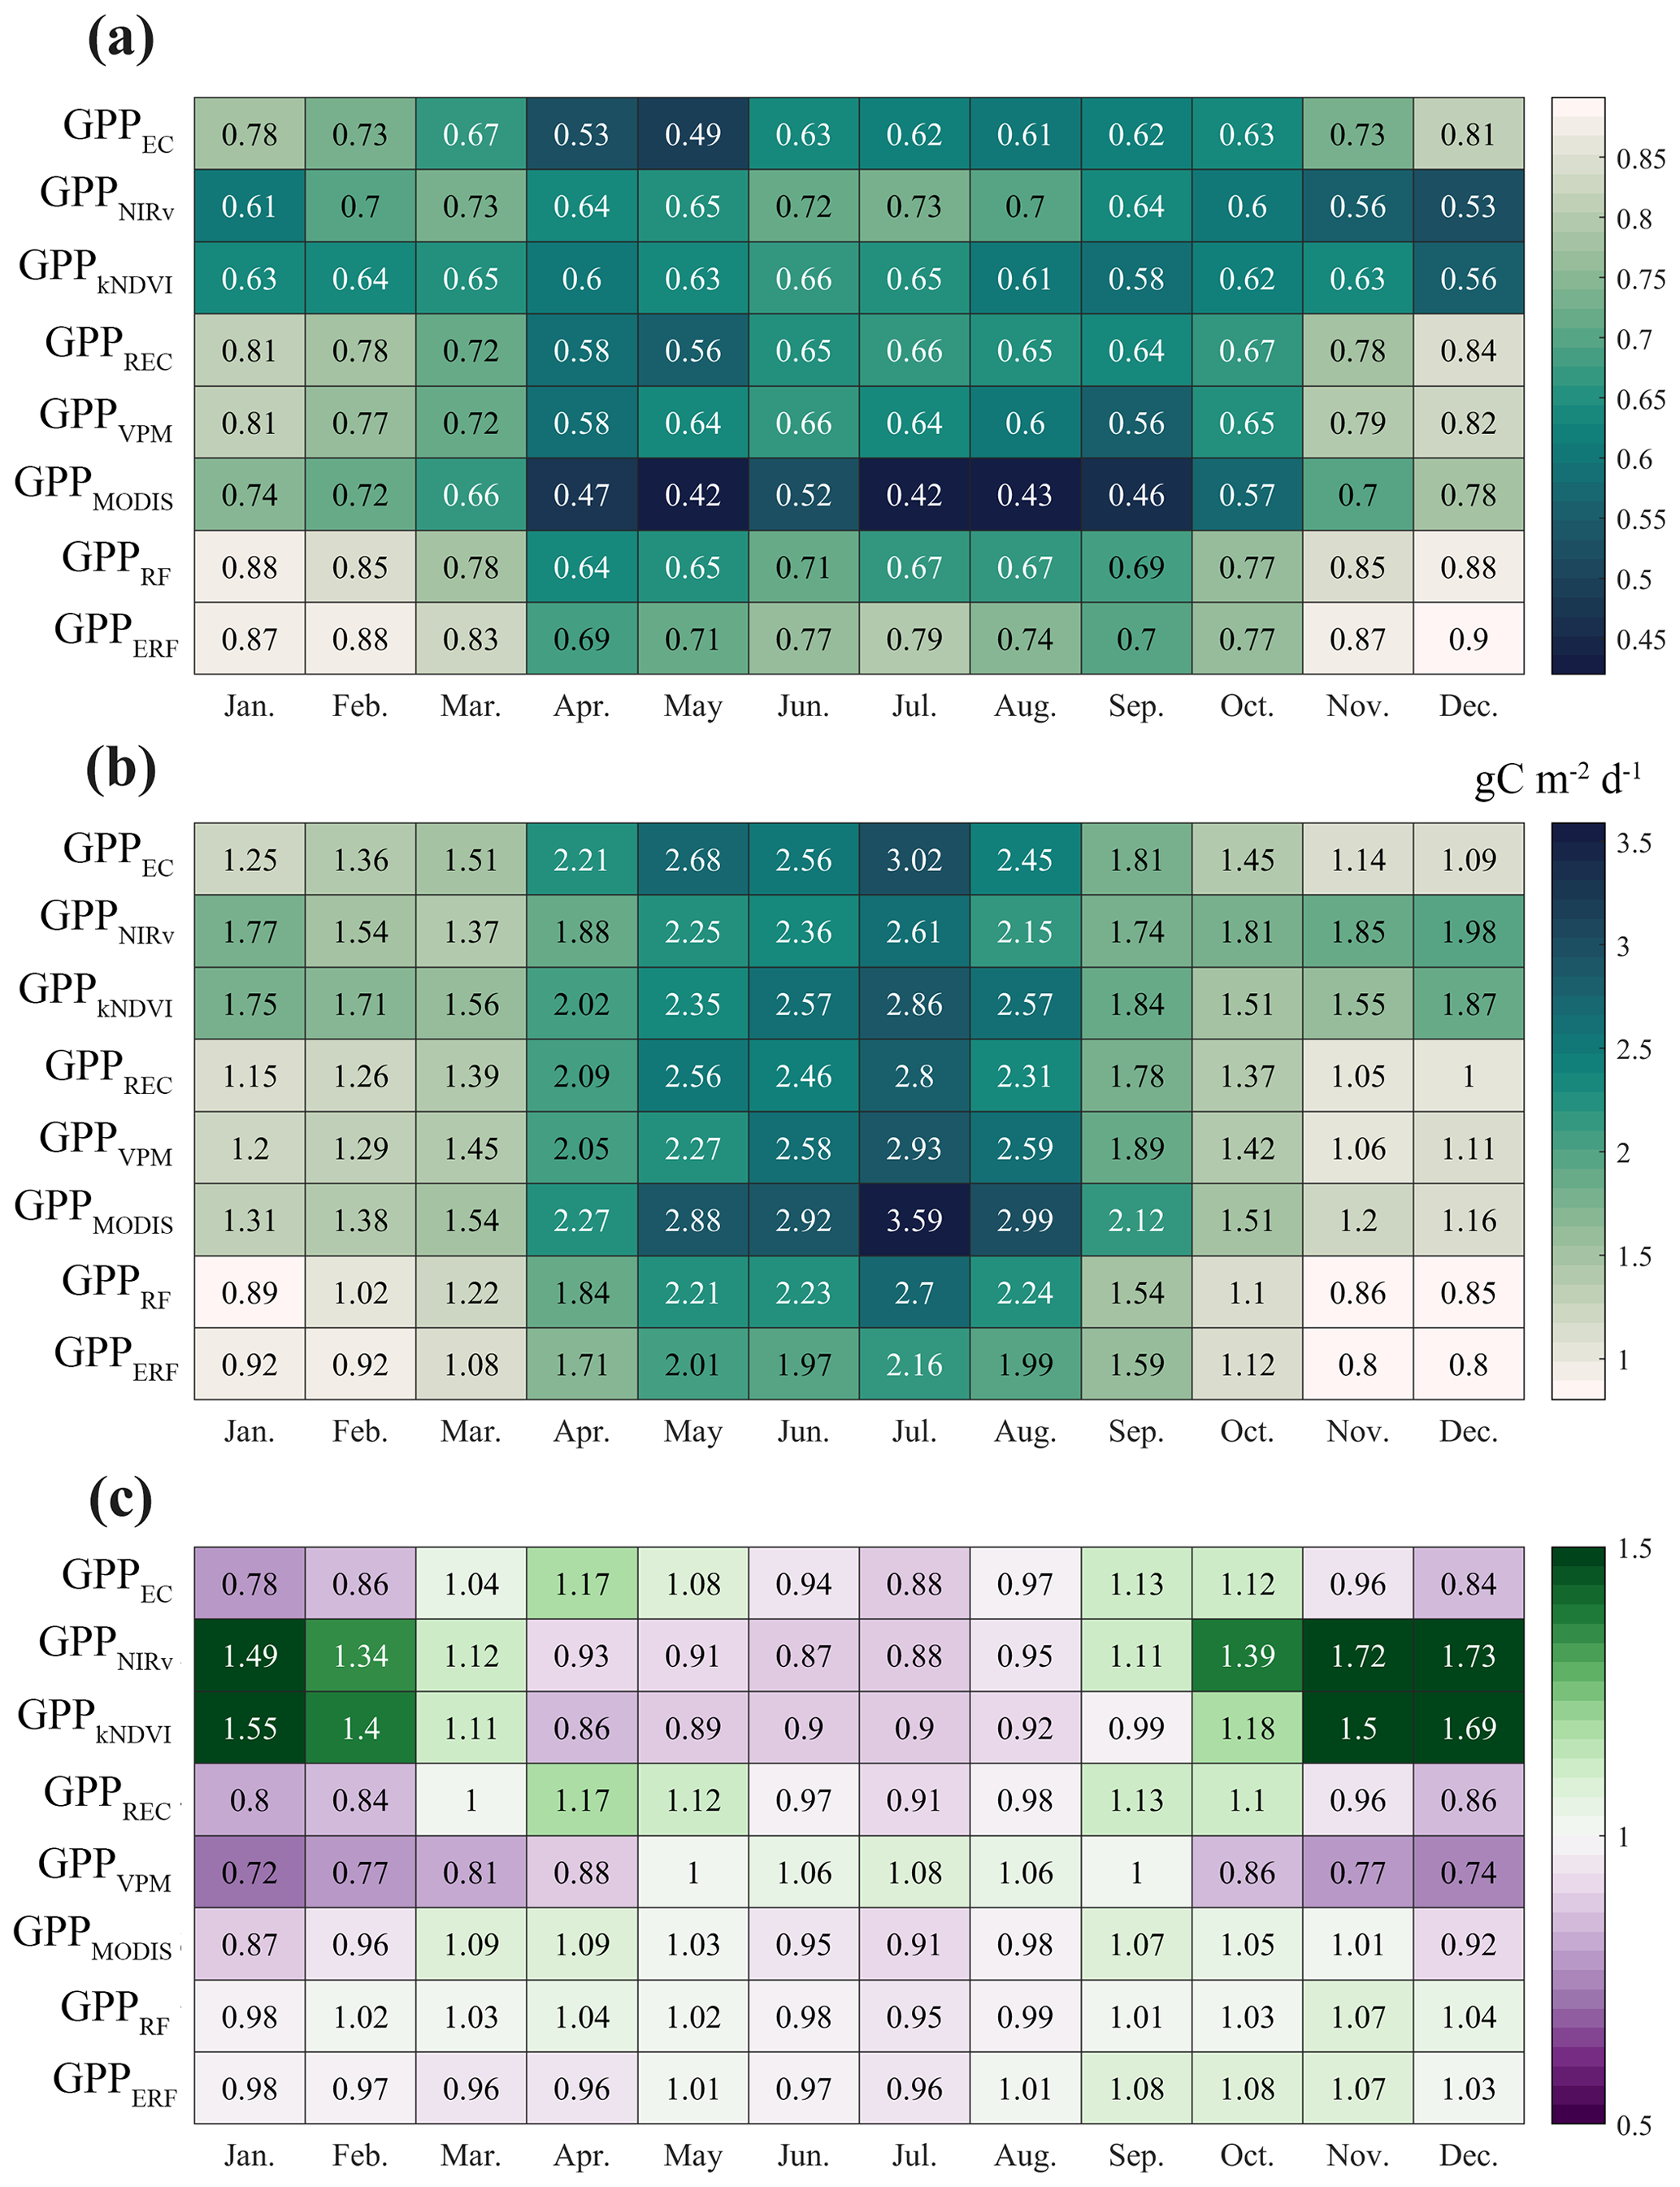
Figure 3Performance of the eight models in each month. Panels (a), (b), and (c) represent R2, RMSE, and Sim / Obs, respectively.
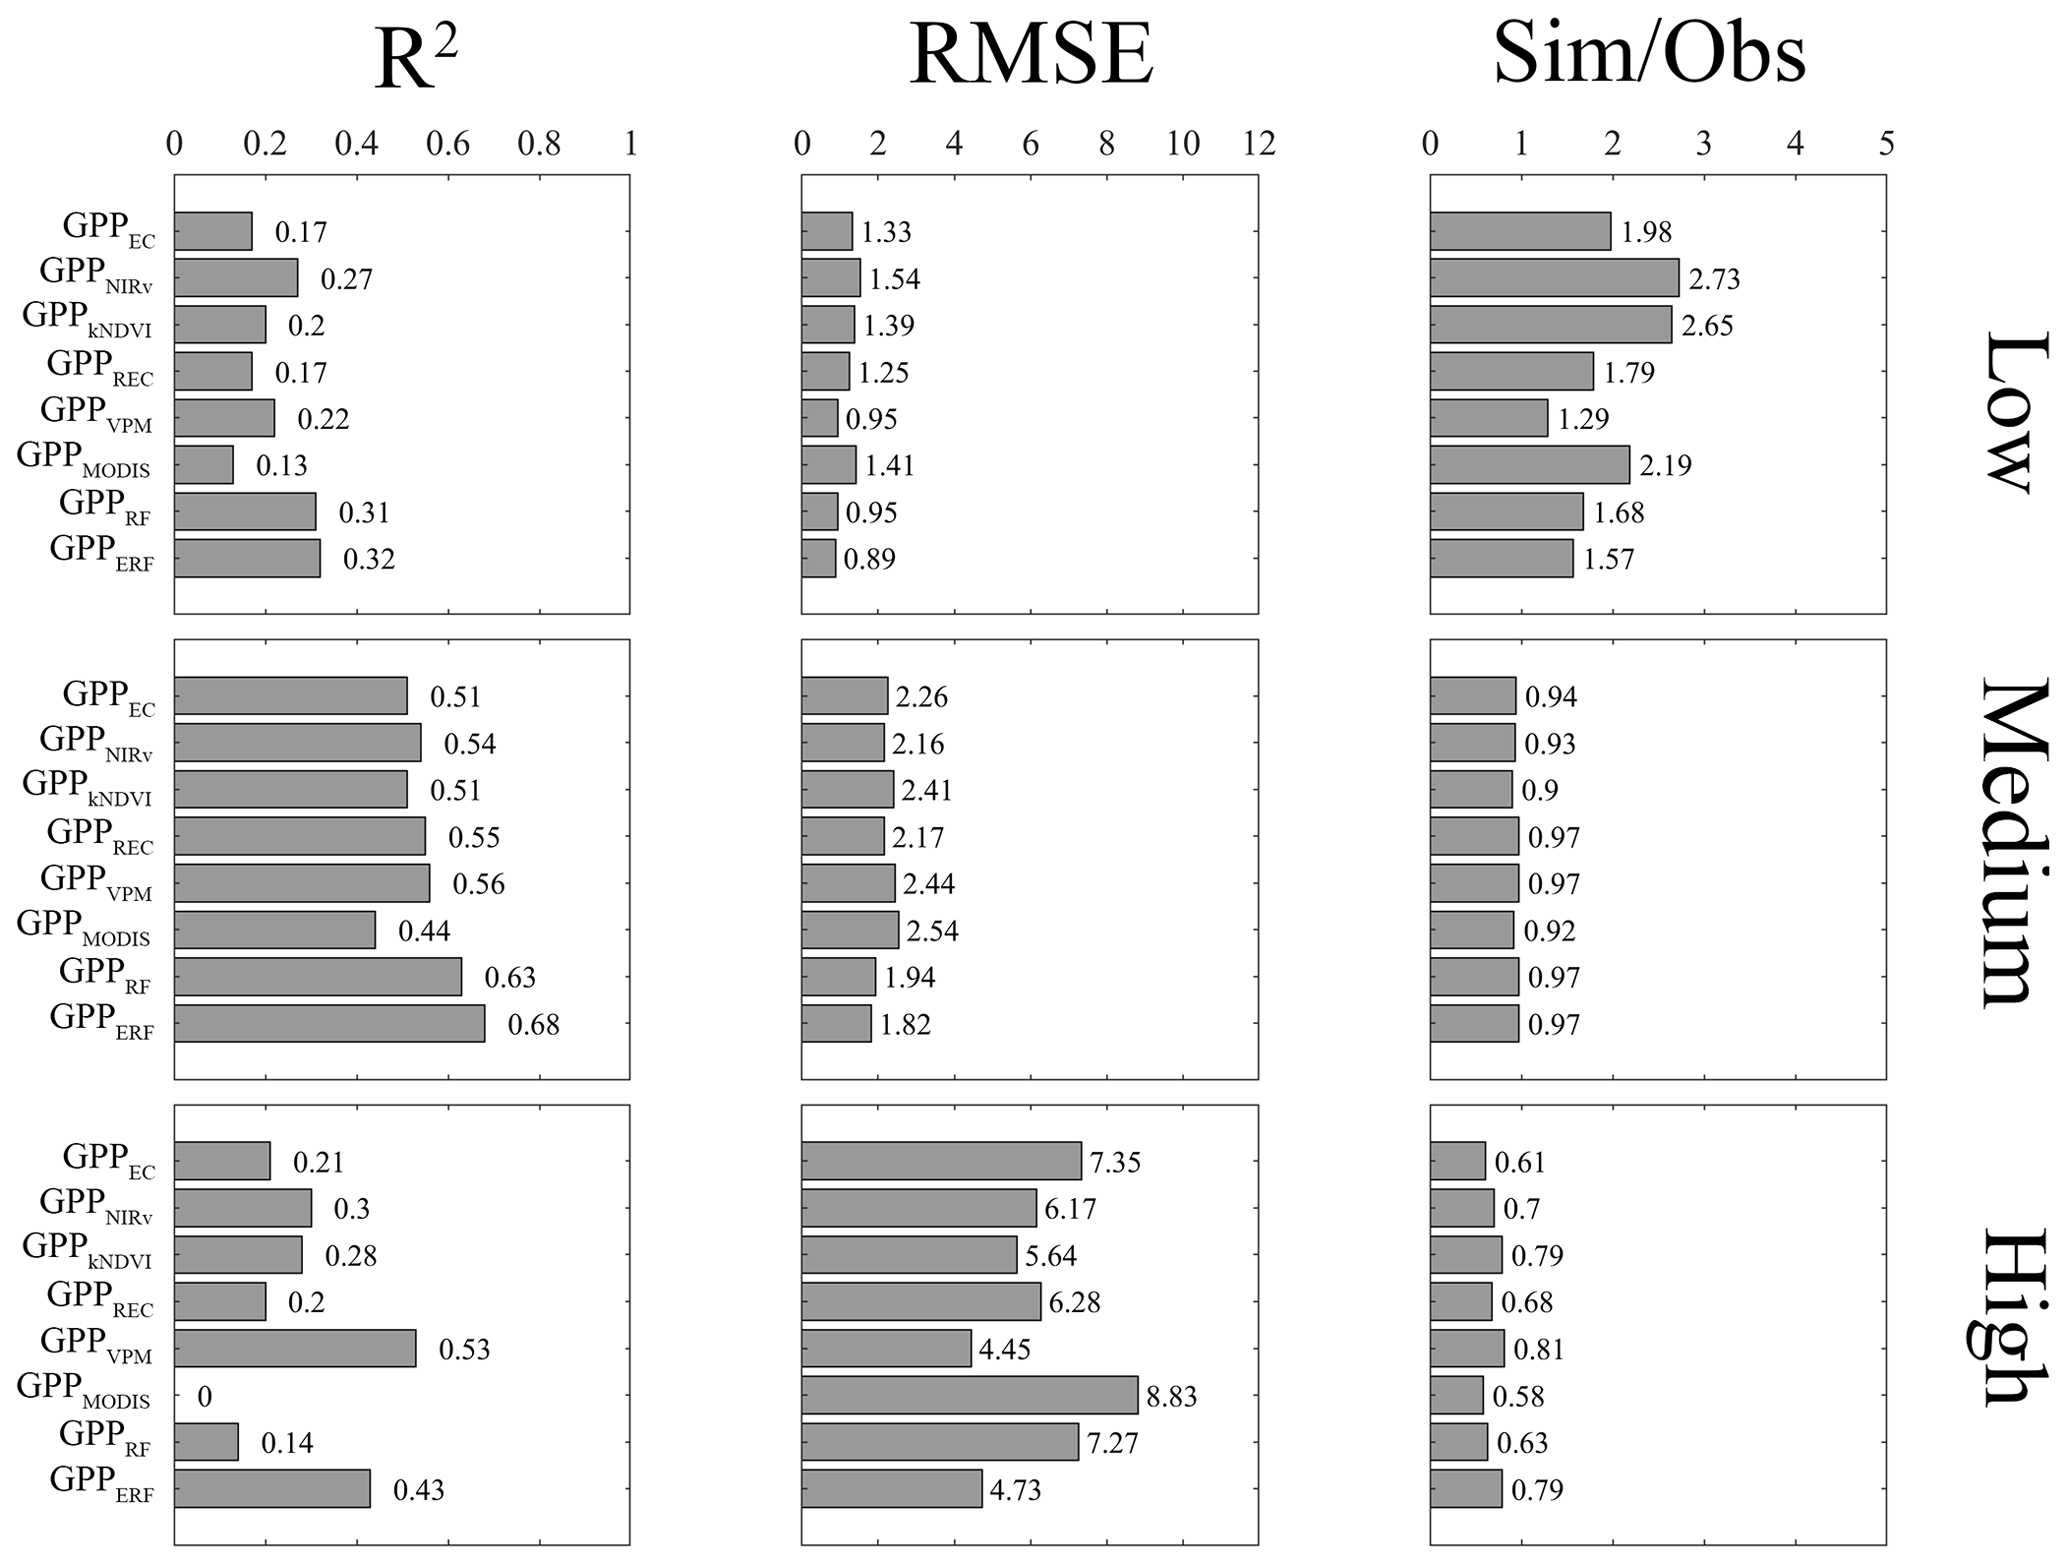
We further compared the performance of all models with different subranges, including high (GPP >15 gC m−2 d−1), medium (15 gC m−2 d−1 > GPP >2 gC m−2 d−1), and low values (GPP <2 gC m−2 d−1). For extreme values, most models performed poorly (Fig. 4), with R2 for GPP estimate models falling below 0.3, and only GPPVPM showed a better performance in the high-value range. GPPERF demonstrated some improvement in both low- and high-value ranges, with R2 values of 0.32 and 0.43, RMSE values of 0.89 and 4.73 gC m−2 d−1, and Sim / Obs ratios closer to 1, respectively. In the medium-value range, all models performed better, with no significant bias in the GPP estimate. The R2 of GPP estimate models ranged from 0.44 to 0.68, and the RMSE remained between 1.82 and 2.54 gC m−2 d−1. Further analysis was made at two typical sites. It was obvious that GPPEC, GPPREC, and GPPMODIS at Qianyanzhou in China (CN-Qia) exhibited obvious underestimation during the growing season (Fig. S5). At Lägeren forest in the Jura Mountain range (CH-Lae), GPPkNDVI and GPPVPM were significantly overestimated (Fig. S6). In contrast, at both sites, GPPERF was more consistent with observations.
3.3 Temporal and spatial characteristics of ERF_GPP and its generalization evaluation
Figure 5a shows the spatial distribution of the multi-year average of ERF_GPP. The high values of GPP were mainly concentrated in tropical areas (exceeding 10 gC m−2 d−1) and were relatively high in southeastern North America, Europe, and southern China (about 4–6 gC m−2 d−1). From 2001–2022, China and India showed the fastest increase in GPP, mostly at 0.1 gC m−2 d−1 (Fig. 5b), similar to a previous study that reported that China and India led the global greening (Chen et al., 2019). We further investigated the annual maximum GPP, as shown in Fig. 5c, and the North American Corn Belt was the global leader in GPP at more than 15 gC m−2 d−1 compared to only 10 gC m−2 d−1 in most tropical forests. In 2001–2022, the global GPP was 132.7±2.8 PgC yr−1, with an increasing trend of 0.42 PgC yr−2 (Fig. 5d). The lowest value was 128.6 PgC yr−1 in 2001, and the highest value was 136.2 PgC yr−1 in 2020.
The results of the two uncertainty analyses consistently indicated that ERF_GPP exhibited higher uncertainty in tropical regions (Figs. S7 and S8), and the uncertainty of ERF_GPP caused by the number of GPP observations was relatively small. The standard deviation of 100 simulations was about 0.3 gC m−2 d−1 in the tropics and lower in other regions (below 0.1 gC m−2 d−1). In contrast, the uncertainty of ERF_GPP caused by the number of features was more pronounced, especially when fewer features were included in the model. It is worth noting that when the number of features was five the uncertainty was already substantially less, and the standard deviation was generally lower than 0.5 gC m−2 d−1.
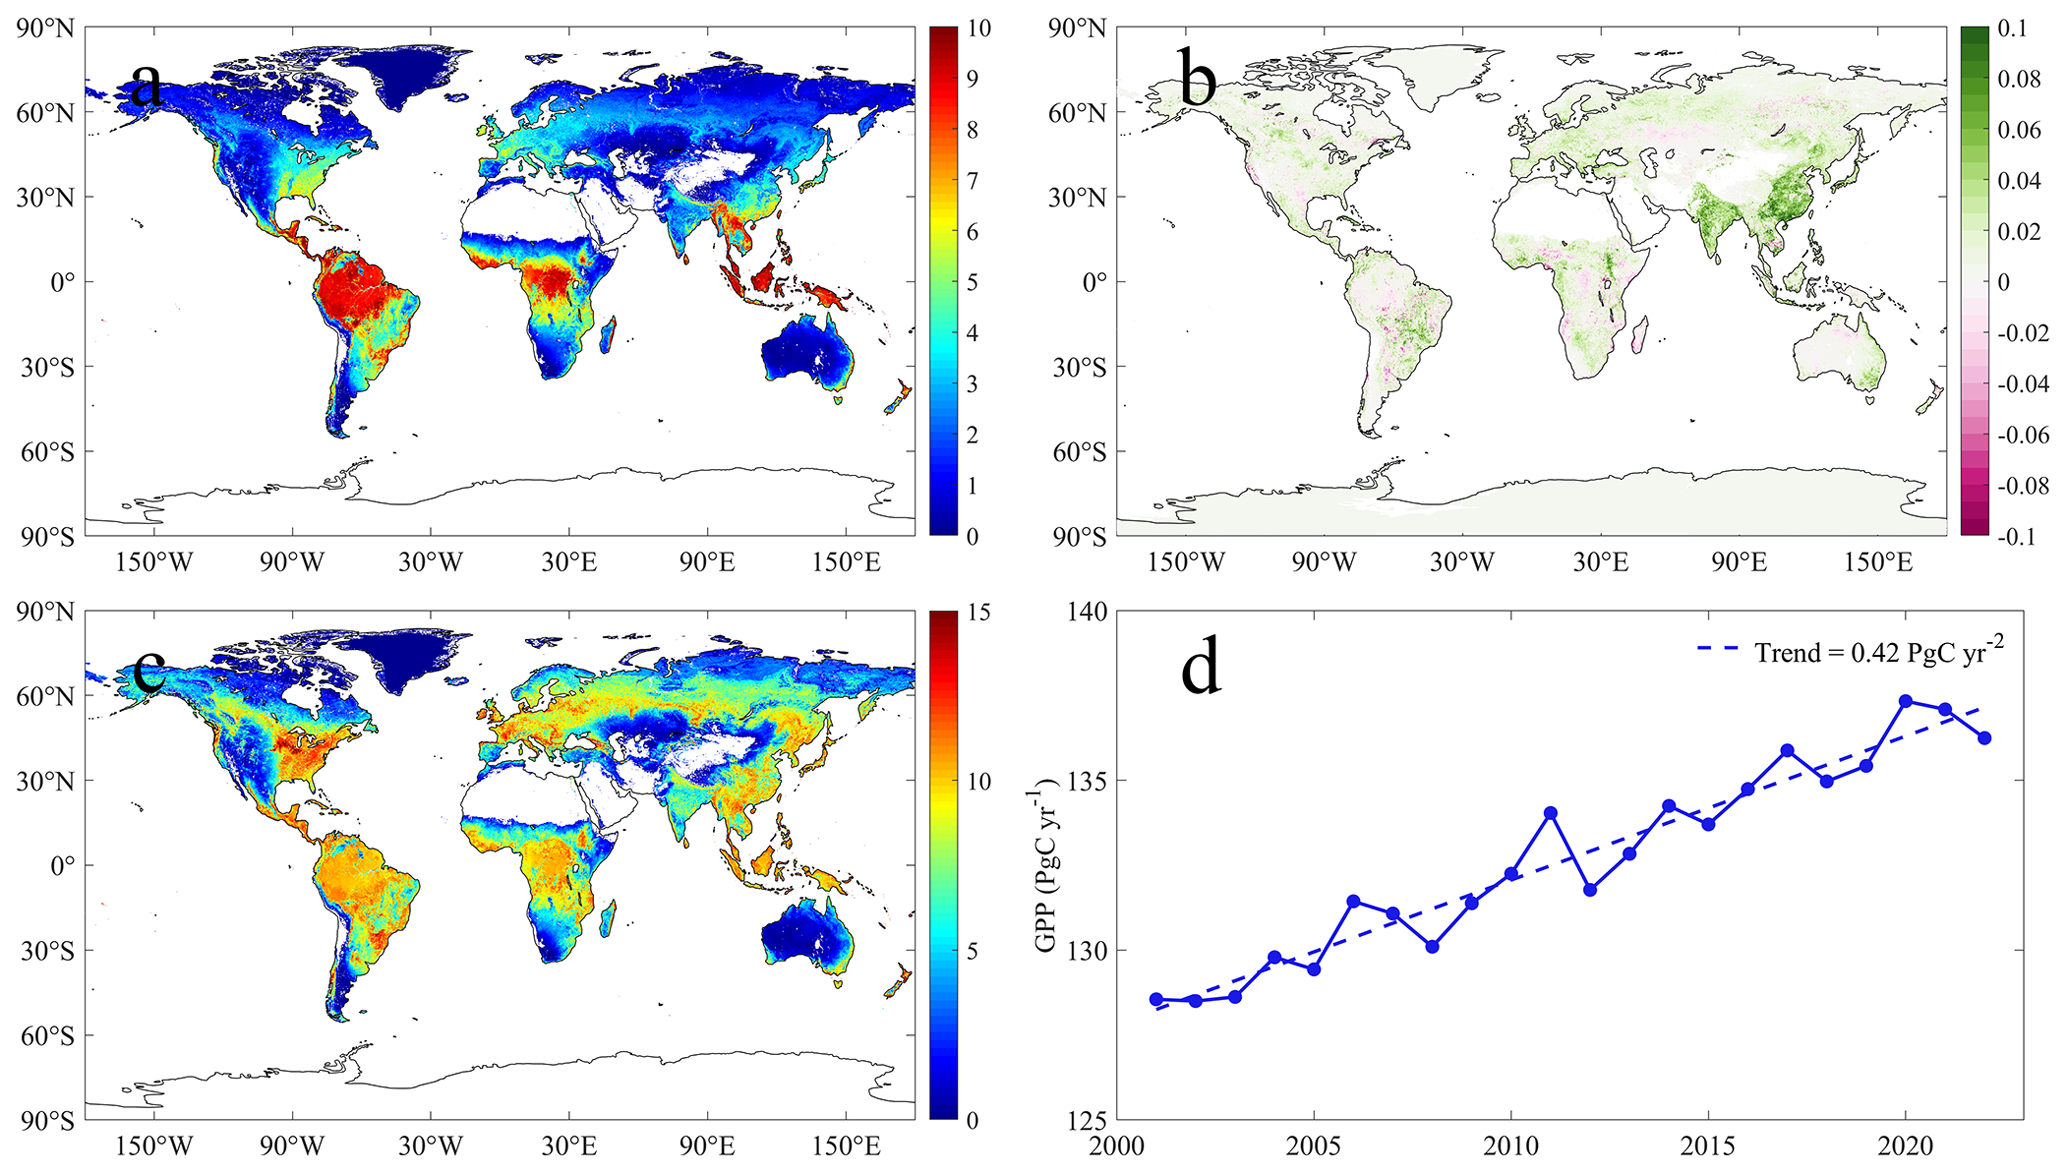
Figure 5Spatial and temporal characteristics of ERF_GPP during 2001–2022. Panel (a) represents the multi-year average, (b) represents the trend, (c) represents the multi-year average of the annual maximum, and (d) represents the interannual change in GPP.
As shown in Fig. 6, ERF_GPP and other GPP datasets were validated using GPP observations from ChinaFLUX. Among all models, VPM demonstrated the best performance, with R2 of 0.86 and RMSE of 1.34 gC m−2 d−1. ERF_GPP also exhibited high generalization, with R2 of 0.75 and RMSE of 1.72 gC m−2 d−1. There was no high-value underestimation and low-value overestimation phenomenon, which was comparable to the accuracy of BESS and GOSIF. However, the simulation accuracy of the other GPP datasets in ChinaFLUX was relatively poor, with the R2 of NIRv being only 0.64, while FLUXCOM-ENS, FLUXCOM-RF, MODIS, and Revised-EC-LUE were significantly underestimated, with Sim / Obs being only from 0.71 to 0.89. In the validation of FLUXNET, the R2 values of FLUXCOM-ENS, MODIS, and Revised-EC-LUE ranged from 0.57 to 0.67, and the RMSE ranged from 2.67 to 3.30 gC m−2 d−1. The models exhibited different degrees of underestimation (Fig. S9). Other GPP datasets demonstrated similar performances, with ERF_GPP being the best (R2=0.74; RMSE =2.26 gC m−2 d−1).
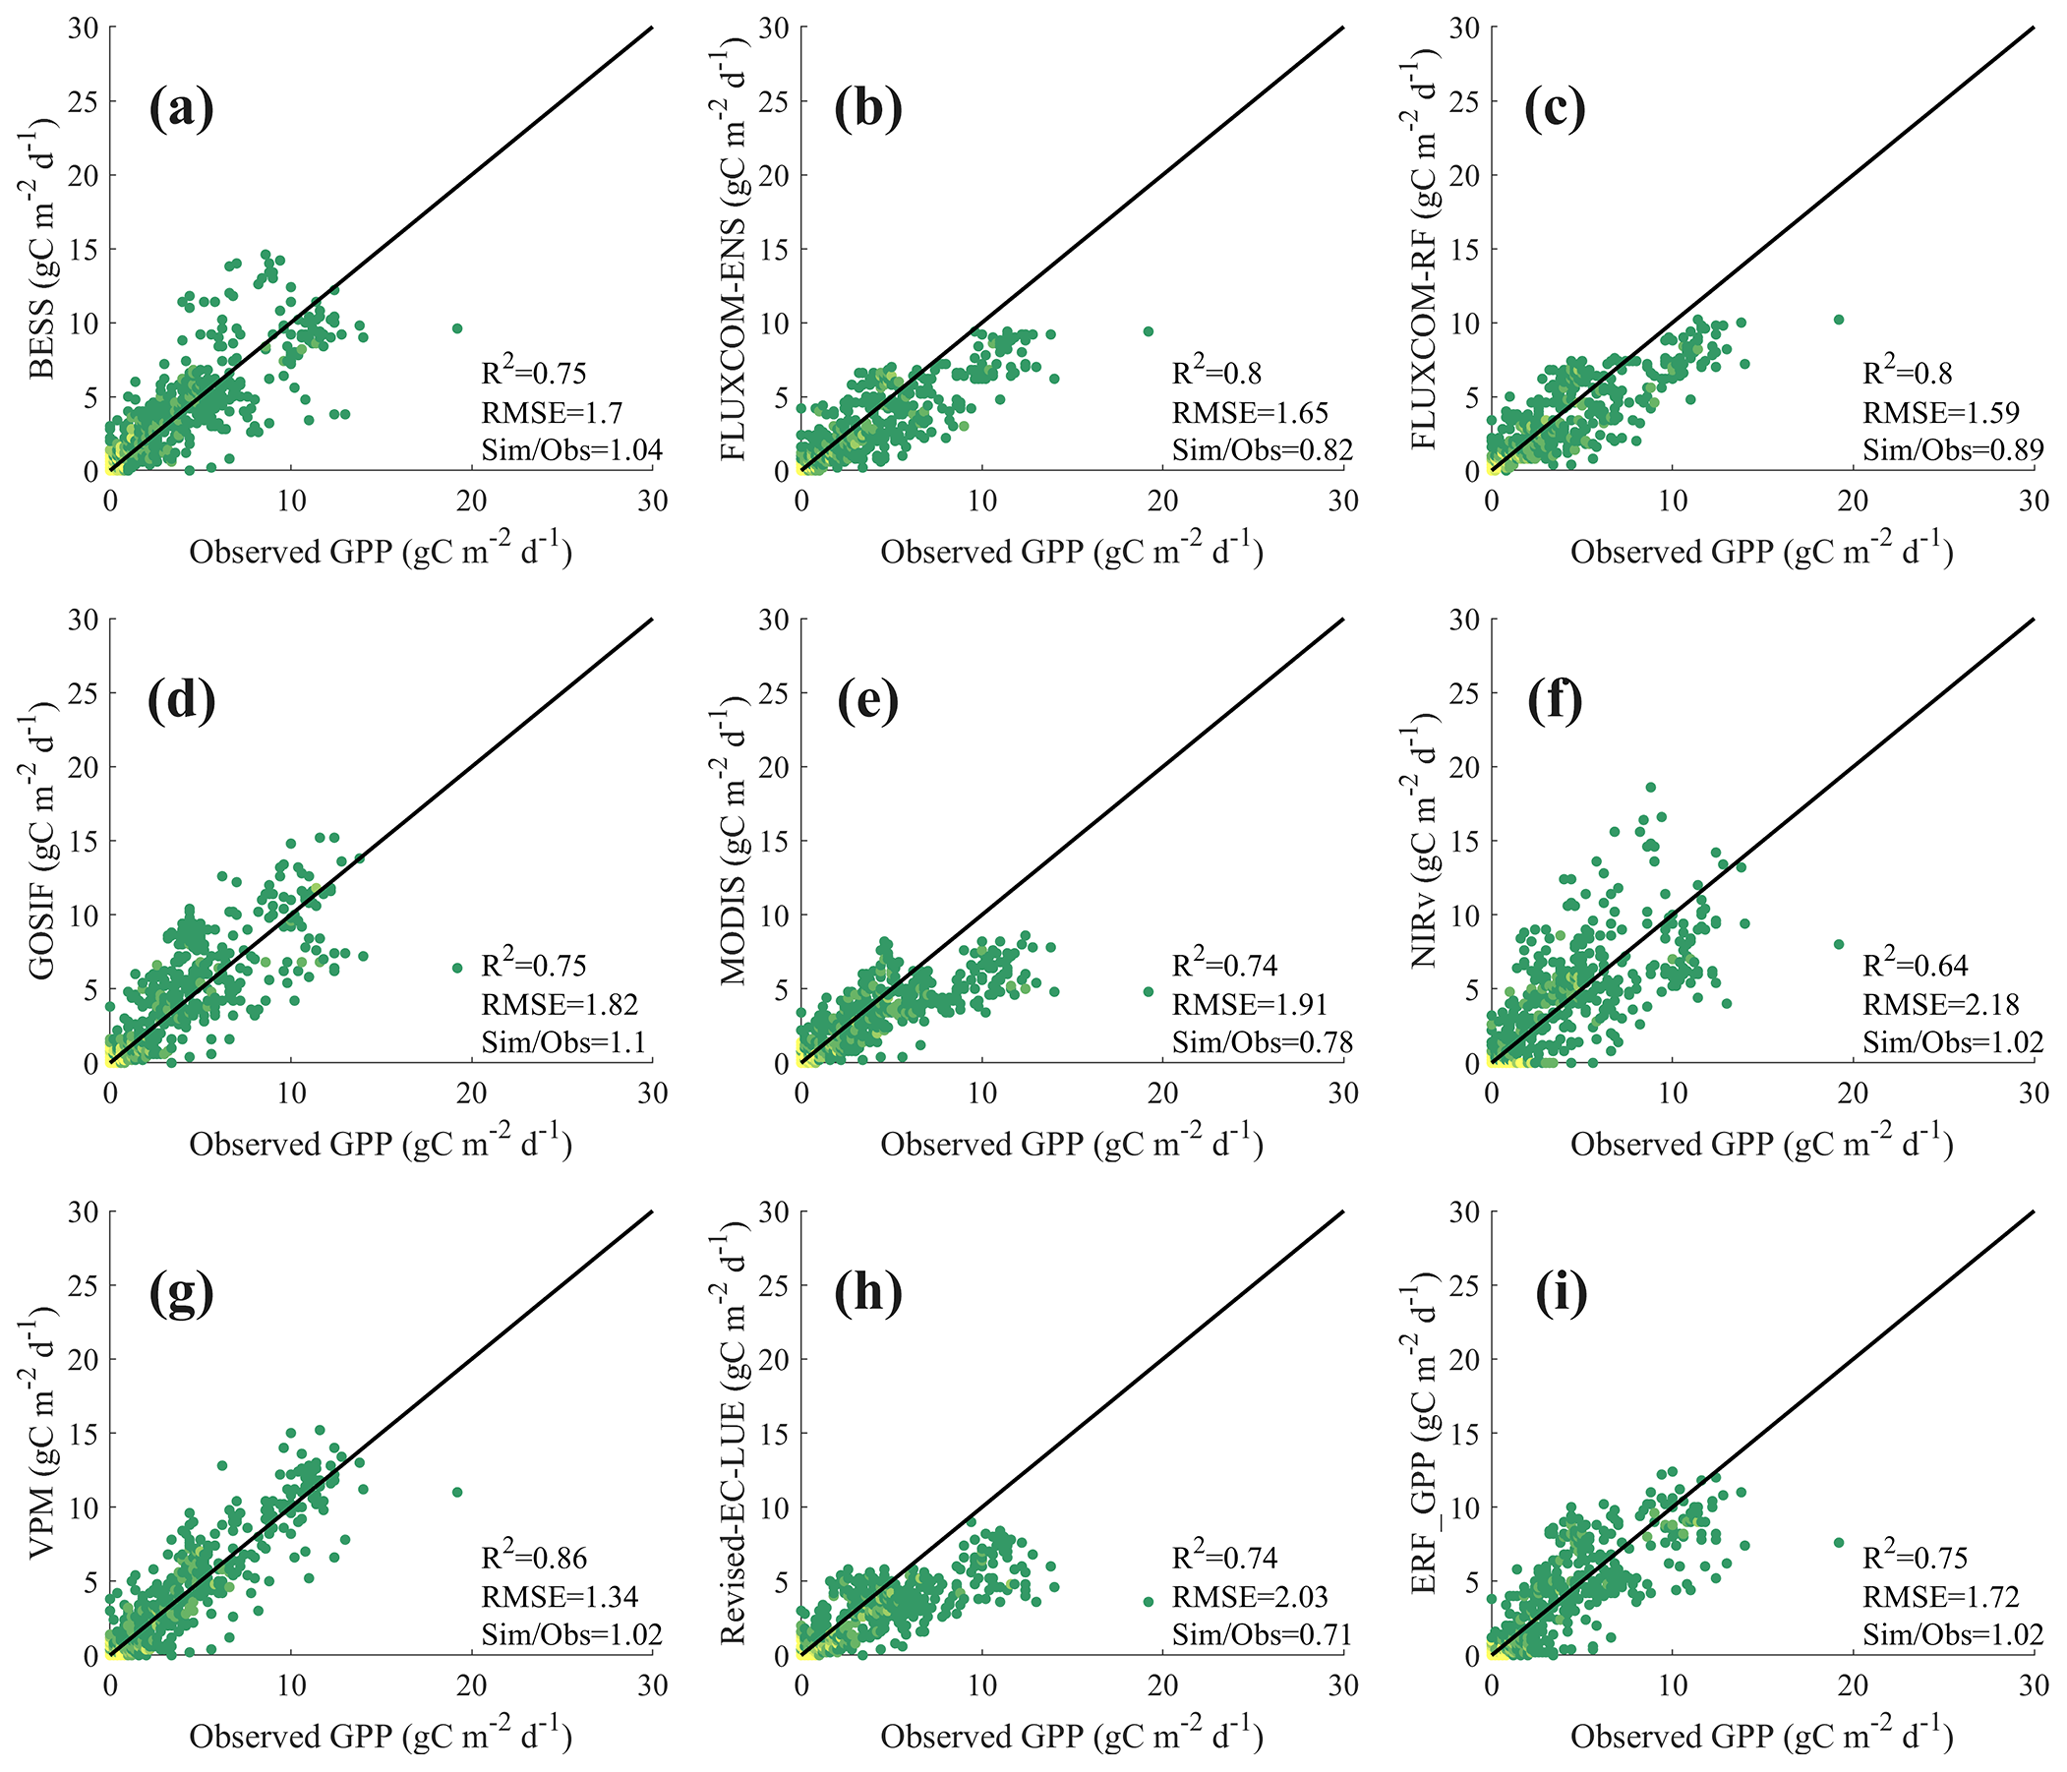
Figure 6Comparison between the GPP datasets and the GPP observations from ChinaFLUX. Panels (a)–(i) represent BESS, FLUXCOM-ENS, FLUXCOM-RF, GOSIF, MODIS, NIRv, VPM, Revise-EC-LUE, and ERF_GPP, respectively.
4.1 Performance analysis of different models
After parameter calibration, both LUE and vegetation index models obtained reliable model accuracy. However, noticeable errors persist in different months and subranges, indicating the prevalent phenomenon of high-value underestimation and low-value overestimation (Figs. 1–4). In addition to MODIS, the GPP simulated by the other three LUE models is generally underestimated in winter (Fig. 3), which may be caused by biases in the parameters used in meteorological constraints. In the mathematical form of the temperature constraint adopted by LUE models, the maximum temperature, minimum temperature, and optimum temperature for limiting photosynthesis are all constants; however, these values may not be fixed (Grossiord et al., 2020; Huang et al., 2019). A previous study has demonstrated that the GPP estimate could be effectively improved by using dynamic temperature parameters (Chang et al., 2021). Moreover, the form of meteorological constraint is also an important influencing factor. Compared with other LUE models, VPM does not use VPD constraints but incorporates the land surface water index from satellite observations as constraints (Xiao et al., 2004), which may be the reason why the model performs better than other models at high values (Fig. 4). Conversely, the two vegetation index models overestimated GPP in winter, and they even overestimated it by 70 % in December. The vegetation index model does not consider meteorological constraints that assume that all environmental impacts on vegetation have been included in the vegetation indices (kNDVI, NIRv) (Badgley et al., 2017; Camps-Valls et al., 2021). However, it is a fact that under high-temperature or low-radiation conditions the vegetation index may still maintain the appearance of high photosynthesis (greening) while in fact the GPP is low (Doughty et al., 2021; Yang et al., 2018; Chen et al., 2024b). Furthermore, the relationship between these vegetation indices and GPP is not robust, and the vegetation indices based on reflectance may have hysteresis (Wang et al., 2022).
Compared to other GPP estimate models, the ERF model demonstrated better performance (R2=851). Since there are no physical constraints, the machine learning model needs to find the relationship between explanatory variables and a target variable from a large amount of training data (such as GPP =f (LAI, T, P, etc.)) (Guo et al., 2023; Jung et al., 2020). Therefore, the reliability of the model usually depends on the representativeness of the training data. For example, LAI can explain GPP to a large extent, while complex modeling relationships are still needed from LAI to GPP. The difference between the ERF model and the RF model lies in the explanatory variables. The ERF model uses multiple GPP simulations that are more representative of and aligned with the target variable, thus making the GPP simulations more accurate. In other words, the ERF model does not need to take into account the uncertainties of the model structure (such as meteorological constraints) and model parameters (such as maximum light use efficiency), but it rather focuses on the uncertainties inherent in the simulated GPP. To further clarify the impact of explanatory variables on the ERF model, we conducted a feature importance analysis (Fig. S10). From an average of 200 times, the results of the ERF model did not depend on a single GPP simulation. Even GPPMODIS, with the highest relative importance, accounted for no more than 25 %, suggesting that the ERF model behaves more like a weighted average of multiple GPP simulations. In addition, it is important to emphasize that the accuracy of the ERF model is still robust even for GPP simulations of original parameters (Fig. S4), which means that we can try to use this method to integrate the currently published GPP datasets to obtain a more accurate global GPP estimate.
It is worth noting that in the study by Tian et al. (2023) the ERF model was also used to improve the GPP estimate. Our study extends this work in several ways. Firstly, parameter calibration was carried out in our study so that the final validation results are comparable; that is, differences in model performance are mainly due to the uncertainty of the model structure. Secondly, our study focused on the phenomenon of high-value underestimation and low-value overestimation of GPP estimate models, with results indicating that the ERF model performed well across various vegetation types, months, and subranges. Finally, we generated the ERF_GPP dataset and validated it on different observational datasets, further confirming the robustness of the ERF model in the GPP estimate.
4.2 Robustness of ERF_GPP
Due to the inherent advantages of the RF method, the accuracy of the model was comparable to that of the ERF model, even if a very simple model that used longitude, latitude, month, and year as explanatory variables (Fig. S11a). However, the global GPP estimated by this model was not reliable (Fig. S11b). This illustrates that an excellent model performance based on the FLUXNET sites does not necessarily imply an equivalent prediction skill in other regions. The ERF model can overcome this limitation to some extent. On the one hand, the explanatory variables used in the model are derived from GPP simulations that contain a lot of remote sensing information, which can ensure that the global GPP estimated by the model is reliable. On the other hand, the second validation method further shows that the ERF model has good generalization and has greater potential than other models in estimating global GPP.
Since the current GPP datasets are generated based on remote sensing data and FLUXNET GPP observations, there is a strong similarity in spatial distribution among all GPP datasets. Therefore, the validation of GPP observations independent of FLUXNET is crucial. Validation results from GPP observations from ChinaFLUX indicated that ERF_GPP exhibited good generalization in China (R2=0.75), which was slightly lower than the accuracy of 5-fold cross-validation during modeling, possibly due to the mismatch between the 0.05° GPP estimate and the footprint of the flux tower (Chu et al., 2021). In addition, the validation of FLUXNET further confirms the reliability of ERF_GPP. Overall, this is comparable to or slightly better than the simulation accuracy of current mainstream GPP datasets. We also observed a clear improvement in the spatial maximum value of ERF_GPP in some corn-growing regions, such as the North American Corn Belt (Fig. 5c), which is supported by previous studies showing that C4 crops have much higher GPP peaks than other vegetation types (Yuan et al., 2015; Chen et al., 2011).
Due to the increasing drought trend, the constraining effect of water on vegetation is gradually increasing, and some studies have reported the decoupling phenomenon of LAI and GPP under some specific conditions (Jiao et al., 2021; Hu et al., 2022). However, in China and India with significant greening, GPP continues to increase in most datasets, and ERF_GPP supports this view. This phenomenon may be attributed to the low drought pressure on croplands in China and India due to irrigation, which poses less constraints on GPP (Ambika and Mishra, 2020; Ai et al., 2020). The global estimate of ERF_GPP is 132.7±2.8 PgC yr−1, which is close to estimates from most previous studies (Wang et al., 2021; Badgley et al., 2019). A study has suggested that global GPP may reach 150–175 PgC yr−1 (Welp et al., 2011); however, there is no further evidence to support this view. A recent study combining emergent constraints and multiple remote sensing datasets put the global GPP estimate for 2001–2014 at 126.8 PgC yr−1 (Chen et al., 2024a), and our results are very close to that value (130 PgC yr−1 for 2001–2014).
ERF_GPP exhibited higher uncertainty in tropical regions, and similar reports have been made in previously published GPP datasets (Badgley et al., 2019; Guo et al., 2023). The scarcity of flux observations in these regions, coupled with the well-known issue of cloud pollution and saturation in remote sensing data (Badgley et al., 2019), exacerbates the uncertainty in GPP estimates for these regions. Therefore, in future studies, on the one hand, more flux observations in tropical regions are needed, and on the other hand, attempts can be made to combine optical and microwave data to improve the GPP estimate.
4.3 Limitations and uncertainties
In this study, we improved the GPP estimate based on the ERF model. Nonetheless, there are still some limitations and uncertainties due to the availability of data and methods. First, C4 crop distribution maps were used in our study to improve estimates of cropland GPP. However, this dataset only represents the spatial distribution of crops around the year 2000, which introduces uncertainty into GPP simulations of cropland in a few alternating C3 and C4 areas. Secondly, the ERF model considers six GPP simulations, and it is not clear whether adding more GPP simulations to the model can further improve the GPP estimate. Finally, our model did not consider the effect of soil moisture on GPP, and some previous studies have highlighted the importance of incorporating soil moisture in GPP estimates, especially for dry years (Stocker et al., 2019, 2018).
In this study, we compared the performance of the ERF model with other GPP estimate models at the site scale, especially for the phenomenon of high-value underestimation and low-value overestimation, and we further developed the ERF_GPP dataset. Overall, GPPERF had higher model accuracy, explaining 85.1 % of the monthly GPP variations, and demonstrated reliable accuracy in different months, vegetation types, and subranges. Over the period from 2001 to 2022, the global estimate of ERF_GPP was 132.7±2.8 PgC yr−1, corresponding to an increasing trend of 0.42 PgC yr−2. Validation results from ChinaFLUX indicated that ERF_GPP had good generalization. For the current and emerging GPP estimate models, the ERF model provides an alternative method that can lead to better model accuracy.
The ERF_GPP dataset for 2001–2022 is available at https://doi.org/10.6084/m9.figshare.24417649 (Chen et al., 2023). The spatial resolution of ERF_GPP is 0.05°, and the temporal resolution is monthly. Code is available from the corresponding author upon reasonable request.
The supplement related to this article is available online at: https://doi.org/10.5194/bg-21-4285-2024-supplement.
XC and TC conceived the scientific ideas and designed this research framework. XC compiled the data, conducted analysis, and prepared figures. XC, TC, and YC wrote the article. XL, RG, JD, and SZ gave constructive suggestions for improving the article.
The contact author has declared that none of the authors has any competing interests.
Publisher’s note: Copernicus Publications remains neutral with regard to jurisdictional claims made in the text, published maps, institutional affiliations, or any other geographical representation in this paper. While Copernicus Publications makes every effort to include appropriate place names, the final responsibility lies with the authors.
We thank the two anonymous reviewers and the associate editor (Anja Rammig) for their thoughtful comments and help with this study.
This study was supported by the Natural Science Foundation of Qinghai Province (grant no. 2023-QLGKLYCZX-010), the National Natural Science Foundation of China (grant nos. 42130506, 42161144003, and 31570464), and the Postgraduate Research & Practice Innovation Program of Jiangsu Province (grant no. KYCX23_1322).
This paper was edited by Anja Rammig and reviewed by two anonymous referees.
Ai, Z., Wang, Q., Yang, Y., Manevski, K., Yi, S., and Zhao, X.: Variation of gross primary production, evapotranspiration and water use efficiency for global croplands, Agr. Forest Meteorol., 287, 107935, https://doi.org/10.1016/j.agrformet.2020.107935, 2020.
Ambika, A. K. and Mishra, V.: Substantial decline in atmospheric aridity due to irrigation in India, Environ. Res. Lett., 15, 107935, https://doi.org/10.1088/1748-9326/abc8bc, 2020.
Anav, A., Friedlingstein, P., Beer, C., Ciais, P., Harper, A., Jones, C., Murray-Tortarolo, G., Papale, D., Parazoo, N. C., Peylin, P., Piao, S., Sitch, S., Viovy, N., Wiltshire, A., and Zhao, M.: Spatiotemporal patterns of terrestrial gross primary production: A review, Rev. Geophys., 53, 785–818, https://doi.org/10.1002/2015rg000483, 2015.
Badgley, G., Field, C. B., and Berry, J. A.: Canopy near-infrared reflectance and terrestrial photosynthesis, Sci. Adv., 3, e1602244, https://doi.org/10.1126/sciadv.1602244, 2017.
Badgley, G., Anderegg, L. D., Berry, J. A., and Field, C. B.: Terrestrial gross primary production: Using NIRV to scale from site to globe, Glob. Change Biol., 25, 3731–3740, https://doi.org/10.1111/gcb.14729, 2019.
Bai, Y., Zhang, S., Bhattarai, N., Mallick, K., Liu, Q., Tang, L., Im, J., Guo, L., and Zhang, J.: On the use of machine learning based ensemble approaches to improve evapotranspiration estimates from croplands across a wide environmental gradient, Agr. Forest Meteorol., 298, 108308, https://doi.org/10.1016/j.agrformet.2020.108308, 2021.
Belgiu, M. and Drăguţ, L.: Random forest in remote sensing: A review of applications and future directions, ISPRS J. Photogramm., 114, 24–31, https://doi.org/10.1016/j.isprsjprs.2016.01.011, 2016.
Camps-Valls, G., Campos-Taberner, M., Moreno-Martínez, Á., Walther, S., Duveiller, G., Cescatti, A., Mahecha, M. D., Muñoz-Marí, J., García-Haro, F. J., Guanter, L., Jung, M., Gamon, J. A., Reichstein, M., and Running, S. W.: A unified vegetation index for quantifying the terrestrial biosphere, Sci. Adv., 7, eabc7447, https://doi.org/10.1126/sciadv.abc7447, 2021.
Chang, Q., Xiao, X. M., Doughty, R., Wu, X. C., Jiao, W. Z., and Qin, Y. W.: Assessing variability of optimum air temperature for photosynthesis across site-years, sites and biomes and their effects on photosynthesis estimation, Agr. Forest Meteorol., 298, 108277, https://doi.org/10.1016/j.agrformet.2020.108277, 2021.
Chen, C., Park, T., Wang, X., Piao, S., Xu, B., Chaturvedi, R. K., Fuchs, R., Brovkin, V., Ciais, P., Fensholt, R., Tommervik, H., Bala, G., Zhu, Z., Nemani, R. R., and Myneni, R. B.: China and India lead in greening of the world through land-use management, Nat. Sustain., 2, 122–129, https://doi.org/10.1038/s41893-019-0220-7, 2019.
Chen, T., van der Werf, G. R., Dolman, A. J., and Groenendijk, M.: Evaluation of cropland maximum light use efficiency using eddy flux measurements in North America and Europe, Geophys. Res. Lett., 38, L14707, https://doi.org/10.1029/2011gl047533, 2011.
Chen, T., van der Werf, G. R., Gobron, N., Moors, E. J., and Dolman, A. J.: Global cropland monthly gross primary production in the year 2000, Biogeosciences, 11, 3871–3880, https://doi.org/10.5194/bg-11-3871-2014, 2014.
Chen, X., Chen, T., Li, X. D., Chai, Y., Zhou, S., Guo, R., and Dai, J.: 2001–2022 global gross primary productivity dataset using an ensemble model based on random forest, figshare [data set], https://doi.org/10.6084/m9.figshare.24417649, 2023.
Chen, X., Chen, T., Liu, Y. Y., He, B., Liu, S., Guo, R., and Dolman, H.: Emergent constraints on historical and future global gross primary productivity, Glob. Change Biol., 30, e17479, https://doi.org/10.1111/gcb.17479, 2024a.
Chen, X., Chen, T., Liu, S., Chai, Y., Guo, R., Dai, J., Wang, S., Zhang, L., and Wei, X.: Vegetation Index-Based Models Without Meteorological Constraints Underestimate the Impact of Drought on Gross Primary Productivity, J. Geophys. Res.-Biogeo., 129, e2023JG007499, https://doi.org/10.1029/2023JG007499, 2024b.
Chen, Y., Yuan, H., Yang, Y., and Sun, R.: Sub-daily soil moisture estimate using dynamic Bayesian model averaging, J. Hydrol., 590, 125445, https://doi.org/10.1016/j.jhydrol.2020.125445, 2020.
Chu, H., Luo, X., Ouyang, Z., Chan, W. S., Dengel, S., Biraud, S. C., Torn, M. S., Metzger, S., Kumar, J., Arain, M. A., Arkebauer, T. J., Baldocchi, D., Bernacchi, C., Billesbach, D., Black, T. A., Blanken, P. D., Bohrer, G., Bracho, R., Brown, S., Brunsell, N. A., Chen, J., Chen, X., Clark, K., Desai, A. R., Duman, T., Durden, D., Fares, S., Forbrich, I., Gamon, J. A., Gough, C. M., Griffis, T., Helbig, M., Hollinger, D., Humphreys, E., Ikawa, H., Iwata, H., Ju, Y., Knowles, J. F., Knox, S. H., Kobayashi, H., Kolb, T., Law, B., Lee, X., Litvak, M., Liu, H., Munger, J. W., Noormets, A., Novick, K., Oberbauer, S. F., Oechel, W., Oikawa, P., Papuga, S. A., Pendall, E., Prajapati, P., Prueger, J., Quinton, W. L., Richardson, A. D., Russell, E. S., Scott, R. L., Starr, G., Staebler, R., Stoy, P. C., Stuart-Haëntjens, E., Sonnentag, O., Sullivan, R. C., Suyker, A., Ueyama, M., Vargas, R., Wood, J. D., and Zona, D.: Representativeness of Eddy-Covariance flux footprints for areas surrounding AmeriFlux sites, Agr. Forest Meteorol., 301–302, 108350, https://doi.org/10.1016/j.agrformet.2021.108350, 2021.
Dechant, B., Ryu, Y., Badgley, G., Zeng, Y., Berry, J. A., Zhang, Y., Goulas, Y., Li, Z., Zhang, Q., Kang, M., Li, J., and Moya, I.: Canopy structure explains the relationship between photosynthesis and sun-induced chlorophyll fluorescence in crops, Remote Sens. Environ., 241, 111733, https://doi.org/10.1016/j.rse.2020.111733, 2020.
Dechant, B., Ryu, Y., Badgley, G., Köhler, P., Rascher, U., Migliavacca, M., Zhang, Y., Tagliabue, G., Guan, K., Rossini, M., Goulas, Y., Zeng, Y., Frankenberg, C., and Berry, J. A.: NIRVP: A robust structural proxy for sun-induced chlorophyll fluorescence and photosynthesis across scales, Remote Sens. Environ., 268, 112763, https://doi.org/10.1016/j.rse.2021.112763, 2022.
Doughty, R., Xiao, X. M., Qin, Y. W., Wu, X. C., Zhang, Y., and Moore, B.: Small anomalies in dry-season greenness and chlorophyll fluorescence for Amazon moist tropical forests during El Nino and La Nina, Remote Sens. Environ., 253, 112196, https://doi.org/10.1016/j.rse.2020.112196, 2021.
Friedl, M. and Sulla-Menashe, D.: MODIS/Terra+Aqua Land Cover Type Yearly L3 Global 0.05Deg CMG V061, NASA EOSDIS Land Processes Distributed Active Archive Center [data set], https://doi.org/10.5067/MODIS/MCD12C1.061, 2022.
Grossiord, C., Buckley, T. N., Cernusak, L. A., Novick, K. A., Poulter, B., Siegwolf, R. T., Sperry, J. S., and McDowell, N. G.: Plant responses to rising vapor pressure deficit, New Phytol., 226, 1550–1566, https://doi.org/10.1111/nph.16485, 2020.
Guo, R., Chen, T., Chen, X., Yuan, W., Liu, S., He, B., Li, L., Wang, S., Hu, T., Yan, Q., Wei, X., and Dai, J.: Estimating Global GPP From the Plant Functional Type Perspective Using a Machine Learning Approach, J. Geophys. Res.-Biogeo., 128, e2022JG007100, https://doi.org/10.1029/2022JG007100, 2023.
Hersbach, H., Bell, B., Berrisford, P., Hirahara, S., Horányi, A., Muñoz-Sabater, J., Nicolas, J., Peubey, C., Radu, R., Schepers, D., Simmons, A., Soci, C., Abdalla, S., Abellan, X., Balsamo, G., Bechtold, P., Biavati, G., Bidlot, J., Bonavita, M., De Chiara, G., Dahlgren, P., Dee, D., Diamantakis, M., Dragani, R., Flemming, J., Forbes, R., Fuentes, M., Geer, A., Haimberger, L., Healy, S., Hogan, R. J., Hólm, E., Janisková, M., Keeley, S., Laloyaux, P., Lopez, P., Lupu, C., Radnoti, G., de Rosnay, P., Rozum, I., Vamborg, F., Villaume, S., and Thépaut, J.-N.: The ERA5 global reanalysis, Q. J. Roy. Meteor. Soc., 146, 1999–2049, https://doi.org/10.1002/qj.3803, 2020.
Hu, Z., Piao, S., Knapp, A. K., Wang, X., Peng, S., Yuan, W., Running, S., Mao, J., Shi, X., Ciais, P., Huntzinger, D. N., Yang, J., and Yu, G.: Decoupling of greenness and gross primary productivity as aridity decreases, Remote Sens. Environ., 279, 113120, https://doi.org/10.1016/j.rse.2022.113120, 2022.
Huang, M., Piao, S., Ciais, P., Penuelas, J., Wang, X., Keenan, T. F., Peng, S., Berry, J. A., Wang, K., Mao, J., Alkama, R., Cescatti, A., Cuntz, M., De Deurwaerder, H., Gao, M., He, Y., Liu, Y., Luo, Y., Myneni, R. B., Niu, S., Shi, X., Yuan, W., Verbeeck, H., Wang, T., Wu, J., and Janssens, I. A.: Air temperature optima of vegetation productivity across global biomes, Nat. Ecol. Evol., 3, 772–779, https://doi.org/10.1038/s41559-019-0838-x, 2019.
Jiao, W., Wang, L., Smith, W. K., Chang, Q., Wang, H., and D'Odorico, P.: Observed increasing water constraint on vegetation growth over the last three decades, Nat. Commun., 12, 3777, https://doi.org/10.1038/s41467-021-24016-9, 2021.
Jung, M., Schwalm, C., Migliavacca, M., Walther, S., Camps-Valls, G., Koirala, S., Anthoni, P., Besnard, S., Bodesheim, P., Carvalhais, N., Chevallier, F., Gans, F., Goll, D. S., Haverd, V., Köhler, P., Ichii, K., Jain, A. K., Liu, J., Lombardozzi, D., Nabel, J. E. M. S., Nelson, J. A., O'Sullivan, M., Pallandt, M., Papale, D., Peters, W., Pongratz, J., Rödenbeck, C., Sitch, S., Tramontana, G., Walker, A., Weber, U., and Reichstein, M.: Scaling carbon fluxes from eddy covariance sites to globe: synthesis and evaluation of the FLUXCOM approach, Biogeosciences, 17, 1343–1365, https://doi.org/10.5194/bg-17-1343-2020, 2020.
Lan, X., Tans, P., and Thoning, K. W.: Trends in globally-averaged CO2 determined from NOAA global monitoring laboratory measurements, National Oceanic and Atmospheric Administration [data set], https://doi.org/10.15138/9N0H-ZH07, 2024
Li, B., Ryu, Y., Jiang, C., Dechant, B., Liu, J., Yan, Y., and Li, X.: BESSv2.0: A satellite-based and coupled-process model for quantifying long-term global land-atmosphere fluxes, Remote Sens. Environ., 295, 113696, https://doi.org/10.1016/j.rse.2023.113696, 2023.
Li, X. and Xiao, J.: A Global, 0.05-Degree Product of Solar-Induced Chlorophyll Fluorescence Derived from OCO-2, MODIS, and Reanalysis Data, Remote Sens., 11, 517, https://doi.org/10.3390/rs11050517, 2019.
Monfreda, C., Ramankutty, N., and Foley, J. A.: Farming the planet: 2. Geographic distribution of crop areas, yields, physiological types, and net primary production in the year 2000, Global Biogeochem. Cy., 22, GB1022, https://doi.org/10.1029/2007gb002947, 2008.
Myneni, R., Knyazikhin, Y., and Park, T: MODIS/Terra Leaf Area Index/FPAR 8-Day L4 Global 500m SIN Grid V061, NASA EOSDIS Land Processes Distributed Active Archive Center [data set], https://doi.org/10.5067/MODIS/MOD15A2H.061, 2021.
Pastorello, G., Trotta, C., Canfora, E., Chu, H., Christianson, D., Cheah, Y.-W., Poindexter, C., Chen, J., Elbashandy, A., Humphrey, M., Isaac, P., Polidori, D., Reichstein, M., Ribeca, A., van Ingen, C., Vuichard, N., Zhang, L., Amiro, B., Ammann, C., Arain, M. A., Ardö, J., Arkebauer, T., Arndt, S. K., Arriga, N., Aubinet, M., Aurela, M., Baldocchi, D., Barr, A., Beamesderfer, E., Marchesini, L. B., Bergeron, O., Beringer, J., Bernhofer, C., Berveiller, D., Billesbach, D., Black, T. A., Blanken, P. D., Bohrer, G., Boike, J., Bolstad, P. V., Bonal, D., Bonnefond, J.-M., Bowling, D. R., Bracho, R., Brodeur, J., Brümmer, C., Buchmann, N., Burban, B., Burns, S. P., Buysse, P., Cale, P., Cavagna, M., Cellier, P., Chen, S., Chini, I., Christensen, T. R., Cleverly, J., Collalti, A., Consalvo, C., Cook, B. D., Cook, D., Coursolle, C., Cremonese, E., Curtis, P. S., D'Andrea, E., da Rocha, H., Dai, X., Davis, K. J., Cinti, B. D., Grandcourt, A. d., Ligne, A. D., De Oliveira, R. C., Delpierre, N., Desai, A. R., Di Bella, C. M., Tommasi, P. d., Dolman, H., Domingo, F., Dong, G., Dore, S., Duce, P., Dufrêne, E., Dunn, A., Dušek, J., Eamus, D., Eichelmann, U., ElKhidir, H. A. M., Eugster, W., Ewenz, C. M., Ewers, B., Famulari, D., Fares, S., Feigenwinter, I., Feitz, A., Fensholt, R., Filippa, G., Fischer, M., Frank, J., Galvagno, M., Gharun, M., Gianelle, D., Gielen, B., Gioli, B., Gitelson, A., Goded, I., Goeckede, M., Goldstein, A. H., Gough, C. M., Goulden, M. L., Graf, A., Griebel, A., Gruening, C., Grünwald, T., Hammerle, A., Han, S., Han, X., Hansen, B. U., Hanson, C., Hatakka, J., He, Y., Hehn, M., Heinesch, B., Hinko-Najera, N., Hörtnagl, L., Hutley, L., Ibrom, A., Ikawa, H., Jackowicz-Korczynski, M., Janouš, D., Jans, W., Jassal, R., Jiang, S., Kato, T., Khomik, M., Klatt, J., Knohl, A., Knox, S., Kobayashi, H., Koerber, G., Kolle, O., Kosugi, Y., Kotani, A., Kowalski, A., Kruijt, B., Kurbatova, J., Kutsch, W. L., Kwon, H., Launiainen, S., Laurila, T., Law, B., Leuning, R., Li, Y., Liddell, M., Limousin, J.-M., Lion, M., Liska, A. J., Lohila, A., López-Ballesteros, A., López-Blanco, E., Loubet, B., Loustau, D., Lucas-Moffat, A., Lüers, J., Ma, S., Macfarlane, C., Magliulo, V., Maier, R., Mammarella, I., Manca, G., Marcolla, B., Margolis, H. A., Marras, S., Massman, W., Mastepanov, M., Matamala, R., Matthes, J. H., Mazzenga, F., McCaughey, H., McHugh, I., McMillan, A. M. S., Merbold, L., Meyer, W., Meyers, T., Miller, S. D., Minerbi, S., Moderow, U., Monson, R. K., Montagnani, L., Moore, C. E., Moors, E., Moreaux, V., Moureaux, C., Munger, J. W., Nakai, T., Neirynck, J., Nesic, Z., Nicolini, G., Noormets, A., Northwood, M., Nosetto, M., Nouvellon, Y., Novick, K., Oechel, W., Olesen, J. E., Ourcival, J.-M., Papuga, S. A., Parmentier, F.-J., Paul-Limoges, E., Pavelka, M., Peichl, M., Pendall, E., Phillips, R. P., Pilegaard, K., Pirk, N., Posse, G., Powell, T., Prasse, H., Prober, S. M., Rambal, S., Rannik, Ü., Raz-Yaseef, N., Rebmann, C., Reed, D., Dios, V. R. d., Restrepo-Coupe, N., Reverter, B. R., Roland, M., Sabbatini, S., Sachs, T., Saleska, S. R., Sánchez-Cañete, E. P., Sanchez-Mejia, Z. M., Schmid, H. P., Schmidt, M., Schneider, K., Schrader, F., Schroder, I., Scott, R. L., Sedlák, P., Serrano-Ortíz, P., Shao, C., Shi, P., Shironya, I., Siebicke, L., Šigut, L., Silberstein, R., Sirca, C., Spano, D., Steinbrecher, R., Stevens, R. M., Sturtevant, C., Suyker, A., Tagesson, T., Takanashi, S., Tang, Y., Tapper, N., Thom, J., Tomassucci, M., Tuovinen, J.-P., Urbanski, S., Valentini, R., van der Molen, M., van Gorsel, E., van Huissteden, K., Varlagin, A., Verfaillie, J., Vesala, T., Vincke, C., Vitale, D., Vygodskaya, N., Walker, J. P., Walter-Shea, E., Wang, H., Weber, R., Westermann, S., Wille, C., Wofsy, S., Wohlfahrt, G., Wolf, S., Woodgate, W., Li, Y., Zampedri, R., Zhang, J., Zhou, G., Zona, D., Agarwal, D., Biraud, S., Torn, M., and Papale, D.: The FLUXNET2015 dataset and the ONEFlux processing pipeline for eddy covariance data, Sci, Data, 7, 225, https://doi.org/10.1038/s41597-020-0534-3, 2020.
Pei, Y., Dong, J., Zhang, Y., Yuan, W., Doughty, R., Yang, J., Zhou, D., Zhang, L., and Xiao, X.: Evolution of light use efficiency models: Improvement, uncertainties, and implications, Agr. Forest Meteorol., 317, 108905, https://doi.org/10.1016/j.agrformet.2022.108905, 2022.
Ruehr, S., Keenan, T. F., Williams, C., Zhou, Y., Lu, X., Bastos, A., Canadell, J. G., Prentice, I. C., Sitch, S., and Terrer, C.: Evidence and attribution of the enhanced land carbon sink, Nat. Rev. Earth Environ., 4, 518–534, https://doi.org/10.1038/s43017-023-00456-3, 2023.
Running, S. W., Nemani, R. R., Heinsch, F. A., Zhao, M., Reeves, M., and Hashimoto, H.: A continuous satellite-derived measure of global terrestrial primary production, Bioscience, 54, 547–560, https://doi.org/10.1641/0006-3568(2004)054[0547:ACSMOG]2.0.CO;2, 2004.
Ryu, Y., Berry, J. A., and Baldocchi, D. D.: What is global photosynthesis? History, uncertainties and opportunities, Remote Sens. Environ., 223, 95–114, https://doi.org/10.1016/j.rse.2019.01.016, 2019.
Schaaf, C. and Wang, Z: MODIS/Terra+Aqua BRDF/Albedo Nadir BRDF-Adjusted Ref Daily L3 Global 0.05Deg CMG V061, NASA EOSDIS Land Processes Distributed Active Archive Center [data set], https://doi.org/10.5067/MODIS/MCD43C4.061, 2021.
Stocker, B. D., Zscheischler, J., Keenan, T. F., Prentice, I. C., Penuelas, J., and Seneviratne, S. I.: Quantifying soil moisture impacts on light use efficiency across biomes, New Phytol., 218, 1430–1449, https://doi.org/10.1111/nph.15123, 2018.
Stocker, B. D., Zscheischler, J., Keenan, T. F., Prentice, I. C., Seneviratne, S. I., and Penuelas, J.: Drought impacts on terrestrial primary production underestimated by satellite monitoring, Nat. Geosci., 12, 264–270, https://doi.org/10.1038/s41561-019-0318-6, 2019.
Tian, Z., Yi, C., Fu, Y., Kutter, E., Krakauer, N. Y., Fang, W., Zhang, Q., and Luo, H.: Fusion of Multiple Models for Improving Gross Primary Production Estimation With Eddy Covariance Data Based on Machine Learning, J. Geophys. Res.-Biogeo., 128, e2022JG007122, https://doi.org/10.1029/2022JG007122, 2023.
Vermote, E: MODIS/Terra Surface Reflectance Daily L3 Global 0.05Deg CMG V061, NASA EOSDIS Land Processes Distributed Active Archive Center [data set], https://doi.org/10.5067/MODIS/MOD09CMG.061, 2021.
Wang, J., Dong, J., Yi, Y., Lu, G., Oyler, J., Smith, W., Zhao, M., Liu, J., and Running, S.: Decreasing net primary production due to drought and slight decreases in solar radiation in China from 2000 to 2012, J. Geophys. Res.-Biogeo., 122, 261–278, https://doi.org/10.1002/2016JG003417, 2017.
Wang, S., Zhang, Y., Ju, W., Qiu, B., and Zhang, Z.: Tracking the seasonal and inter-annual variations of global gross primary production during last four decades using satellite near-infrared reflectance data, Sci. Total Environ., 755, 142569, https://doi.org/10.1016/j.scitotenv.2020.142569, 2021.
Wang, X., Biederman, J. A., Knowles, J. F., Scott, R. L., Turner, A. J., Dannenberg, M. P., Köhler, P., Frankenberg, C., Litvak, M. E., Flerchinger, G. N., Law, B. E., Kwon, H., Reed, S. C., Parton, W. J., Barron-Gafford, G. A., and Smith, W. K.: Satellite solar-induced chlorophyll fluorescence and near-infrared reflectance capture complementary aspects of dryland vegetation productivity dynamics, Remote Sens. Environ., 270, 112858, https://doi.org/10.1016/j.rse.2021.112858, 2022.
Welp, L. R., Keeling, R. F., Meijer, H. A. J., Bollenbacher, A. F., Piper, S. C., Yoshimura, K., Francey, R. J., Allison, C. E., and Wahlen, M.: Interannual variability in the oxygen isotopes of atmospheric CO2 driven by El Niño, Nature, 477, 579–582, https://doi.org/10.1038/nature10421, 2011.
Xiao, J., Chevallier, F., Gomez, C., Guanter, L., Hicke, J. A., Huete, A. R., Ichii, K., Ni, W., Pang, Y., Rahman, A. F., Sun, G., Yuan, W., Zhang, L., and Zhang, X.: Remote sensing of the terrestrial carbon cycle: A review of advances over 50 years, Remote Sens. Environ., 233, 111383, https://doi.org/10.1016/j.rse.2019.111383, 2019.
Xiao, X., Zhang, Q., Braswell, B., Urbanski, S., Boles, S., Wofsy, S., Moore III, B., and Ojima, D.: Modeling gross primary production of temperate deciduous broadleaf forest using satellite images and climate data, Remote Sens. Environ., 91, 256–270, https://doi.org/10.1016/j.rse.2004.03.010, 2004.
Xu, T., White, L., Hui, D., and Luo, Y.: Probabilistic inversion of a terrestrial ecosystem model: Analysis of uncertainty in parameter estimation and model prediction, Global Biogeochem. Cy., 20, GB2007, https://doi.org/10.1029/2005GB002468, 2006.
Yang, J., Tian, H. Q., Pan, S. F., Chen, G. S., Zhang, B. W., and Dangal, S.: Amazon drought and forest response: Largely reduced forest photosynthesis but slightly increased canopy greenness during the extreme drought of 2015/2016, Glob. Change Biol., 24, 1919–1934, https://doi.org/10.1111/gcb.14056, 2018.
Yao, Y., Liang, S., Li, X., Hong, Y., Fisher, J. B., Zhang, N., Chen, J., Cheng, J., Zhao, S., Zhang, X., Jiang, B., Sun, L., Jia, K., Wang, K., Chen, Y., Mu, Q., and Feng, F.: Bayesian multimodel estimation of global terrestrial latent heat flux from eddy covariance, meteorological, and satellite observations, J. Geophys. Res.-Atmos., 119, 4521–4545, https://doi.org/10.1002/2013JD020864, 2014.
Yao, Y., Liang, S., Li, X., Chen, J., Liu, S., Jia, K., Zhang, X., Xiao, Z., Fisher, J. B., Mu, Q., Pan, M., Liu, M., Cheng, J., Jiang, B., Xie, X., Grünwald, T., Bernhofer, C., and Roupsard, O.: Improving global terrestrial evapotranspiration estimation using support vector machine by integrating three process-based algorithms, Agr. Forest Meteorol., 242, 55–74, https://doi.org/10.1016/j.agrformet.2017.04.011, 2017.
Yuan, W., Liu, S., Zhou, G., Zhou, G., Tieszen, L. L., Baldocchi, D., Bernhofer, C., Gholz, H., Goldstein, A. H., Goulden, M. L., Hollinger, D. Y., Hu, Y., Law, B. E., Stoy, P. C., Vesala, T., and Wofsy, S. C.: Deriving a light use efficiency model from eddy covariance flux data for predicting daily gross primary production across biomes, Agr. Forest Meteorol., 143, 189–207, https://doi.org/10.1016/j.agrformet.2006.12.001, 2007.
Yuan, W., Cai, W., Xia, J., Chen, J., Liu, S., Dong, W., Merbold, L., Law, B., Arain, A., Beringer, J., Bernhofer, C., Black, A., Blanken, P. D., Cescatti, A., Chen, Y., Francois, L., Gianelle, D., Janssens, I. A., Jung, M., Kato, T., Kiely, G., Liu, D., Marcolla, B., Montagnani, L., Raschi, A., Roupsard, O., Varlagin, A., and Wohlfahrt, G.: Global comparison of light use efficiency models for simulating terrestrial vegetation gross primary production based on the LaThuile database, Agr. Forest Meteorol., 192–193, 108–120, https://doi.org/10.1016/j.agrformet.2014.03.007, 2014.
Yuan, W., Cai, W., Nguy-Robertson, A. L., Fang, H., Suyker, A. E., Chen, Y., Dong, W., Liu, S., and Zhang, H.: Uncertainty in simulating gross primary production of cropland ecosystem from satellite-based models, Agr. Forest Meteorol., 207, 48–57, https://doi.org/10.1016/j.agrformet.2015.03.016, 2015.
Yuan, W., Zheng, Y., Piao, S., Ciais, P., Lombardozzi, D., Wang, Y., Ryu, Y., Chen, G., Dong, W., Hu, Z., Jain, A. K., Jiang, C., Kato, E., Li, S., Lienert, S., Liu, S., Nabel, J. E. M. S., Qin, Z., Quine, T., Sitch, S., Smith, W. K., Wang, F., Wu, C., Xiao, Z., and Yang, S.: Increased atmospheric vapor pressure deficit reduces global vegetation growth, Sci. Adv., 5, eaax1396, https://doi.org/10.1126/sciadv.aax1396, 2019.
Zhang, Y., Xiao, X., Wu, X., Zhou, S., Zhang, G., Qin, Y., and Dong, J.: A global moderate resolution dataset of gross primary production of vegetation for 2000–2016, Sci. Data, 4, 1–13, https://doi.org/10.1038/sdata.2017.165, 2017.
Zheng, Y., Shen, R., Wang, Y., Li, X., Liu, S., Liang, S., Chen, J. M., Ju, W., Zhang, L., and Yuan, W.: Improved estimate of global gross primary production for reproducing its long-term variation, 1982–2017, Earth Syst. Sci. Data, 12, 2725–2746, https://doi.org/10.5194/essd-12-2725-2020, 2020.