


Abstract
Rapid intensification toward drought, also known as flash drought, is a subseasonal feature of the climate system whereby the persistence of extreme atmospheric anomalies for several weeks can quickly deplete soil moisture and dramatically increase evaporative stress on the environment. These events can lead to significant impacts on agricultural production during the growing season. This study performs a climatological regional analysis across the United States to explore geographic differences that exist in the rapid onset and development of drought. The Standardized Evaporative Stress Ratio (SESR) is applied to a reanalysis dataset to quantify regional flash drought characteristics across nine climate regions in the United States. May and June had a higher frequency of flash drought events in the western United States, while a climatological peak in flash drought frequency was found in July and August for the eastern United States. For all climate regions, flash drought intensity was found to increase throughout the beginning of the growing season, then decrease in the latter portion of the growing season. Analysis of preceding moisture conditions revealed that antecedent dry conditions increased flash drought risk for all regions. Lastly, less than half of all flash droughts persisted to hydrological drought across the United States.
Export citation and abstract BibTeX RIS

Original content from this work may be used under the terms of the Creative Commons Attribution 3.0 licence. Any further distribution of this work must maintain attribution to the author(s) and the title of the work, journal citation and DOI.
1. Introduction
Flash droughts are characterized by the rapid onset and development of drought conditions (Otkin et al 2018). Given the four traditional drought classifications (meteorological, agricultural, hydrological, and socioeconomical; Wilhite and Glantz 1985), flash droughts develop on timescales between meteorological and agricultural drought. When a combination of extreme atmospheric anomalies (such as lack of rainfall, higher surface temperatures, higher surface wind speeds, and higher vapor pressure deficit) persist for several weeks, rapid depletion of soil moisture can occur and lead to increased evaporative stress on the environment. Through this process, flash droughts can lead to large agricultural yield losses and impact the availability of short-term water resources. For example, expansive flash drought occurred across the central Great Plains and Midwest regions of the United States (US) in 2012, which led to significant agricultural losses in excess of $30 billion (Otkin et al 2018, National Centers for Environmental Information 2019) and disrupted the global food supply (Boyer et al 2013). More recently, rapid drought intensification occurred in the northern High Plains in 2017 which significantly impacted wheat production and increased the risk for wildfires (Gerken et al 2018, National Centers for Environmental Information 2019). As such, the rapid and devastating impact of flash drought necessitates a deeper understanding of the fundamental characteristics of flash drought.
Overall, individual case studies have primarily been used to examine the characteristics of rapid onset drought. For example, Otkin et al (2016) and Basara et al (2019) explored the temporal and spatial evolution of the 2012 flash drought event across the central US. Hunt et al (2014) investigated a flash drought event that occurred in Mead, Nebraska in 2003 by comparing soil water, evapotranspiration, and gross primary productivity to two drought indices and its effect on dryland crop yields. In addition, several flash drought case studies have been examined that reveal differences in flash drought characteristics across different years and geographic regions. For example, Otkin et al (2013) investigated four flash drought events across the central US during different parts of the growing season and each event had unique rates of rapid intensification toward drought. Ford et al (2015) examined five flash drought events between 2000 and 2013 across Oklahoma and indicated varying degrees of drought conditions from the US Drought Monitor (USDM; moderate drought, abnormally dry, and no drought) preceding flash drought events. In addition, flash droughts do not necessarily transition to longer term drought (e.g., hydrological) and can undergo a period of rapid recovery from drought conditions (Otkin et al 2019). Along with these case studies, it is also important to perform more comprehensive climatological studies to determine if characteristics found during individual case studies are representative and to explore geographic differences that may exist in the rapid onset and development of drought. In addition, improved understanding of the characteristics of flash drought events unique to specific climate regions lays the foundation for improved flash drought monitoring, detection, and predictability.
From an observational standpoint, flash drought development can be examined via the use of evaporative stress, evaporative demand, soil moisture, or other related variables. Otkin et al (2013) initially examined flash droughts via the satellite-derived Evaporative Stress Index (ESI) (Anderson et al 2007a, 2007b). Subsequently, the Rapid Change Index (RCI) was derived from temporal changes in ESI and used to explore the relationship between rapid drought development and changes in evaporative stress (Otkin et al 2014, 2015) Similarly, Hobbins et al (2016) and McEvoy et al (2016) leveraged atmospheric demand via the Evaporative Demand Drought Index (EDDI) to monitor the development of flash drought while Ford et al (2015) examined the utility of soil moisture for monitoring flash drought. Each of these methods provides one to two weeks of lead time with respect to drought impacts on the environment (i.e., significant reduction of soil moisture, stress on vegetation and agriculture, etc).
Overall, two approaches for flash drought detection have been developed in the scientific literature: by (1) rapid intensification (e.g., Otkin et al 2013, 2014) or (2) short duration (e.g., Mo and Lettenmaier 2015, 2016). Otkin et al (2018) performed an assessment of these two definitions, and ultimately argued that flash droughts are defined by rapid intensification with corresponding impacts versus overall short duration. Based on (1) and the criteria and suggestions outlined in Otkin et al (2018), Christian et al (2019) developed a percentile-based methodology for the identification of flash droughts using the standardized form of the Evaporative Stress Ratio (ESR); ESR is the ratio between evapotranspiration and potential evapotranspiration and is inversely proportional to the amount of evaporative stress on the environment such that higher (lower) ratios are indicative of lower (higher) stress. The use of ESR for flash drought identification is advantageous compared to individual variables (e.g., soil moisture) as it incorporates the impacts of changes in air temperature, wind speed, vapor pressure deficit, latent and sensible heat flux, soil moisture, and precipitation. Additionally, four criteria were employed to identify flash droughts using standardized ESR (SESR) with two criteria which emphasized the rapid intensification toward drought and two criteria focused on vegetative impact (further details on the standardization of ESR and development of the percentile-based methodology are available in Christian et al (2019)). As such, this study uses the Otkin et al (2018) flash drought definition (rapid rate of intensification toward drought) and the Christian et al (2019) methodology for the identification of flash droughts.
The purpose of this study is to explore seasonal characteristics of flash droughts and how they vary across the United States. Specifically, this analysis focuses on quantifying (1) the timing of flash droughts (2) the intensity (rate of intensification) of flash droughts, (3) the moisture conditions preceding flash drought events and (4) the likelihood of persistence from flash drought to hydrological drought. Lastly, potential attributions of the regional differences in flash drought characteristics are discussed.
2. Data and methods
The primary dataset used in this study for the identification and evaluation of flash drought characteristics over CONUS is the National Centers for Environmental Prediction North American Regional Reanalysis (NCEP NARR; Mesinger et al 2006). The NARR was selected because Christian et al (2019) have shown that SESR derived from NARR compares well with the satellite-based Evaporative Stress Index (ESI) and to drought depictions from the USDM. The time period used during this study spans 1979 to 2016. The variables used during the analysis include evapotranspiration, potential evapotranspiration, and volumetric soil moisture.
Flash droughts were identified when values of SESR and changes in SESR satisfied four criteria described in Christian et al (2019), where SESR and change in SESR are defined as:
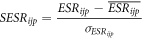
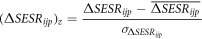
 (referred to as SESR) and
  (referred to as ΔSESR) are the z-scores of ESR and the change in SESR, respectively, for a specific pentad (p) at a specific grid point (i, j). SESR and ΔSESR were detrended by removing the linear trend for the time series of SESR and ΔSESR for each pentad and at each grid point between 1979 and 2016. Detrending SESR and ΔSESR accounts for changes in the flash drought identification thresholds that may occur over time. For the first two criteria, a flash drought event had to have a minimum length of five negative SESR changes, equivalent to a length of six pentads (30 days), and have a final SESR value below the 20th percentile from climatological SESR. These criteria place an emphasis on drought impacts (e.g., depletion of soil moisture, stress on the ecosystem, etc) and fulfill the drought component of flash drought (Otkin et al 2018). The final two criteria emphasize the rapid rate of intensification toward drought. One criterion focuses on pentad-to-pentad changes in drought development (the change in SESR must be below the 40th percentile between individual pentads), and the other criterion accounts for rapid drought development through the entire flash drought event (the mean change in SESR during the flash drought event must be less than the 25th percentile). In addition, conditional inclusion of one moderation pentad (pentad-to-pentad change exceeding the 40th percentile) was also incorporated into the flash drought identification (Christian et al 2019). For criteria 2 (final SESR value) and 3 (pentad-to-pentad changes in SESR), percentiles were taken from the distribution of SESR and ΔSESR at local grid points and each individual pentad from 1979 to 2016. For criterion 4 (mean change in SESR), percentiles were taken from the distribution of ΔSESR at local grid points for pentads that were encompassed within the flash drought event.
3. Quantifying flash drought characteristics
To quantify the regional characteristics of flash drought events, the analysis was partitioned into nine climate regions across the United States grouped by their climatologically similar characteristics (Karl and Koss 1984). Flash droughts were identified by using the percentile-based methodology described in section 2 and with further detail in Christian et al (2019). From the compiled set of flash drought events identified, the start date of each flash drought event (the first pentad change in SESR below the 40th percentile; i.e., the pentad when the period of rapid intensification began) was used to partition flash droughts by month. The temporal analysis of flash drought was focused over the growing season from April through October as evapotranspiration and potential evapotranspiration are limited during the winter months, preventing rapid changes in evaporative stress over extended periods of time. However, it is important to note that flash droughts that began in March were included in the analysis as long as the period of rapid intensification ended in the growing season (e.g., April). The end of rapid intensification was marked at the last pentad where the preceding pentad change in SESR was below the 40th percentile. In addition to identifying the timing for peak frequency during the growing season, the average intensity of flash droughts in each month was also calculated. Following upon the work of Christian et al (2019), intensities were categorized on a scale from FD1 (moderate flash drought) to FD4 (exceptional flash drought). FD1 indicates the mean change in SESR during a flash drought event was between the 20th and 25th percentile of SESR changes, while FD2, FD3, and FD4 indicate percentiles between the 15th and 20th, 10th and 15th, and below the 10th, respectively.
While SESR is influenced by thermal, moisture, and radiative flux variables, moisture is an especially critical component of SESR. This is due to contributions from surface storage (soil moisture), the magnitude of vapor transfer from the land surface to the atmosphere (evapotranspiration/latent heat flux), and the atmospheric demand for moisture (e.g., vapor pressure deficit). As such, SESR provides a comprehensive summary of environmental moisture conditions and was used to examine regional differences in these conditions preceding flash droughts. A two-month average of SESR was calculated before each flash drought event to investigate the evaporative stress on the environment before the rapid intensification toward drought began.
The probability of hydrological drought persisting from flash drought was also computed for each climate region. Hydrological drought can be challenging to determine because its impacts (streamflow, reservoir levels, lake levels) can be difficult to quantify from a meteorological perspective (e.g., soil moisture). However, deeper soil moisture will have a slower response to precipitation and evapotranspiration compared to near-surface soil moisture due to groundwater recharge and percolation, and will be more representative of hydrological impacts. As such, 40–100 cm soil moisture was used from the NARR to quantify persistence of flash drought to hydrological drought. Drought is generally classified by its associated impacts (meteorological, agricultural, hydrological; Wilhite 2000), however a common time period of analysis is required to provide a progression of impacts on water resources. Ultimately, the 6 month period following flash drought was selected to examine the persistence of flash drought to longer term drought and to mark a notable progression from flash drought impacts (increased evaporative stress, depleted near-surface soil moisture) to hydrological impacts (reduced streamflow, declining reservoir and lake levels). This time period was also selected as the USDM uses the same threshold for short to long term transitions in drought (National Drought Mitigation Center 2019). A 6-month average of standardized 40–100 cm soil moisture following each flash drought event was calculated. The centered percentile of the 6-month soil moisture average was determined from the distribution of 38 years of 6-month average soil moisture values at the given time of year and associated grid point and categorized into surrogate drought classes based on USDM drought monitor percentiles (Svoboda et al 2002). Percentiles less than 30th were classified as D0 (abnormally dry), less than 20th were classified as D1 (moderate drought), less than 10th were classified as D2 (severe drought), less than 5th were classified as D3 (extreme drought), and less than 2nd were classified as D4 (exceptional drought). Soil moisture values greater than the 30th percentile or classified as D0 were identified as no drought, while categories D1 through D4 were identified as drought.
It is critical to note that the use of percentiles in the analysis of drought to flash drought persistence do not necessarily universally represent similar progressions of drought impacts in different climate regions. For example, a humid subtropical region may experience a flash drought and progression to longer term drought, but with little variation in soil moisture within these regions, impacts to the ecosystem and streamflow may be low. In contrast, a desert region with low soil moisture overall may experience a much larger impact to hydrological impacts (such as streamflow) due to a severe depletion of soil moisture, resulting from a persistence of drought following a flash drought event. As such, the primary purpose of this analysis is to investigate the overall progression and evolution of drought impacts within individual climate regions, with a lesser focus on the specific magnitudes of those impacts.
4. Results and discussion
Temporal frequency of flash drought events for each of the nine climate regions across the United States are shown in figure 1 with regional differences in the timing of peak frequency. In the western United States (Northwest, West, and Southwest climate regions), generally characterized by arid and semi-arid climate regimes as well as mountainous topography, flash droughts occur more often during the early portion of the warm season (May and June). An exception is the Northwest climate region, in which an additional peak of flash drought frequency is seen at the very end of the growing season. Further eastward across the United States in regions with more intensive agricultural production (West North Central, South, East North Central, and Central), flash drought frequency is greatest in the middle portion of the growing season (June and July).

Figure 1. Percentage of flash drought occurrence partitioned by the starting month for flash drought for each of the nine climate regions across the United States between 1979 and 2016.
Download figure:
Standard image High-resolution imageIn addition to the peak frequency, the distribution during the growing season is unique for particular climate regions (figure 1). A common theme among several climate regions is increased frequency at the beginning of the growing season and a decrease in frequency in the latter portion of the growing season. This was evident in the Southwest, West North Central, South, East North Central, Central and Northeast climate regions. However, three of the climate regions yielded alternate distributions. For the Northwest and West climate regions, monthly flash drought frequency is variable between March and October. In the Southeast region, the flash drought frequency generally increases in the beginning and middle portions of the growing season, with a peak of frequency interspersed during May.
Regional differences in the timing of flash drought development can possibly be attributed to several meteorological and climatological factors. Beginning with the west coast of the United States, the timing of atmospheric rivers during the growing season may contribute to the development of flash drought. While atmospheric rivers are generally described as cold-season phenomena, they still occur throughout the year along the United States west coast (Mundhenk et al 2016). Atmospheric rivers have also been shown to contribute to a large fraction of the precipitation (15%–60%) in Washington, Oregon, California, Idaho, and Nevada within the cold season (Rutz et al 2014). Given the significant moisture transport from these features, a lack of moisture transport and associated precipitation extending from the cold into the warm season may increase the likelihood for flash drought development.
In the Southwest climate region, approximately 50% of the total annual rainfall in Arizona and New Mexico occurs in the months of July, August, and September due to the North American monsoon (Sheppard et al 2002). The onset of the monsoon is typically in early July, but can begin in the latter portions of June or as late as the end of July (Higgins and Shi 2000). Given the higher flash drought frequency in the months of May and June (figure 1), a delay in the onset of the monsoon may contribute to the development of flash drought in this region.
The peak of flash drought frequency in the summer months across the central United States (West North Central, South, East North Central, and Central climate regions) is likely due to a combination of factors, including atmospheric demand of evapotranspiration (potential evapotranspiration), agriculture, and land-atmosphere coupling. In Hobbins et al (2012), enhanced values of potential evapotranspiration were found to exist in July across the Southern Great Plains, extending into the Northern Great Plains and Midwest. As such, increased atmospheric demand of evapotranspiration within this region in the summer may increase the likelihood of flash drought development due to elevated evaporative stress on the environment. Another contributor to the temporal hotspot in flash drought frequency is agriculture. Vegetation type in the NARR is prescribed by the National Centers for Environmental Prediction Eta Model. Within the thirteen vegetation types is a category for cultivations, which characterize a large portion of the land type across the central US. As crops develop in the growing season, a higher rate of evapotranspiration will occur, which in turn will quickly deplete soil moisture, rapidly increase evaporative stress, and promote the development of flash drought. The last factor that may lead to a higher frequency of central US flash droughts during the summer is land-atmosphere coupling. The Great Plains has previously been identified as a hot spot for land-atmosphere coupling in June, July, and August (Koster et al 2004, Dirmeyer 2011, Basara and Christian 2018). Dry soils modify the environment such that evapotranspiration is reduced and locally sourced boundary layer moisture is limited, which acts to both inhibit precipitation and increase evaporative demand. This results in a positive feedback that may make flash drought development more favorable in the summer months.
A likely factor contributing to the distribution of flash drought frequency in the growing season for the Southeast and Northeast is persistent upper-level ridging. In the Northeast, a blocking ridge can induce enhanced subsidence and the inhibition of climatological precipitation leading to flash drought development during the warm season. For the Southeast in particular, anomalous subsidence associated with a persistent upper-level ridge can suppress the diurnal convection typical during the warm season. If precipitation inhibition persists for extended periods, evaporative stress can develop leading to flash drought development. In addition, rainfall from tropical cyclones in the Southeast can prevent flash drought or terminate rapid drought development in the latter portions of the warm season (Maxwell et al 2013, Brun and Barros 2014). As such, the higher frequency of flash droughts observed in the beginning of the warm season (e.g., May) compared to later in the warm season may be attributed to the timing of tropical cyclones.
The monthly averaged flash drought intensity for the nine climate regions is shown in figure 2. The relative number of flash drought events that contributed to the average intensity calculation for each month are also shown via flash drought occurrence per grid point. A similar trend seen among each of the climate regions is an increase in the average intensity during the beginning of the growing season and a decrease in the average intensity toward the end of the growing season. However, the timing in peak intensity varies among the climate regions. For example, the West climate region has peak flash drought intensity centered around June, July, and August, while the adjacent Southwest climate region has peak intensity in May. For the eastern half of the United States, June and July were the primary months for peak intensity. Further, while most climate regions have an average intensity (i.e., rate of intensification) that remains near or below FD2 throughout most the growing season, the Central and East North Central climate regions had a peak average intensity approaching FD3 in the month of June. Such rapid intensification toward drought in these regions could be attributed to agriculture and ecological features. As previously discussed, crops and vegetation may act as an accelerant for rapid increases in evaporative stress and lead to the most intense flash drought. The resulting influences of cultivations could also possibly be related to the larger overall frequency of flash drought seen across the Midwest in figure 1 and in Christian et al (2019).

Figure 2. Average flash drought intensity (solid black line) and total flash droughts per grid point (dotted black line) partitioned by month for each of the nine climate regions across the United States between 1979 and 2016.
Download figure:
Standard image High-resolution imageThe overall environmental conditions preceding flash drought development depicted by SESR are shown in figure 3. First, three of the nine climate regions (West, Southwest, and Southeast) had a distribution in which over 70% of the flash drought events were preceded by a 2-month mean SESR below zero. These results suggest that within these regions, a 'kickstart' of abnormally dry conditions is often needed to prompt the initiation of rapid drought development. In particular, the Southeast climate region had over 77% of flash droughts preceded by below normal SESR. While the Southeast region has some of the largest mean annual temperature values in the US from a climatological perspective, the region also receives large amounts of precipitation annually (>100 cm). Overall, this combination acts to reduce the vapor pressure deficit at the land surface, reducing the evaporative stress. Because evapotranspiration is an important process in the depletion of soil moisture and subsequent increased evaporative stress, it is likely that antecedent drying of soil moisture is needed to promote rapid drought development. The West climate region similarly had a large percentage of flash droughts preceded by below normal SESR (∼75%). Given that the highest frequency of flash droughts is in the beginning of the growing season (figure 1), drier than normal moisture conditions following the winter months may set environmental conditions favorable for flash drought development as the atmospheric demand for evapotranspiration increases into the growing season. Lastly, the Southwest climate region had approximately 72% of flash droughts preceded by 2-month mean SESR below zero. Via the temporal analysis, the months with the highest flash drought frequency preceded the typical onset period for the North American monsoon. As such, if a delay of the monsoon occurs, drier than normal environmental conditions earlier in the growing season may be more likely to transition to flash drought.

Figure 3. A probability density function of two-month averaged SESR preceding each flash drought event (color) and all SESR values (gray) for each of the nine climate regions across the United States between 1979 and 2016. SESR values greater than zero indicate wetter than normal conditions while SESR values less than zero indicate drier than normal conditions.
Download figure:
Standard image High-resolution imageConversely, within the West North Central, South, East North Central, Central, and Northeast regions 37% to 47% of the flash drought events were preceded by above normal SESR. This demonstrates that even when environmental conditions were generally void of evaporative stress drivers during preceding months, rapid acceleration of drought could still occur in later periods regardless of prior conditions. Given the expansive land-use dedicated to agriculture in these regions, such results yield significant challenges related to flash drought predictability focused on antecedent conditions.
Overall, the distribution of SESR values preceding flash drought were shifted to drier moisture conditions compared to the entire SESR distribution for each region. Comparing the two distributions for each climate region with a two-sided Mann-Whitney U-test revealed that the lower medians for SESR values preceding flash drought events were statistically significant at the 99% significance level. As such, while the climate regions have different magnitudes in the shifts of the medians toward the drier side, below normal moisture conditions across the United States increase the likelihood for flash drought development.
Lastly, the percentage of flash droughts that persisted to hydrological drought is shown in figure 4. A critical result from this analysis is that over 50% of flash droughts did not transition to long term drought in each of the climate regions. However, it is important to note that even in the absence of this continuation, flash drought can lead to detrimental impacts on agriculture, ecosystems, and short-term water resources. In contrast to a lack of drought persistence following flash drought, 5% to 10% of all flash droughts in each climate region transitioned to the highest drought category (D4). In addition, the percentage in each drought category (D1 through D4) for every climate region was higher than the expected frequency (10%, 5%, 3%, and 2% for D1, D2, D3, and D4, respectively). Because the rapid intensification of flash droughts concludes in a certain level of drought, it is not surprising that a larger frequency compared to the expected frequency exists. However, additional factors may also enhance this signal and aid in the persistence of flash drought to long-term drought such as positive feedbacks associated with land-atmosphere coupling and persistence of upper-level ridging.

Figure 4. Percentage of flash droughts that transitioned from flash drought to longer term drought (6 months) for each of the nine climate regions across the United States between 1979 and 2016. The drought categories represent the 6-month average of standardized 40–100 cm soil moisture. No drought (ND) and D0 constitute no drought, while the categories of D1 through D4 constitute drought.
Download figure:
Standard image High-resolution imageFlash drought to long term drought transitions were also partitioned by month (figure 5). Two of the climate regions (Southwest and Southeast) yielded a decreasing trend in persistence percentages, indicating that long term drought following flash drought was more likely if the flash drought occurred within the beginning of the growing season. In contrast, the West and Northeast climate regions had an increasing trend in percentages, demonstrating that long term drought is more likely if the onset of flash drought occurs at the end of the growing season. The central United States (West North Central, South, East North Central, and Central climate regions) had the greatest likelihood for long-term drought transition in the month of May. Lastly, the Northwest climate region yielded an increasing trend in the beginning of the growing season and a decreasing trend in the latter portion of the growing season. In addition to the previously mentioned factors for flash drought to long-term drought transitions (land-atmosphere coupling, upper-level ridges, etc), the magnitude and timing of precipitation, with respect to the monthly climatological distribution of precipitation for each region, may also play a critical role. For example, the monthly climatological peak in precipitation for many of the states in the South climate region is in May. Similarly, May was found to be the month with the highest percentage of flash drought to long-term drought transitions. As such, it is possible that an absence of precipitation due to a flash drought during a month that is climatologically important for precipitation may increase the likelihood of transitions to long-term drought, especially if subsequent monthly precipitation amounts are climatologically smaller.

Figure 5. Percentage of flash droughts that transitioned from flash drought to longer term drought (6 months) for each of the nine climate regions across the United States between 1979 and 2016, partitioned by month.
Download figure:
Standard image High-resolution image
5. Conclusions
This study presents a regional perspective of flash drought characteristics across the United States using the conceptual framework of Otkin et al (2018) and the objective methodology developed by Christian et al (2019). First, differences exist in the seasonality of flash drought risk across climate regions. This includes key fundamental characteristics focused on the timing and intensity of flash drought events during the growing season. For example, May and June generally had a higher frequency of flash droughts in the western US, while July and August contained the climatological peak in flash drought frequency for a majority of the eastern US. Among all climate regions, flash drought intensity was found to increase in the beginning of the growing season, then decrease in the latter portion of the growing season. In addition, the preceding environmental conditions and potential post flash drought persistence to hydrological drought were quantified for the various climate regions in the United States. In all climate regions, less than half of all flash drought events persisted to hydrological drought. However, for long term droughts that did persist from flash droughts, the percentage of long term droughts in each drought category (D1 through D4) was higher than the expected frequency for each category. Furthermore, antecedent dry conditions increased flash drought risk for all of the climate regions. Even so, in five of the nine climate regions, 37% to 47% of flash drought events occurred when the ambient environmental conditions in the preceding two months appeared unfavorable for drought development.
The results here provide important insight into the climatological characteristics of flash drought; however, a deeper understanding of these features is needed. As such, future work should examine why these regional differences exist along with critical surface and atmospheric drivers associated with flash drought development. Furthermore, regional characteristics of flash droughts across the globe should be investigated using additional reanalysis datasets, observations, or models. Finally, it should be noted that this analysis produced a climatological directory of flash droughts and its associated characteristics available for future research.
Acknowledgments
The authors would like to thank the anonymous reviewers for their comments and suggestions that improved the quality of this manuscript. This work was supported, in part, by the NOAA Climate Program Office's Sectoral Applications Research Program (SARP) grant NA130AR4310122, the Agriculture and Food Research Initiative Competitive Grant no. 2012-02355 from the USDA National Institute of Food and Agriculture, the USDA National Institute of Food and Agricultural (NIFA) Grant no. 2016- 68002-24967, the NASA Water Resources Program grant 80NSSC19K1266, and the USDA Southern Great Plains Climate Hub. The data from the NARR used in this study is available at https://www.esrl.noaa.gov/psd/data/gridded/data.narr.html.