1. Introduction
It is a general problem in land cover mapping and other multi-class classification tasks that the achieved accuracies are a function of the complexity—or in other words semantic resolution—of the class typology. Commonly used measures [
1,
2] are based on the confusion matrix (e.g., the overall, producer and user accuracy or the kappa (κ) index) and only take into consideration whether a sample was correctly classified or not. Therefore, more differentiated typologies of (land cover) classes result in lower accuracies, since minor misclassifications are subject to the full penalty. For instance, classifying trees into broad leaf and coniferous types will achieve higher accuracies than classifying them into species. Likewise, binary mapping of urban extent results in higher accuracies than differentiated classification into multiple urban structural types. To that end, presumably the most useful products from a user perspective inevitably tend to have the lowest accuracies. Since there is little agreement on generic typologies, i.e., for land cover mapping, this moreover results in limited comparability of such studies.
Briefly, these accuracy measures do not account for the fuzziness of the problem, i.e., that some class pairs are more alike than others are. For instance, the misclassification of spruce into fir may be less severe than spruce into beech, which again is less severe than spruce into a building. That means the binary measures (right or wrong) miss a substantial part of the problem, i.e., “how wrong” a specific misclassification is. This of course depends on the application or more specifically the cost associated with a specific misclassification, which is not even necessarily symmetric, e.g., misclassifying a diamond into a pebble stone is likely more expensive than vice versa. Accordingly, any weighted accuracy measure that considers class similarity is necessarily limited to a specific application. This also means that appropriateness of a metric for a specific case ultimately requires some expert judgement.
In their recent technical note, Johnson and Jozdani [
3] (hereafter JJ19) argued that Local Climate Zone (LCZ) mapping accuracies should account for the land cover characteristics that affect the physical environment. While this claim is consistent with the considerations above, the method itself is not particularly innovative and based on wrong assumptions. While they correctly acknowledge that the idea has already been proposed by Bechtel et al. [
4], their interpretation of the original method is mistaken. Specifically, they claim that the original “idea of weighting the error matrix has merit, but their proposed methodology had two main shortcomings: (1) the determined weights were subjective and not fully transparent (e.g., no equations provided to explain how they were derived); and (2) the weights incorrectly applied a higher penalty to the misclassification of more physically similar LCZ types.” The second point is wrong, yet their misconception shows that the first point is somewhat justified. In particular, we acknowledge that there is a lack of documentation on the original method, mainly because the weighted accuracy measure was proposed alongside a large empirical study with a focus on human influence on the classification accuracy. Although it has been correctly applied in numerous studies and we would have readily provided additional information on request, we agree that the details of the accuracy measure should be available in a published document.
In this comment, the weighted accuracy measure proposed by Bechtel et al. [
4] is explained in more detail together with its application for LCZ mapping. In addition, we show why the JJ19 paper is mistaken and based on wrong assumptions, and why their metric is not compelling.
2. The Weighted Accuracy
The weighted accuracy measure was proposed in [
4] to evaluate the Human Influence Experiment (HUMINEX), which was conducted to assess the impact of individual perception on mapping accuracies. There it was stated: “Finally, we introduced a weighted accuracy (WA) measure, which uses a similarity matrix called the LCZ metric […] to account for the similarity between LCZ types. WA is based on the climatic impact as discussed in [
5] and consists of up to twelve points for the properties openness, height of roughness elements, land cover, and thermal inertia, penalizing confusion between dissimilar types more than confusion between similar classes [
6]. For example, LCZ 1 is most similar to the other two compact urban types (LCZs 2 and 3) and hence these pairs have higher weights than classes which are very different, such as LCZ 1 and the natural types. The weights are applied to the confusion matrix so that WA measures the accuracy of the LCZ map in terms of the expected thermal impact, rather than the percentage of predicted LCZ values that exactly match those in the reference areas” [
4].
Summarizing, a metric of LCZ similarity was proposed, it was clearly stated that it was for climatic applications, and the criteria of the metric were given, namely openness, height, cover, and thermal inertia. Moreover, it was further stated that confusion between dissimilar classes results in higher penalties. Finally, the source reference for the similarity metric was given, namely Dr. Iain D. Stewart, the originator of the LCZ scheme and undoubtedly the most renowned expert on the concept. However, the development and application of the metric was not described. This will be provided in the following section.
2.1. The Local Climate Zone (LCZ) System
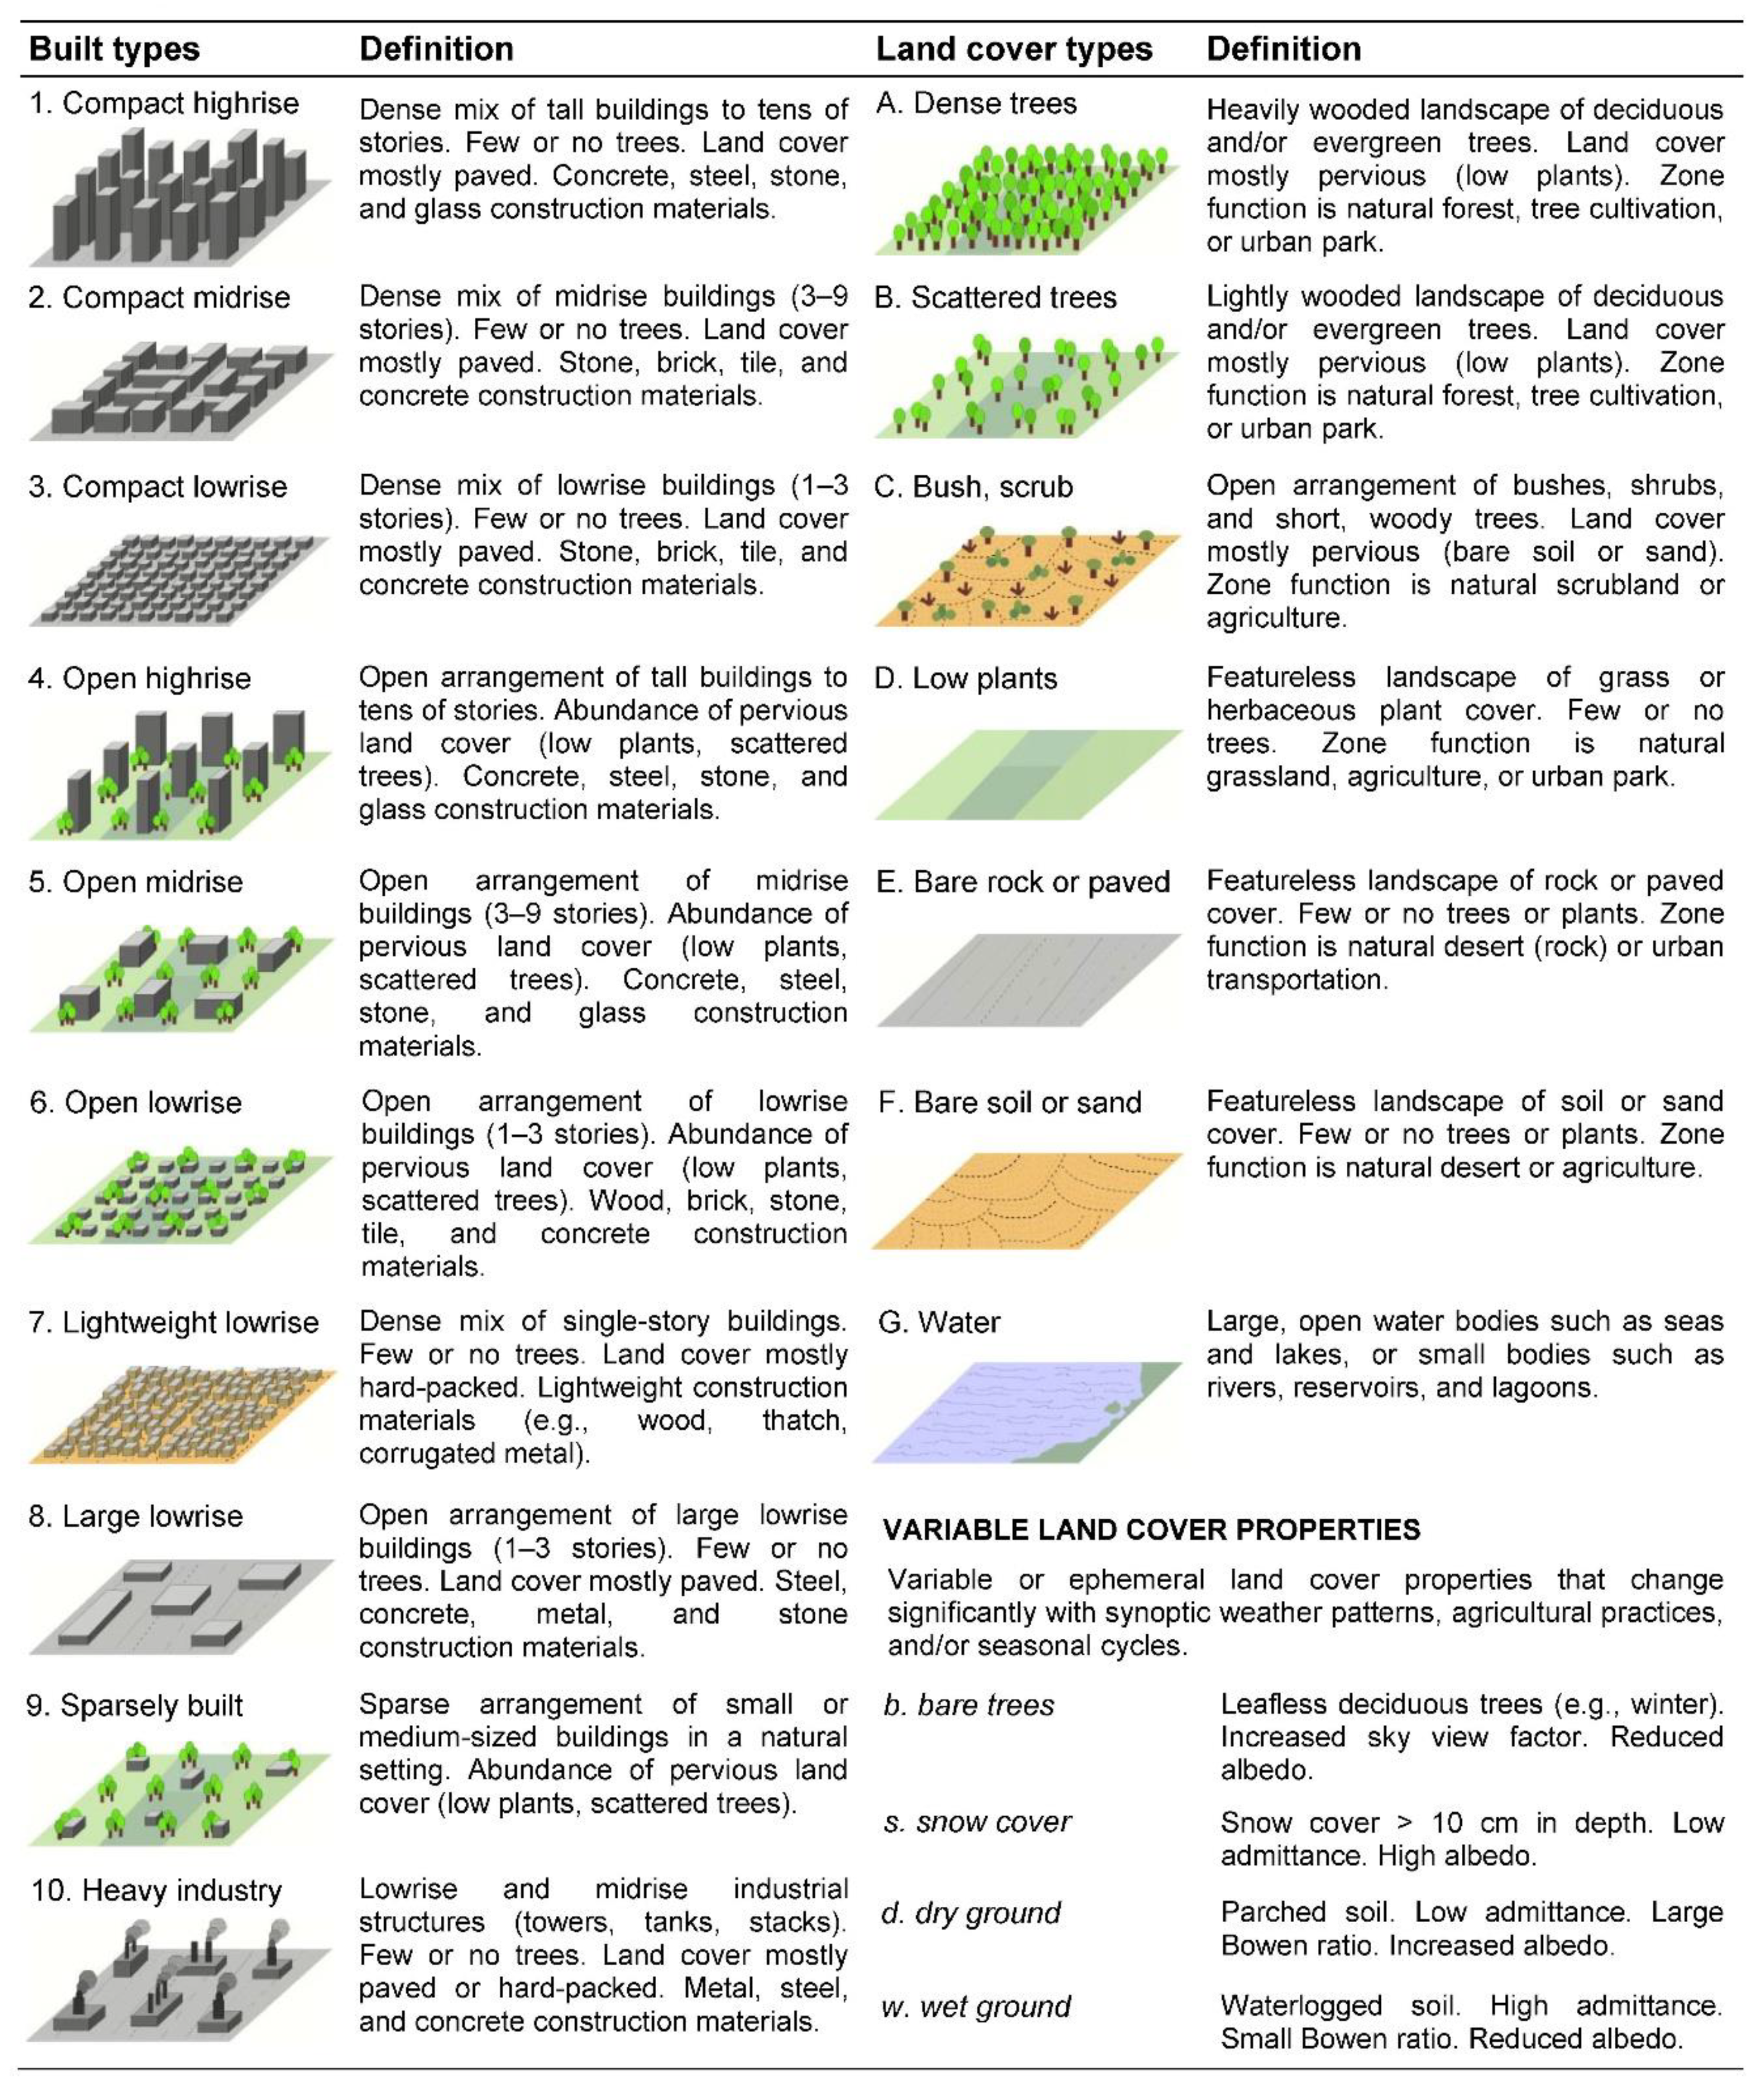
The LCZ system was developed in 2012 by Stewart and Oke [
5] to standardize comparisons of air temperature data in cities, and to define urban heat island (UHI) magnitude according to climate-relevant terms, methods, and definitions. The zones are formally defined as “regions of uniform surface cover, structure, material, and human activity that span hundreds of meters to several kilometers in horizontal scale.” Each zone exhibits “a characteristic screen-height temperature regime that is most apparent over dry surfaces, on calm, clear nights, and in areas of simple relief” [
5]. The LCZ system consists of 17 classes, 10 of which are described as “built types” and seven as “land cover types.” Associated with each class is a universal range of surface properties that influence local thermal climate. The LCZs give surface detail to conventional (albeit vague) landscape descriptors such as “urban” and “rural.” The LCZ system has been adopted worldwide as a baseline classification of surface form and land cover in cities [
7]. An overview of the LCZ classes and their surface properties is given in
Figure 1.
2.2. Construction of the LCZ Metric
The similarity metric used in [
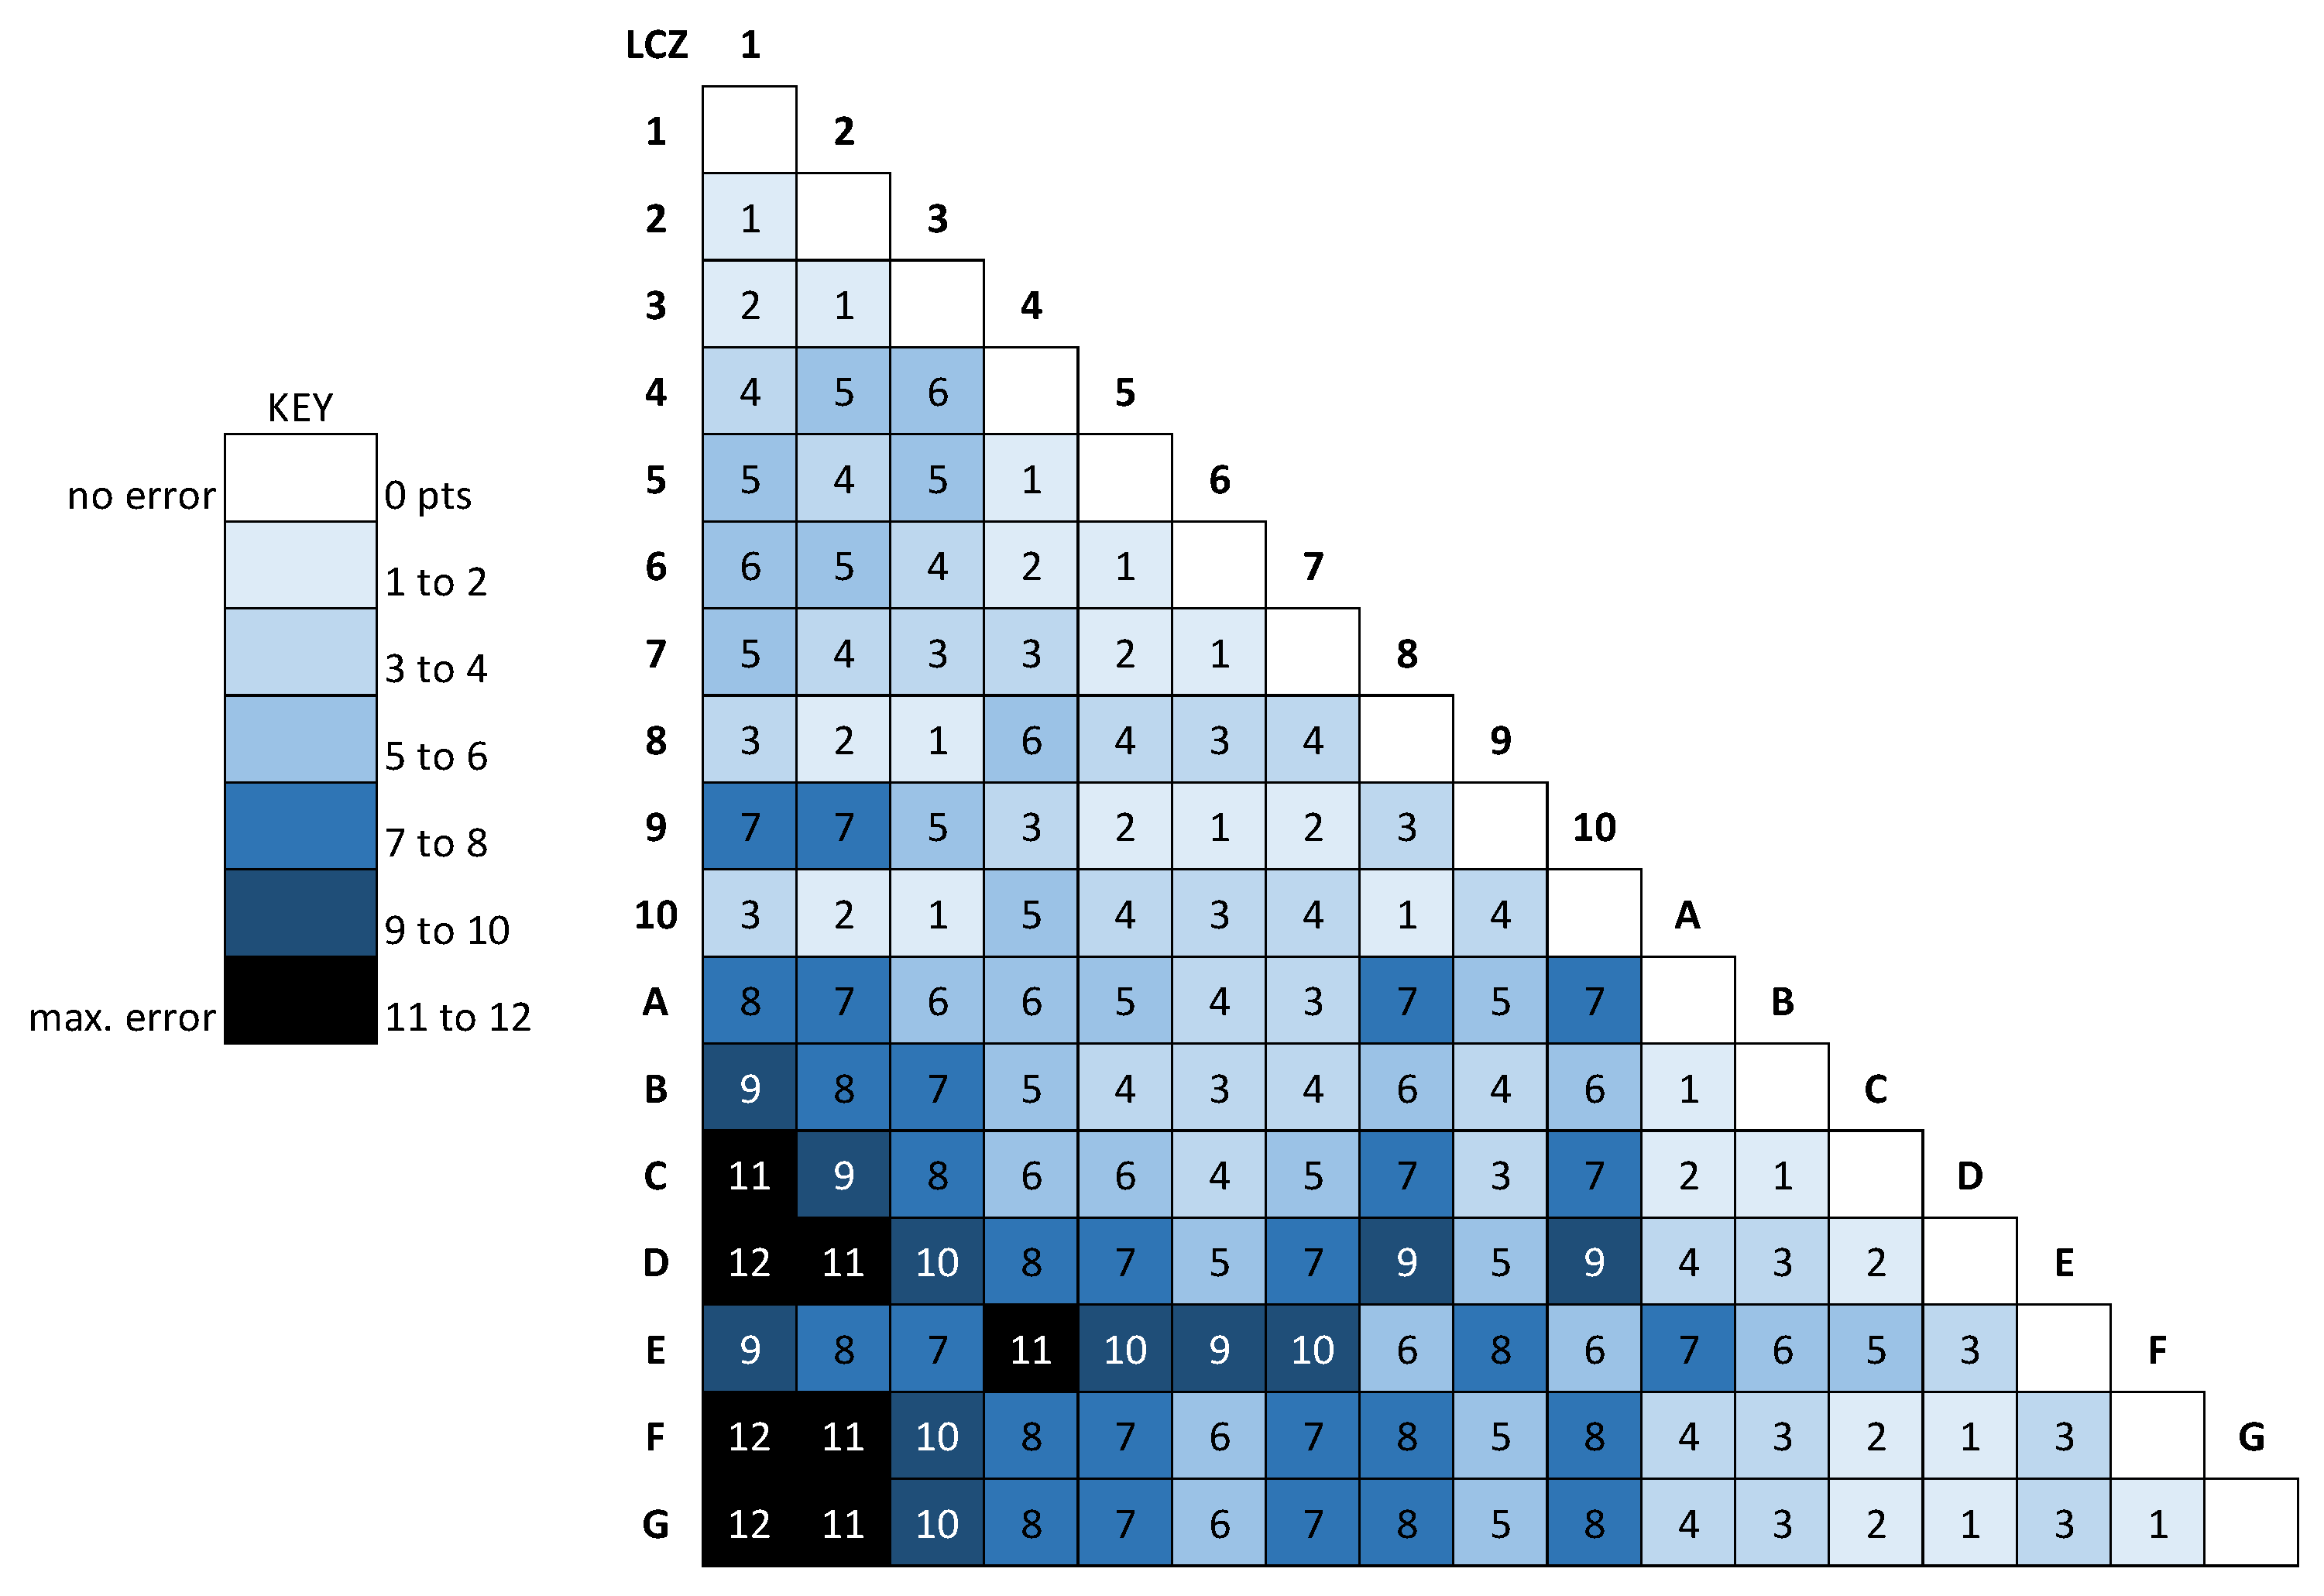
4] is based on a 12-point diagnostic scheme under development by Stewart [
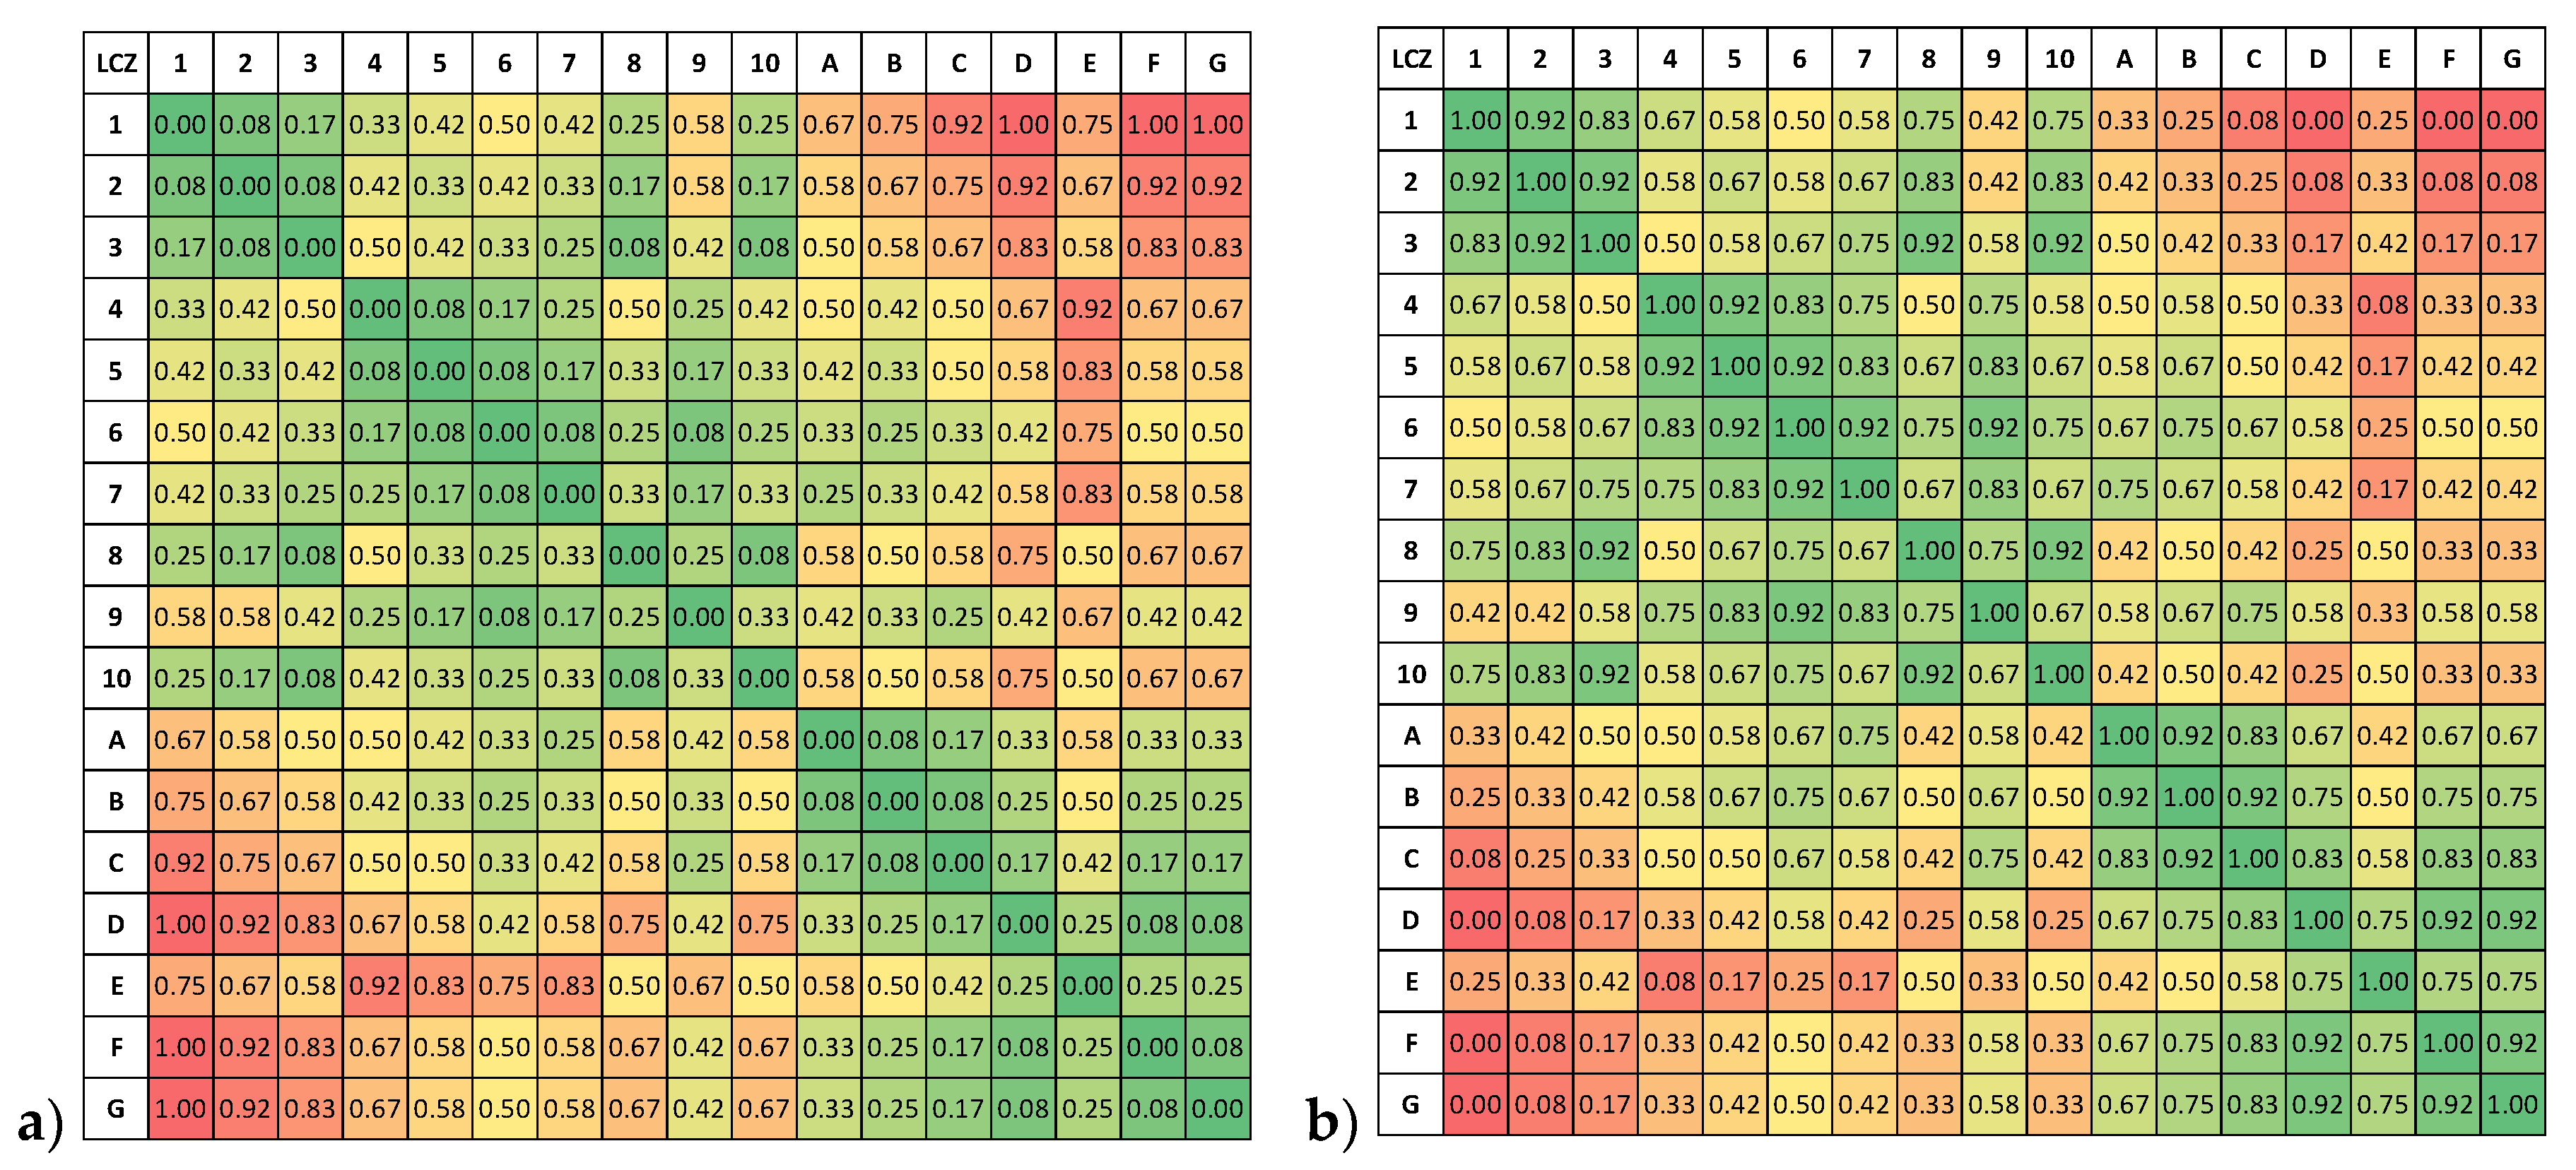
8]. The dissimilarity between any two LCZ landscape classes is derived from characteristics of the surface that influence its local climate, including openness, height, cover, and surface objects. Relating specifically to LCZs, the characteristics and their categories are (1) openness of roughness elements such as trees and buildings, with categories of compact, open, sparse, and nil; (2) height of roughness elements with categories of high, medium, low, and nil; (3) type of land cover with categories of pervious and impervious; and (4) type of surface objects with categories of buildings and plants/no buildings. The LCZ classes were grouped into clusters according to these characteristics, with one point assigned for each degree of separation between categories for the “openness” and “height” characteristics, and three points assigned for each degree of separation between categories for the “land cover” and “surface objects” characteristics. For example, comparing LCZ 1 vs. LCZ 4, one point is assigned for the “openness” category (because LCZ 1 is compact and LCZ 4 is open), zero points for the “height” category (LCZs 1 and 4 are both highrise), three points for the “land cover” category (LCZ 1 is impervious and LCZ 4 is pervious), and zero points for the “surface objects” category (both LCZs 1 and 4 are building classes). The total dissimilarity between any two LCZ classes, shown in
Figure 2, is thus the sum of points across all four characteristics, from 0 (perfect similarity) to 12 (maximum dissimilarity). In the example above (LCZ 1 vs. 4), the total dissimilarity is four points.
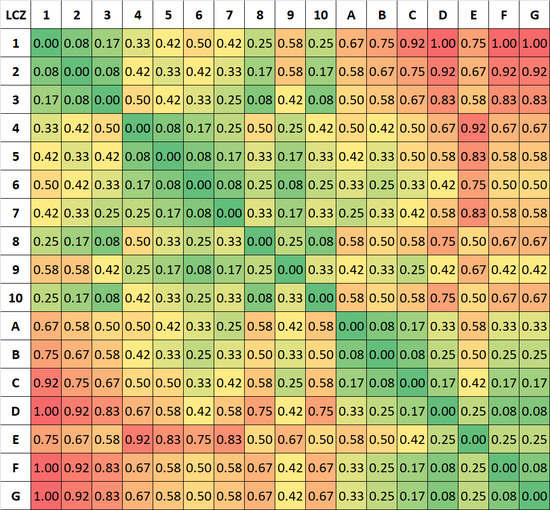
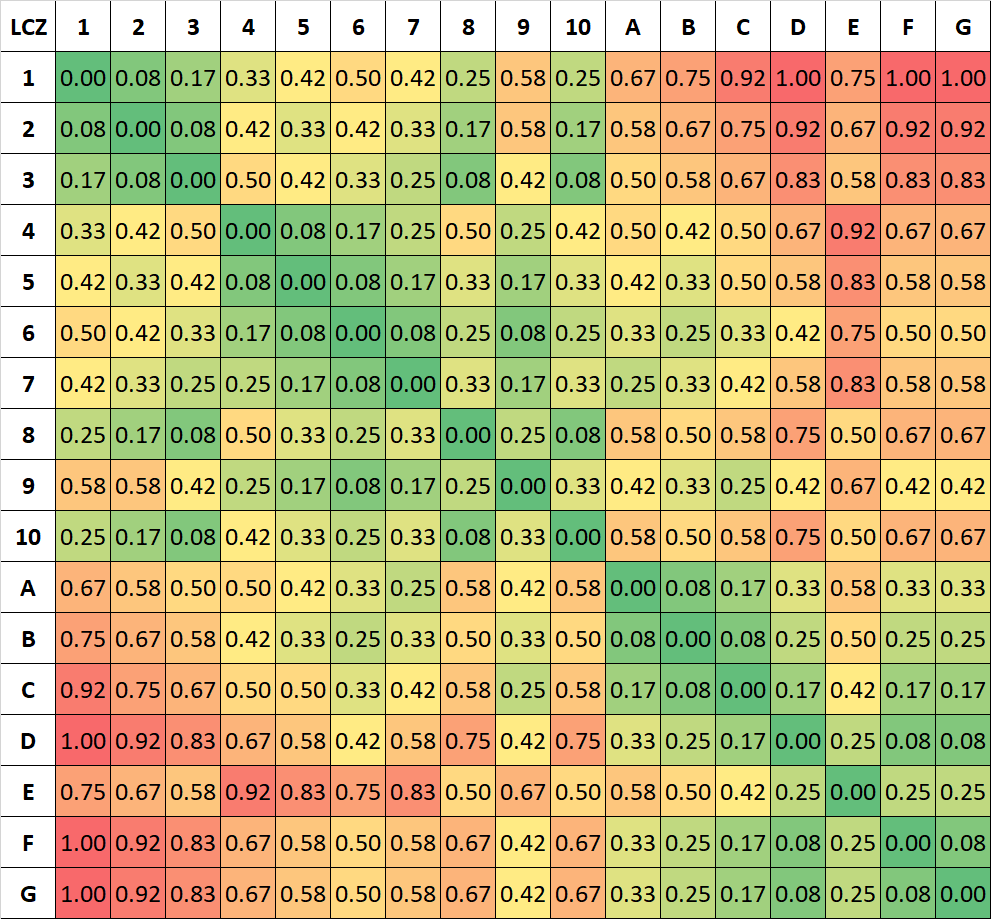
The dissimilarity point scheme was subsequently normalized to [0, 1] and inverted to create a LCZ similarity metric (see
Figure 3 and
Supplementary Materials for quantitative values). In addition, it was decided that the metric should be symmetric, i.e., LCZ x is as similar to LCZ y as LCZ y is to LCZ x. From the coloring of blocks of similar classes, it can be identified visually, for instance, that LCZs 1–3, 4–7, or A–C all share high similarity values.
2.3. Application of Metric
For a two-class problem, the overall accuracy is defined by the sum of true positives (TP) and true negatives (TN) divided by the size of the sample N, which is TP + TN + false negatives (FN) + false positives (FP) [
2]. For multi-class problems, it is the sum of the correctly classified pixels of all classes divided by N, or the trace of the confusion matrix divided by N. This could also be seen as the Hadamard product (element-wise product) between the confusion matrix and a weight matrix of the same size, where all diagonal elements are ones and the off-diagonal elements are zeros. Thus, the overall accuracy measure implies a class similarity metric, i.e., each class is fully similar to itself and fully dissimilar to any other class.
The weighted accuracy is therefore a generalization of the overall accuracy. For a specific set of weights, it gives the full score to a correct classification, but also a reduced score for a minor misclassification into one of the more similar classes according to the class metric. Thus, the weighted accuracy is defined as the accuracy computed on a matrix issued by the Hadamard product of the confusion matrix and the similarity metric defined above. The weighted accuracy is thus defined as the sum of the element-wise products of the similarity weight matrix (
) and the confusion matrix (
) divided by the sample size
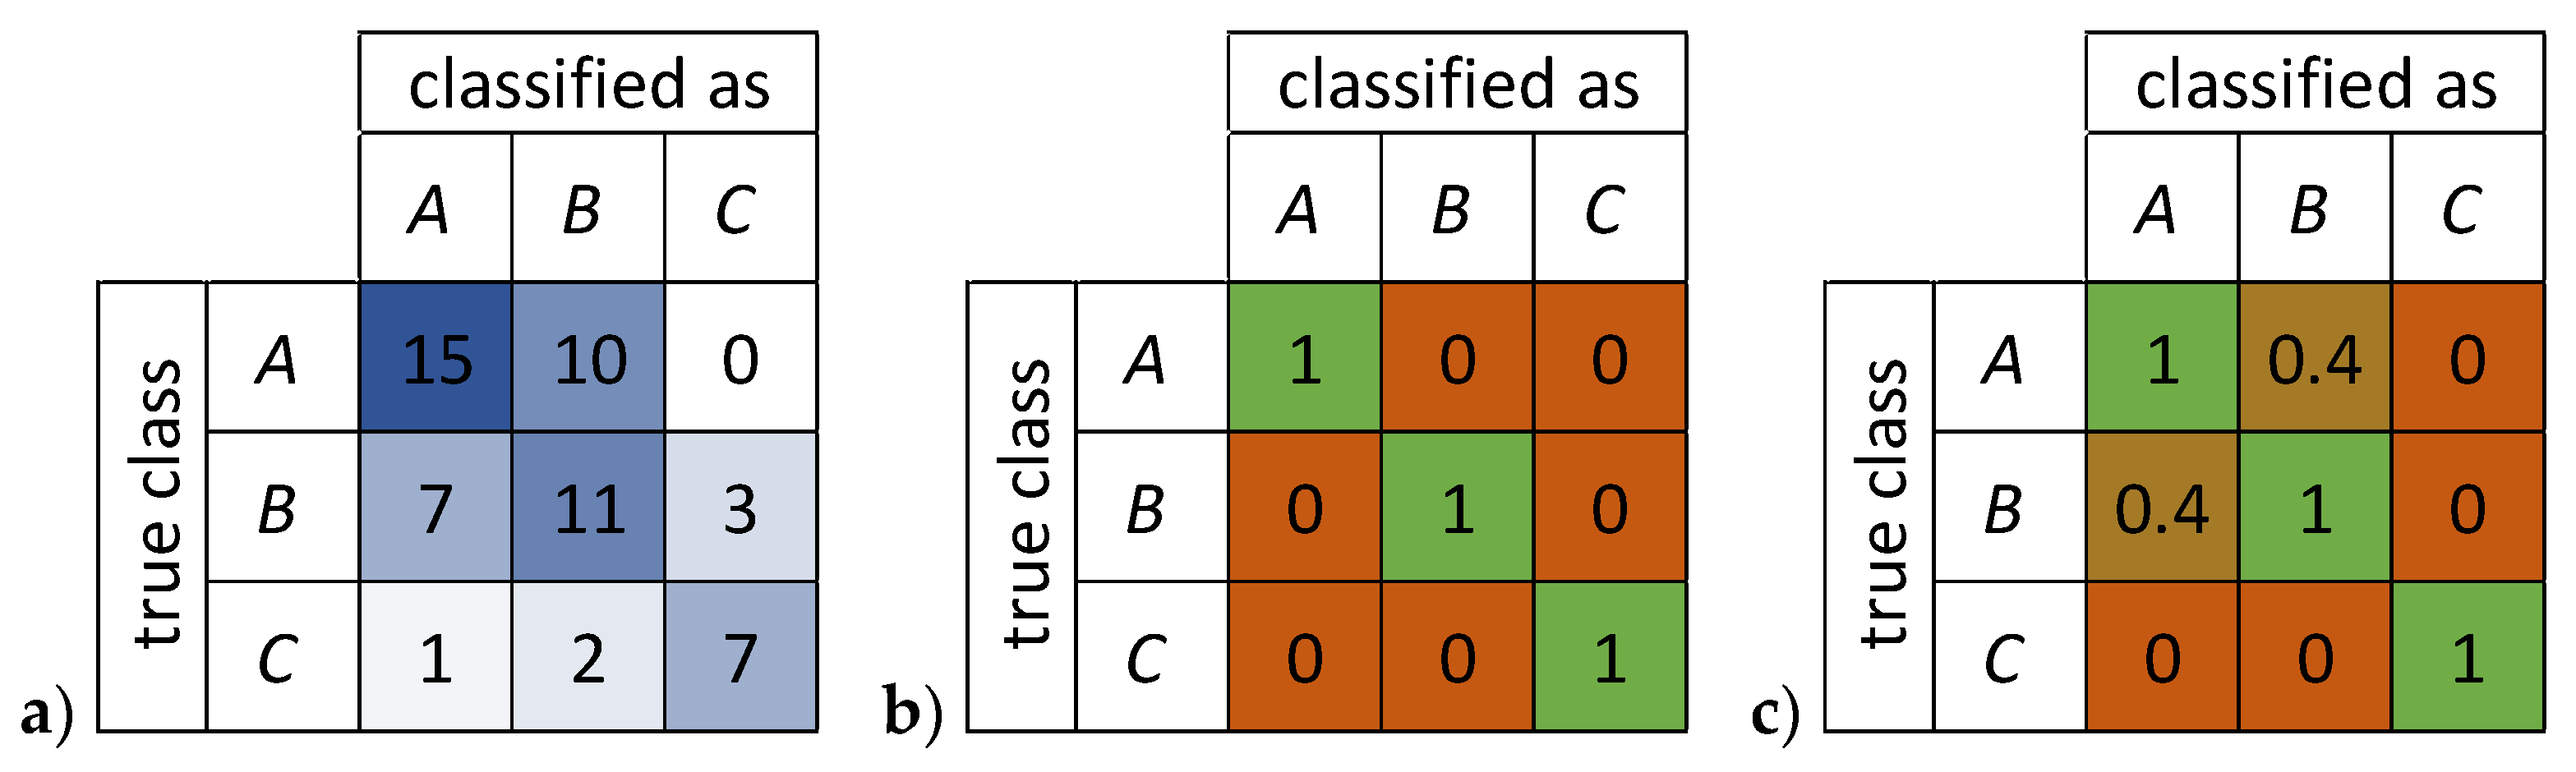
NFor better understanding, we consider a simple three-class example, where A and B are somewhat alike and C is completely different from both A and B (
Figure 4).
Thus, we define the similarity for A and B as 0.4, and 0 for A/B versus C, resulting in the similarity metric defined in
Figure 4c. For the given example, the overall accuracy is
and the weighted accuracy is
3. Rejection of Johnson and Jozdani Method
It has clearly been shown that the JJ19 paper is based on wrong assumptions and the Bechtel et al. (B17) method fully complies with their requirements, i.e., it is based on the physical characteristics of the LCZ classes and it applies higher penalties for more dissimilar LCZ classes. Thus, the JJ19 method is not as innovative as claimed. However, we argue that it is moreover less compelling, both in terms of the applied weights and the way the accuracy is computed. To demonstrate this,
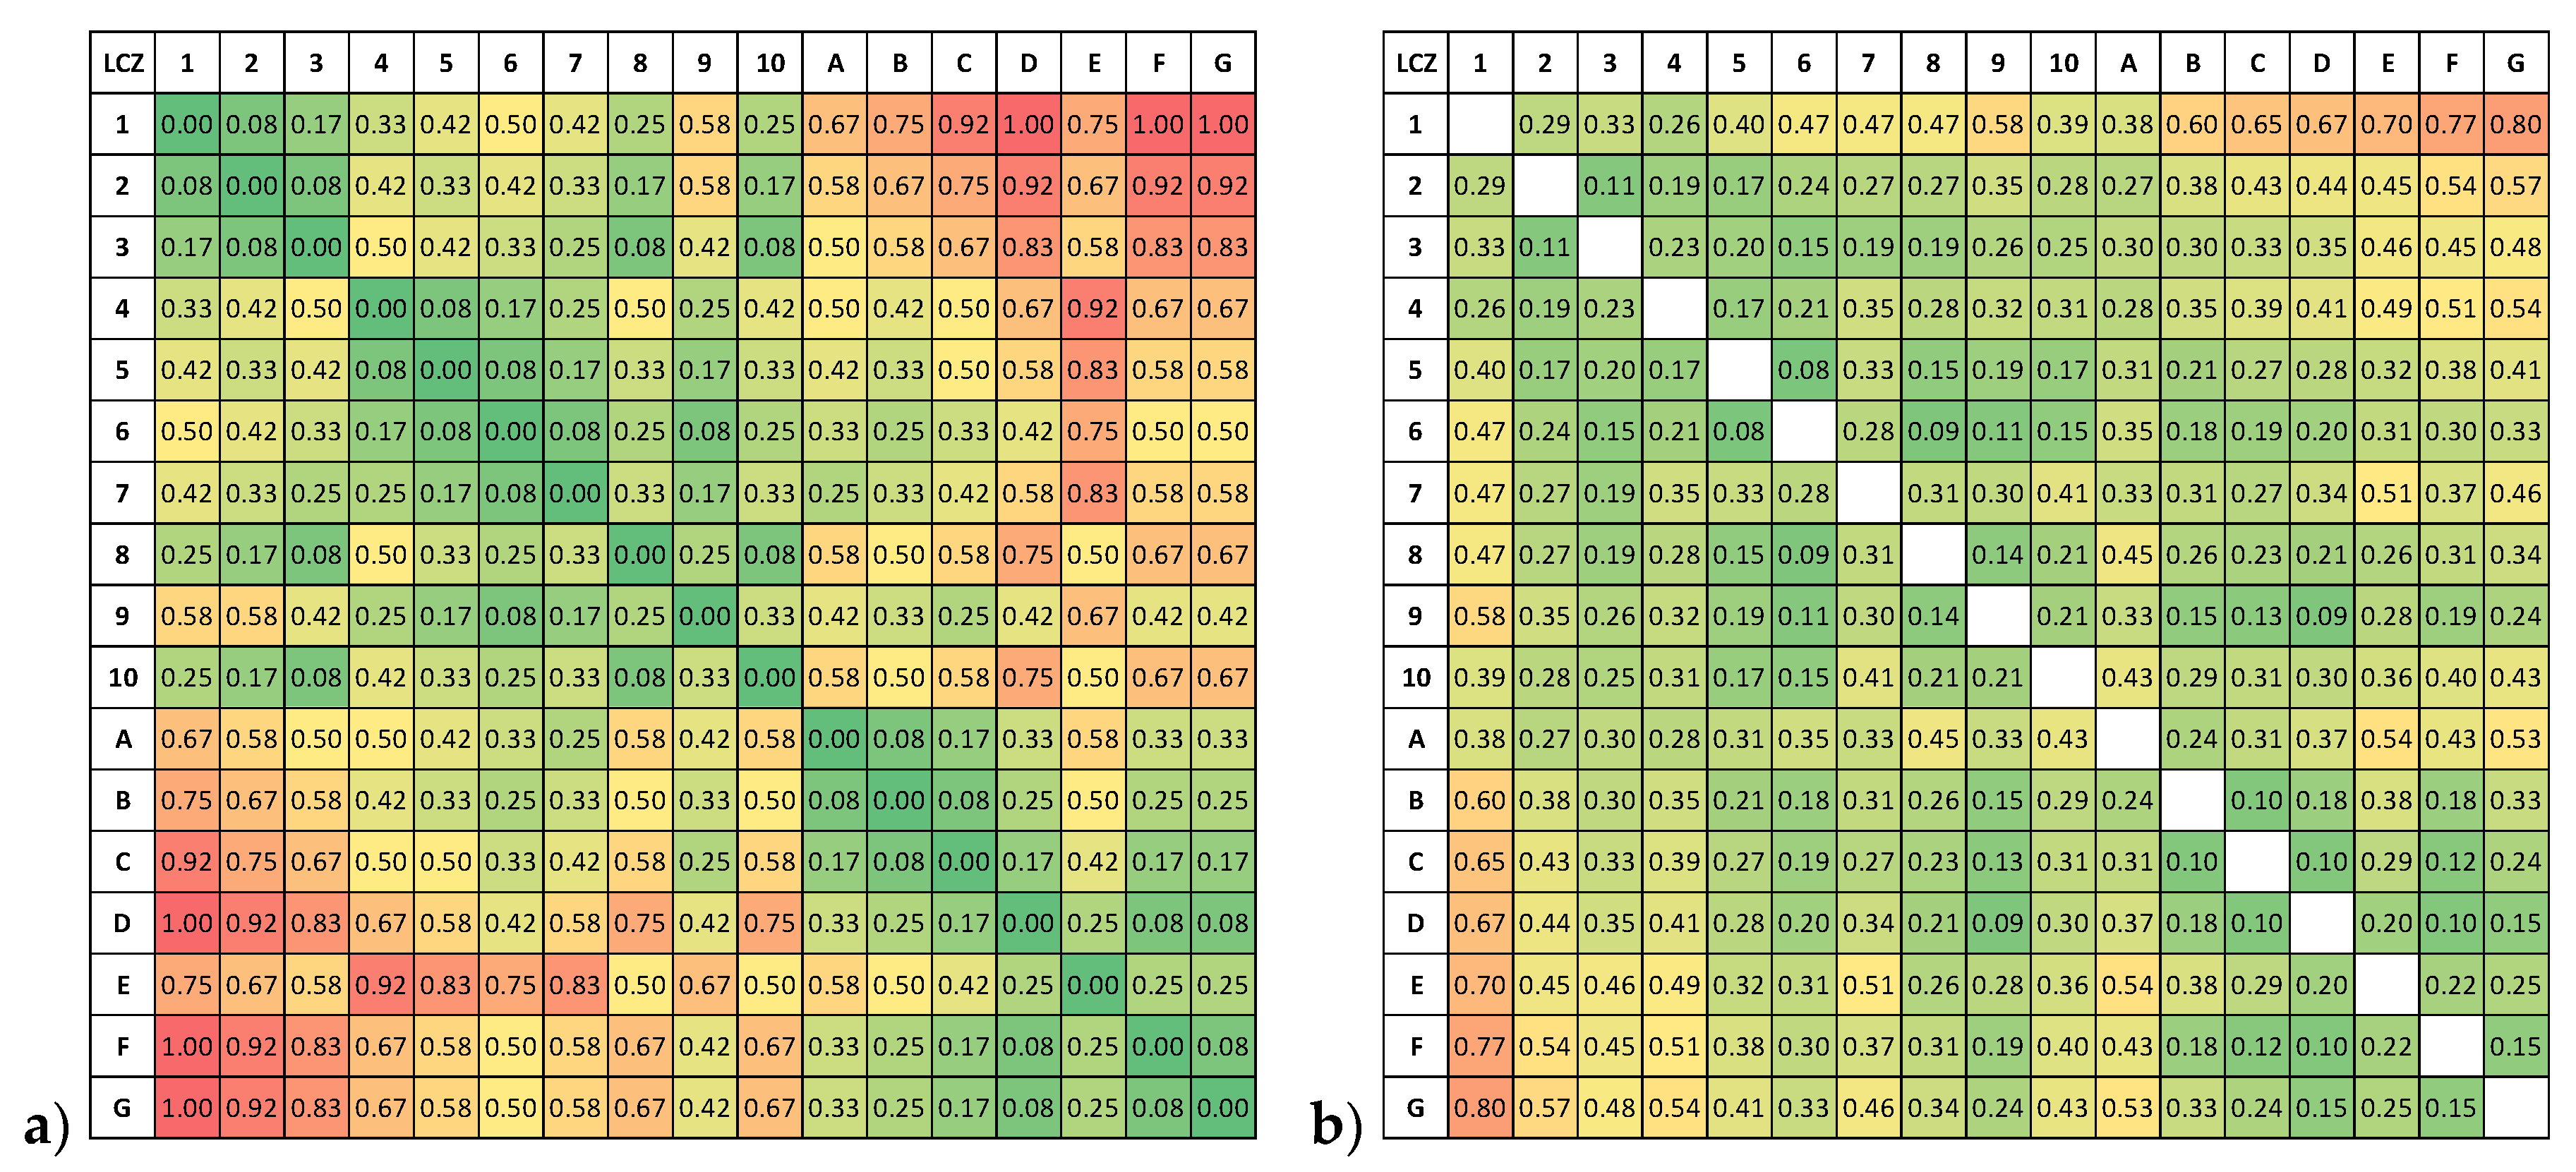
Figure 5 displays the JJ19 weights in the same colourmap as the B17 dissimilarities from
Figure 3a.
It is immediately apparent that there is very little variation within the class combinations for JJ19; built and natural classes cannot be distinguished from the metric and except for LCZ 1 (compact highrise), they all seem to be of “similar” similarity. In particular, there is not one class-combination that is fully dissimilar. More specifically, the highest penalty is 0.80 between LCZ 1 (compact highrise) and LCZ G (water). All other urban LCZ types are even more similar to water. The inappropriateness of the JJ19 weights becomes especially obvious when the weights are compared amongst each other. For example, misclassifying LCZ 6 (open lowrise) into LCZ G (water) is as wrong as misclassifying LCZ 1 (compact highrise) into LCZ 3 (compact lowrise). Moreover, LCZ 6 (open lowrise) and LCZ G (water) are more alike than LCZ 1 (compact highrise) and LCZ 5 (open midrise). Except for LCZ 1 (compact highrise), no penalty for misclassifying a built class into any natural class is higher than 0.57: e.g., the highest penalty for LCZ 10 (heavy industry) is 0.43, suggesting that is it more alike than dislike any of the natural classes.
Secondly, the measure of JJ19 does not give points for similar classes but virtually reduces the number of these misclassifications in the confusion matrix and therefore the sample size while maintaining the number of correct classifications. This has peculiar effects, as the following gedanken experiment shows. The most alike class pair in JJ19 is LCZs 5 (open midrise) and 6 (open lowrise), which is also among the most alike pairs in B17. Let us assume that a landscape composed entirely of LCZ 5 (open midrise) has been completely misclassified into LCZ 6 (open lowrise). Using the method of B17, this would still result in a high weighted accuracy of 0.92 according to the high similarity of the classes. Using JJ19, the resulting weighted accuracy would be zero, since no pixel was classified correctly. More generally, in JJ19, the effect of the weights is higher for higher overall accuracies. Thus, the JJ19 method fails basic requirements of a weighted accuracy scheme, i.e., that it always gives credit for ‘minor’ misclassifications.
4. Conclusions
In this comment, the weighted accuracy measure introduced in [
4] was explained in more detail. In particular, the rationale and development of the LCZ similarity metric was discussed and the application of the measure was clarified. It was highlighted that a weighted accuracy is always related to a specific purpose, and hence its appropriateness requires expert judgement.
Simultaneously, the suggested accuracy measure of JJ19 was rejected by showing that it lacks innovation and involves wrong assumptions. The metric of B17 is not perfect and is still under development i.e., the weights are being optimized for particular purposes, yet it is clearly more rational than the one provided in JJ19.
In addition, it was shown that the weighted accuracy has potential uses that extend far beyond the LCZ classification case, e.g., to land cover mapping or any multi-class classification task in which a physically based similarity scheme can be defined. In particular, it may pave the way for comparison of classifications results using different typologies and semantic complexities. Therefore, some standards should be considered, i.e., that the lowest weight should be zero, the highest similarity for unequal classes should be below one, aggregation of sub-classes should preserve similarity, or the value for a fully random result should be in a certain range.


