The Demographics of West Midlands County is analysed by the Office for National Statistics and data is produced for each of its seven metropolitan boroughs and the county overall.

Ethnicity
| Ethnic Group | Year | |||||||||||
|---|---|---|---|---|---|---|---|---|---|---|---|---|
| 1966 estimations[1] | 1971 estimations[2] | 1981 estimations[3] | 1991 census[4] | 2001 census[5] | 2021 census[6] | |||||||
| Number | % | Number | % | Number | % | Number | % | Number | % | Number | % | |
| White: Total | - | - | 2,580,903 | 93.2% | 2,371,072 | 88.7% | 2,237,135 | 85.1% | 2,043,231 | 80% | 1,793,173 | 61.4% |
| White: British | - | - | - | - | - | - | - | - | 1,956,156 | 76.5% | 1,630,823 | 55.9% |
| White: Irish | - | - | - | - | - | - | - | - | 54,011 | 2.1% | 31,490 | 1.1% |
| White: Gypsy or Irish Traveller[a] | - | - | - | - | - | - | - | - | 2417 | |||
| White: Roma | - | - | - | - | - | - | - | - | 4246 | |||
| White: Other | - | - | - | - | - | - | - | - | 33,064 | 1.3% | 124,197 | 4.3% |
| Asian or Asian British: Total | - | - | - | - | 206,289 | 7.7% | 276,162 | 10.5% | 352,288 | 13.8% | 667,315 | 22.9% |
| Asian or Asian British: Indian | - | - | - | - | 118,101 | 4.4% | 148,320 | 5.6% | 157,062 | 6.1% | 226,927 | 7.8% |
| Asian or Asian British: Pakistani | - | - | - | - | 65,985 | 2.5% | 93,426 | 3.6% | 138,007 | 5.4% | 278,837 | 9.6% |
| Asian or Asian British: Bangladeshi | - | - | - | - | 11,006 | 0.4% | 19,131 | 0.7% | 29,085 | 1.1% | 72,168 | 2.5% |
| Asian or Asian British: Chinese[b] | - | - | - | - | 4,543 | 0.2% | 6,119 | 0.2% | 10,548 | 0.4% | 22,718 | 0.8% |
| Asian or Asian British: Other Asian | - | - | - | - | 6,654 | 9,166 | 17,586 | 66,665 | 2.3% | |||
| Black or Black British: Total | - | - | - | - | 80,412 | 3% | 96,384 | 3.7% | 95,234 | 3.7% | 236,047 | 8.1% |
| Black or Black British: African | - | - | - | - | 3,602 | 0.1% | 4,134 | 0.2% | 10,000 | 0.4% | 126,041 | 4.3% |
| Black or Black British: Caribbean | - | - | - | - | 63,597 | 2.4% | 75,612 | 2.9% | 76,386 | 3% | 81,732 | 2.8% |
| Black or Black British: Other Black | - | - | - | - | 13,213 | 16,638 | 0.6% | 8,848 | 0.3% | 28,274 | 1% | |
| Mixed: Total | - | - | - | - | - | - | - | - | 54,757 | 2.1% | 121,685 | 4.2% |
| Mixed: White and Black Caribbean | - | - | - | - | - | - | - | - | 31,525 | 1.2% | 59,903 | 2.1% |
| Mixed: White and Black African | - | - | - | - | - | - | - | - | 2,446 | 9,735 | ||
| Mixed: White and Asian | - | - | - | - | - | - | - | - | 12,641 | 28,872 | ||
| Mixed: Other Mixed | - | - | - | - | - | - | - | - | 8,145 | 23,175 | ||
| Other: Total | - | - | - | - | 15,327 | 0.5% | 19,719 | 0.7% | 10,082 | 0.4% | 101,435 | 3.5% |
| Other: Arab[a] | - | - | - | - | - | - | - | - | - | - | 28,083 | 1% |
| Other: Any other ethnic group | - | - | - | - | - | - | - | - | 10,082 | 0.4% | 73,352 | 2.5% |
| Ethnic minority: Total | 102,850 | - | 188,306 | 6.8% | 302,027 | 11.3% | 392,265 | 14.9% | 512,361 | 20% | 1,126,482 | 38.6% |
| Total | - | 100% | 2,769,209 | 100% | 2,673,099 | 100% | 2,629,400 | 100% | 2,555,592 | 100% | 2,919,655 | 100% |
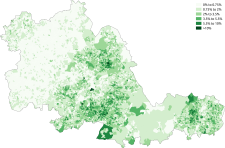
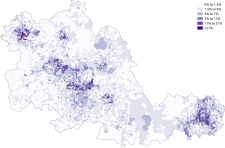
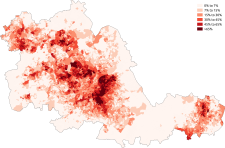
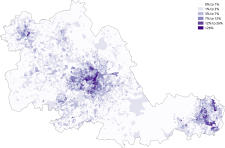
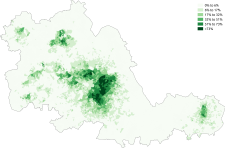
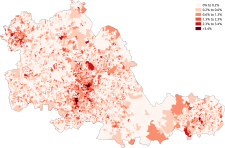
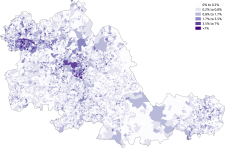
Distribution of ethnic groups in the West Midlands according to the 2011 census.
-
 White
White -
 White-British
 -
 White-Irish
 -
 White-Other
 -
 Asian
Asian -
 Asian-Indian
 -
 Asian-Pakistani
 -
 Asian-Bangladeshi
 -
 Asian-Chinese
 -
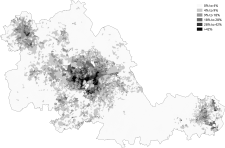 Black
Black -
 Black-African
 -
 Black-Caribbean
 -
 Other-Arab


Country of birth
| Country of birth | 2021[7] | |
|---|---|---|
| Number | % | |
| Vereinigtes Königreich | 2,286,558 | 78.3% |
| EU Countries | 165,431 | 5.7% |
| Other European | 15,241 | 0.5% |
| Africa | 102,205 | 3.5% |
| Middle East and Asia | 308,122 | 10.6% |
| Caribbean and Americas | 37,477 | 1.3% |
| Oceania | 2,275 | 0.1% |
| British Overseas | 2,340 | 0.1% |
| Overall | 2,919,649 | 100% |
Religion
| Religion | 2001[8] | 2021[9] | ||
|---|---|---|---|---|
| Number | % | Number | % | |
| No religion | 305,365 | 11.9% | 814,372 | 27.9% |
| Christian | 1,701,519 | 66.5% | 1,189,066 | 40.7% |
| Buddhist | 5,817 | 9,380 | ||
| Hindu | 49,484 | 68,376 | ||
| Jewish | 3,310 | 2,559 | ||
| Muslim | 191,559 | 7.5% | 501,480 | 17.2% |
| Sikh | 91,890 | 148,937 | ||
| Other religion | 5,381 | 17,805 | ||
| Not answered | 201,267 | 167,685 | ||
| Total | 2,555,592 | 100% | 2,919,660 | 100% |
Distribution of religions in the West Midlands according to the 2011 census.
-
 Christianity
-
 Islam
Islam
-
 Judaism
-
 Hinduism
-
 Sikhism
-
 Buddhism
-
 Other religion
-
 No religion
Distribution of religions in the West Midlands according to the 2011 census.
-
Christianity
-
Islam
-
Judaism
-
Hinduism
-
Sikhism
-
Buddhism
-
Other religion
-
No religion


Housing
| Tenure | 2001[10] | 2021[11] | ||
|---|---|---|---|---|
| Number | % | Number | % | |
| Owned | 667,665 | 657,680 | ||
| Social renting | 262,163 | 248,490 | ||
| Private renting | 73,373 | 221,929 | ||
| Rent free | 29,743 | 3,661 | ||
| Total | 1,032,944 | 100% | 1,131,760 | |
- ^ Patterson, Sheila; Relations, Institute of Race (1969). Immigration and Race Relations in Britain, 1960-1967. Institute of Race Relations. ISBN 978-0-19-218174-9.
- ^ Explaining ethnic differences: Changing patterns of disadvantage in Britain (1 ed.). Bristol University Press. 2003. doi:10.2307/j.ctt1t8915s. JSTOR j.ctt1t8915s.
- ^ Ethnicity in the 1991 census: Vol 3 - Social geography and ethnicity in Britain, geographical spread, spatial concentration and internal migration. Internet Archive. London : HMSO. 1996. ISBN 978-0-11-691655-6.
{{cite book}}: CS1 maint: others (link) - ^ Ethnicity in the 1991 census: Vol 3 - Social geography and ethnicity in Britain, geographical spread, spatial concentration and internal migration. Internet Archive. London : HMSO. 1996. ISBN 978-0-11-691655-6.
{{cite book}}: CS1 maint: others (link) - ^ "KS006 - Ethnic group - Nomis - Official Census and Labour Market Statistics". www.nomisweb.co.uk. Retrieved 2024-06-15.
- ^ "Ethnic group - Office for National Statistics". www.ons.gov.uk. Retrieved 2024-06-15.
- ^ "TS004 - Country of birth - Nomis - Official Census and Labour Market Statistics". www.nomisweb.co.uk. Retrieved 2024-06-30.
- ^ "KS007 - Religion - Nomis - Official Census and Labour Market Statistics". www.nomisweb.co.uk. Retrieved 2024-06-30.
- ^ "TS030 - Religion - Nomis - Official Census and Labour Market Statistics". www.nomisweb.co.uk. Retrieved 2024-06-30.
- ^ "KS018 - Tenure - Nomis - Official Census and Labour Market Statistics". www.nomisweb.co.uk. Retrieved 2024-06-30.
- ^ "TS054 - Tenure - Nomis - Official Census and Labour Market Statistics". www.nomisweb.co.uk. Retrieved 2024-06-30.
Cite error: There are <ref group=lower-alpha> tags or {{efn}} templates on this page, but the references will not show without a {{reflist|group=lower-alpha}} template or {{notelist}} template (see the help page).