2012 United States presidential election in Indiana: Difference between revisions
deleted an extraneous paragraph that I wrote earlier |
→Counties that swung from Democratic to Republican: there's a difference between flipping and swinging |
||
| Line 490: | Line 490: | ||
|} |
|} |
||
====Counties that |
====Counties that flipped from Democratic to Republican==== |
||
* [[Madison County, Indiana|Madison]] (largest city: [[Anderson, Indiana|Anderson]]) |
* [[Madison County, Indiana|Madison]] (largest city: [[Anderson, Indiana|Anderson]]) |
||
Revision as of 22:00, 31 January 2021
| ||||||||||||||||||||||||||
| ||||||||||||||||||||||||||
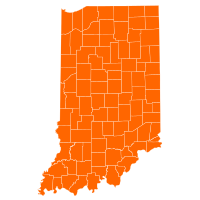
 County Results
| ||||||||||||||||||||||||||
| ||||||||||||||||||||||||||
| Elections in Indiana |
|---|
 |
The 2012 United States presidential election in Indiana took place on November 6, 2012, as part of the 2012 United States presidential election in which all 50 states plus the District of Columbia participated. Indiana voters chose 11 electors to represent them in the Electoral College via a popular vote pitting incumbent Democratic President Barack Obama and his running mate, Vice President Joe Biden, against Republican challenger and former Massachusetts Governor Mitt Romney and his running mate, Congressman Paul Ryan. Romney and Ryan carried Indiana with 54.1% of the popular vote to Obama's and Biden's 43.9%, thus winning the state's 11 electoral votes.[1]
Indiana was one of just two states (along with North Carolina) which had been won by Obama in 2008 but which flipped to the Republicans in 2012. Although the state normally leans Republican, in 2008 Obama had been the first Democrat to win Indiana since 1964, albeit by a narrow 1.03% margin. However, unlike North Carolina, Indiana was not seriously contested again by the Obama campaign in 2012, and consequently Romney was able to carry it by a relatively comfortable 10.20%. Obama also lost six counties he had won in 2008.
Obama won in Vigo County, home to Terre Haute, and at the time, a noted bellwether; before 2020, it had voted for the winner of every presidential election all but twice since 1892. After 2012, demographic change and the rightward turn of exurban areas accelerated by the Trump era have made Vigo County uncompetitive to the present day.[2]
Campaign
Incumbent Obama didn't visit Indiana, although First Lady Michelle Obama, Vice President Joe Biden and former President Bill Clinton stumped in the state. Meanwhile, the Romney campaign sensed victory in the state, and he visited Indiana several times.[3]
Democratic primary
No major Democratic candidate challenged President Obama for the Democratic nomination in 2012.
Republican primary
| |||||||||||||||||||||||||||||||||||||||||
| |||||||||||||||||||||||||||||||||||||||||
 Indiana results by county
Mitt Romney
(Note: Italicization indicates a withdrawn candidacy) | |||||||||||||||||||||||||||||||||||||||||
The Republican primary took place on May 8, 2012.[4][5]
| Indiana Republican primary, 2012[6] | |||||||
|---|---|---|---|---|---|---|---|
| Candidate | Votes | Percentage | Projected delegate count | ||||
| AP | CNN |
FOX | |||||
| 410,635 | 64.61% | 28 | 27 | ||||
| Ron Paul | 98,487 | 15.50% | |||||
| Rick Santorum (withdrawn) | 85,332 | 13.43% | |||||
| Newt Gingrich (withdrawn) | 41,135 | 6.47% | |||||
| Unprojected delegates: | 18 | 19 | 46 | ||||
| Total: | 635,589 | 100.00% | 46 | 46 | 46 | ||
General election
Polling
Republican Nominee Mitt Romney won every pre-election poll conducted in the state by at least 5%, and often by double digits. The average of the final 3 polls had Romney leading Obama 51% to 43%. [7]
Results
| 2012 United States presidential election in Indiana[8] | ||||||
|---|---|---|---|---|---|---|
| Party | Candidate | Running mate | Votes | Percentage | Electoral votes | |
| Republican | Mitt Romney | Paul Ryan | 1,420,543 | 54.13% | 11 | |
| Democratic | Barack Obama | Joe Biden | 1,152,887 | 43.93% | 0 | |
| Libertarian | Gary Johnson | Jim Gray | 50,111 | 1.91% | 0 | |
| Green (Write-in) | Jill Stein (Write-in) | Cheri Honkala | 625 | 0.02% | 0 | |
| Constitution (Write-in) | Virgil Goode (Write-in) | Jim Clymer | 290 | 0.01% | 0 | |
| America's Party (Write-in) | Thomas Hoefling (Write-in) | Jonathan D. Ellis | 35 | 0.00% | 0 | |
| Socialist (Write-in) | Stewart Alexander (Write-in) | Alex Mendoza | 17 | 0.00% | 0 | |
| Write-Ins | Write-Ins | 10 | 0.00% | 0 | ||
| Unaffiliated (Write-in) | Jill Ann Reed (Write-in) | Tom Cary | 8 | 0.00% | 0 | |
| Independent (Write-in) | Randall Terry (Write-in) | Missy Smith | 8 | 0.00% | 0 | |
| Totals | 2,624,534 | 100.00% | 11 | |||
Following Romney's win in Indiana, The Indianapolis Star said that "Voters painted Indiana bright red on Tuesday- with a splash or so of blue" and that "voters also proved that while this state is conservative, it doesn't like to stray too far from the middle".[9]
The following people were delegate electors for Romney-Ryan in the Indiana Republican Party:[citation needed]
- Charles Williams, of Valparaiso
- William Ruppel, of North Manchester
- Steve Shine, of Fort Wayne
- Beverly Bush, of Kirklin
- Kyle Hupfer, of Pendleton
- Susan Lightle, of Greenfield
- Pearl Swanigan, of Indianapolis
- William Springer, of Sullivan
- Jamey Noel, of Jeffersonville
- Robert Grand, of Indianapolis
- Eric Holcomb, of Indianapolis
By county
Obama won nine counties compared to Romney's 83. Mitt Romney won by winning in most rural areas of the state. Romney also did well in the Indianapolis suburbs, Allen County home of Fort Wayne, and Vanderburgh County home of Evansville. As expected, Obama did better in urban, densely populated areas. Obama trounced Romney in Marion County home of Indianapolis as well as Lake County home of Gary and East Chicago. Obama also, for the most part did well in counties that contained major colleges such as Indiana University, Bloomington in Monroe County; Notre Dame University, South Bend in St. Joseph County; Indiana University-Purdue University Indianapolis in Marion County; and Valparaiso University in Porter County. Vigo County, home of Terre Haute, stayed true to its name as a bellwether, as it had selected the winner of every presidential election since 1888 with the exception of 1908 and 1952. Vigo County narrowly went for Obama, and Obama ended up being re-elected.
Obama lost six counties that he won in 2008. As of 2020, this election is the most recent time that Delaware, LaPorte, Porter and Vigo counties went for a Democratic presidential candidate. (Donald Trump, who carried all of the aforementioned counties in both of his presidential runs, ended Vigo's bellwether reputation in 2020.)
| County | Obama% | Obama# | Romney% | Romney# | Others% | Others# | Total |
|---|---|---|---|---|---|---|---|
| Adams | 29.25% | 3,806 | 68.69% | 8,937 | 2.06% | 268 | 13,011 |
| Allen | 40.86% | 60,036 | 57.58% | 84,613 | 1.56% | 2,290 | 146,939 |
| Bartholomew | 36.23% | 10,625 | 61.66% | 18,083 | 2.11% | 618 | 29,326 |
| Benton | 32.39% | 1,159 | 65.09% | 2,329 | 2.52% | 90 | 3,578 |
| Blackford | 40.63% | 1,927 | 57.16% | 2,711 | 2.21% | 105 | 4,743 |
| Boone | 30.02% | 8,328 | 67.81% | 18,808 | 2.17% | 601 | 27,737 |
| Brown | 40.24% | 3,060 | 56.97% | 4,332 | 2.79% | 212 | 7,604 |
| Carroll | 33.74% | 2,635 | 64.01% | 4,999 | 2.25% | 176 | 7,810 |
| Cass | 37.93% | 5,371 | 59.62% | 8,443 | 2.45% | 347 | 14,161 |
| Clark | 44.13% | 20,807 | 53.98% | 25,450 | 1.89% | 889 | 47,146 |
| Clay | 32.08% | 3,460 | 65.80% | 7,096 | 2.11% | 228 | 10,784 |
| Clinton | 33.47% | 3,308 | 64.13% | 6,338 | 2.40% | 237 | 9,883 |
| Crawford | 44.47% | 2,041 | 52.75% | 2,421 | 2.79% | 128 | 4,590 |
| Daviess | 23.78% | 2,437 | 74.52% | 7,638 | 1.71% | 175 | 10,250 |
| Dearborn | 29.20% | 6,528 | 68.86% | 15,394 | 1.94% | 434 | 22,356 |
| Decatur | 28.53% | 2,941 | 69.06% | 7,119 | 2.41% | 248 | 10,308 |
| DeKalb | 33.19% | 5,419 | 64.84% | 10,587 | 1.97% | 322 | 16,328 |
| Delaware | 50.38% | 22,654 | 47.26% | 21,251 | 2.36% | 1,063 | 44,968 |
| Dubois | 35.17% | 6,522 | 62.85% | 11,654 | 1.97% | 366 | 18,542 |
| Elkhart | 35.96% | 24,399 | 62.46% | 42,378 | 1.58% | 1,075 | 67,852 |
| Fayette | 40.23% | 3,555 | 57.09% | 5,045 | 2.68% | 237 | 8,837 |
| Floyd | 41.95% | 14,812 | 56.30% | 19,878 | 1.74% | 615 | 35,305 |
| Fountain | 31.46% | 2,237 | 65.59% | 4,664 | 2.95% | 210 | 7,111 |
| Franklin | 27.55% | 2,909 | 70.30% | 7,424 | 2.15% | 227 | 10,560 |
| Fulton | 32.25% | 2,621 | 65.43% | 5,317 | 2.31% | 188 | 8,126 |
| Gibson | 33.48% | 4,928 | 64.45% | 9,487 | 2.08% | 306 | 14,721 |
| Grant | 37.92% | 9,589 | 59.92% | 15,151 | 2.16% | 545 | 25,285 |
| Greene | 33.18% | 4,350 | 64.50% | 8,457 | 2.32% | 304 | 13,111 |
| Hamilton | 32.00% | 43,796 | 66.30% | 90,747 | 1.70% | 2,320 | 136,863 |
| Hancock | 28.37% | 9,319 | 69.41% | 22,796 | 2.22% | 728 | 32,843 |
| Harrison | 37.39% | 6,607 | 60.21% | 10,640 | 2.40% | 424 | 17,671 |
| Hendricks | 31.68% | 21,112 | 66.49% | 44,312 | 1.83% | 1,220 | 66,644 |
| Henry | 40.05% | 7,613 | 57.02% | 10,838 | 2.93% | 556 | 19,007 |
| Howard | 41.71% | 15,135 | 56.01% | 20,327 | 2.28% | 828 | 36,290 |
| Huntington | 29.15% | 4,596 | 68.90% | 10,862 | 1.95% | 307 | 15,765 |
| Jackson | 34.93% | 5,838 | 62.34% | 10,419 | 2.72% | 455 | 16,712 |
| Jasper | 36.23% | 4,672 | 61.69% | 7,955 | 2.09% | 269 | 12,896 |
| Jay | 38.77% | 3,063 | 58.79% | 4,645 | 2.44% | 193 | 7,901 |
| Jefferson | 43.64% | 5,728 | 54.06% | 7,096 | 2.30% | 302 | 13,126 |
| Jennings | 37.28% | 3,821 | 59.71% | 6,120 | 3.01% | 309 | 10,250 |
| Johnson | 29.78% | 17,260 | 68.17% | 39,513 | 2.05% | 1,191 | 57,964 |
| Knox | 34.52% | 5,228 | 63.47% | 9,612 | 2.01% | 305 | 15,145 |
| Kosciusko | 22.83% | 6,862 | 75.04% | 22,558 | 2.13% | 640 | 30,060 |
| LaGrange | 31.11% | 2,898 | 66.88% | 6,231 | 2.01% | 187 | 9,316 |
| Lake | 64.88% | 130,897 | 33.92% | 68,431 | 1.20% | 2,430 | 201,758 |
| LaPorte | 55.19% | 24,107 | 42.62% | 18,615 | 2.20% | 959 | 43,681 |
| Lawrence | 32.43% | 5,779 | 65.21% | 11,622 | 2.36% | 421 | 17,822 |
| Madison | 46.60% | 24,407 | 51.12% | 26,769 | 2.28% | 1,194 | 52,370 |
| Marion | 60.26% | 216,336 | 38.02% | 136,509 | 1.72% | 6,164 | 359,009 |
| Marshall | 34.55% | 6,137 | 63.38% | 11,260 | 2.07% | 368 | 17,765 |
| Martin | 28.48% | 1,351 | 68.78% | 3,262 | 2.74% | 130 | 4,743 |
| Miami | 33.03% | 4,222 | 63.95% | 8,174 | 3.01% | 385 | 12,781 |
| Monroe | 58.43% | 33,436 | 39.29% | 22,481 | 2.28% | 1,306 | 57,223 |
| Montgomery | 29.58% | 4,271 | 68.03% | 9,824 | 2.39% | 345 | 14,440 |
| Morgan | 28.19% | 7,969 | 69.31% | 19,591 | 2.50% | 706 | 28,266 |
| Newton | 39.12% | 2,212 | 58.21% | 3,291 | 2.67% | 151 | 5,654 |
| Noble | 32.19% | 5,229 | 65.75% | 10,680 | 2.06% | 335 | 16,244 |
| Ohio | 35.26% | 994 | 62.40% | 1,759 | 2.34% | 66 | 2,819 |
| Orange | 37.80% | 2,939 | 59.38% | 4,617 | 2.83% | 220 | 7,776 |
| Owen | 34.80% | 2,823 | 62.39% | 5,062 | 2.81% | 228 | 8,113 |
| Parke | 32.39% | 2,110 | 64.99% | 4,234 | 2.62% | 171 | 6,515 |
| Perry | 54.81% | 4,316 | 43.21% | 3,403 | 1.98% | 156 | 7,875 |
| Pike | 35.86% | 2,125 | 61.20% | 3,627 | 2.94% | 174 | 5,926 |
| Porter | 51.00% | 37,252 | 47.11% | 34,406 | 1.89% | 1,381 | 73,039 |
| Posey | 37.08% | 4,533 | 60.77% | 7,430 | 2.15% | 263 | 12,226 |
| Pulaski | 35.17% | 1,899 | 62.34% | 3,366 | 2.48% | 134 | 5,399 |
| Putnam | 32.59% | 4,507 | 65.12% | 9,005 | 2.29% | 317 | 13,829 |
| Randolph | 36.99% | 3,769 | 61.03% | 6,218 | 1.98% | 202 | 10,189 |
| Ripley | 29.51% | 3,241 | 68.14% | 7,484 | 2.35% | 258 | 10,983 |
| Rush | 31.61% | 2,221 | 65.94% | 4,633 | 2.45% | 172 | 7,026 |
| Scott | 45.85% | 3,998 | 52.05% | 4,539 | 2.10% | 183 | 8,720 |
| Shelby | 31.97% | 5,359 | 65.50% | 10,978 | 2.52% | 423 | 16,760 |
| Spencer | 41.39% | 4,026 | 56.69% | 5,515 | 1.92% | 187 | 9,728 |
| St. Joseph | 51.00% | 56,460 | 47.49% | 52,578 | 1.50% | 1,666 | 110,704 |
| Starke | 43.51% | 3,809 | 54.12% | 4,738 | 2.36% | 207 | 8,754 |
| Steuben | 35.44% | 4,853 | 62.41% | 8,547 | 2.15% | 295 | 13,695 |
| Sullivan | 38.49% | 3,191 | 59.13% | 4,902 | 2.38% | 197 | 8,290 |
| Switzerland | 42.30% | 1,437 | 55.11% | 1,872 | 2.59% | 88 | 3,397 |
| Tippecanoe | 46.95% | 26,711 | 50.54% | 28,757 | 2.51% | 1,428 | 56,896 |
| Tipton | 33.02% | 2,432 | 64.81% | 4,773 | 2.17% | 160 | 7,365 |
| Union | 32.84% | 1,018 | 65.23% | 2,022 | 1.94% | 60 | 3,100 |
| Vanderburgh | 43.82% | 31,725 | 54.40% | 39,389 | 1.78% | 1,290 | 72,404 |
| Vermillion | 45.27% | 2,979 | 52.06% | 3,426 | 2.67% | 176 | 6,581 |
| Vigo | 49.43% | 19,712 | 48.57% | 19,369 | 2.00% | 796 | 39,877 |
| Wabash | 30.86% | 3,973 | 67.14% | 8,644 | 2.00% | 257 | 12,874 |
| Warren | 34.84% | 1,324 | 62.55% | 2,377 | 2.61% | 99 | 3,800 |
| Warrick | 35.70% | 8,793 | 62.33% | 15,351 | 1.97% | 486 | 24,630 |
| Washington | 36.41% | 3,909 | 60.85% | 6,533 | 2.75% | 295 | 10,737 |
| Wayne | 41.57% | 10,591 | 56.21% | 14,321 | 2.22% | 565 | 25,477 |
| Wells | 26.56% | 3,436 | 71.56% | 9,256 | 1.88% | 243 | 12,935 |
| White | 36.73% | 3,637 | 60.28% | 5,970 | 2.99% | 296 | 9,903 |
| Whitley | 29.45% | 4,420 | 68.34% | 10,258 | 2.22% | 333 | 15,011 |
Counties that flipped from Democratic to Republican
- Madison (largest city: Anderson)
- Spencer (largest city: Santa Claus)
- Starke (largest city: Knox)
- Tippecanoe (largest city: Lafayette)
- Vanderburgh (largest city: Evansville)
- Vermillion (largest city: Clinton)
See also
- United States presidential elections in Indiana
- 2012 Republican Party presidential debates and forums
- 2012 Republican Party presidential primaries
- Results of the 2012 Republican Party presidential primaries
- 2012 United States Senate election in Indiana
References
- ^ "2012 Presidential Election - Indiana". Politico. Retrieved 22 November 2012.
- ^ GALOFARO, CLAIRE. "The counties that predict presidential election winners didn't this year. Just look at Terre Haute, Indiana". chicagotribune.com. Retrieved 2021-01-22.
- ^ "Hoosiers go for Romney; Obama fails to repeat his narrow win here in '08". The Indianapolis Star. Retrieved November 8, 2012.
- ^ "Primary and Caucus Printable Calendar". CNN. Retrieved January 11, 2012.
- ^ "Presidential Primary Dates" (PDF). Federal Election Commission. Retrieved January 23, 2012.
- ^ Secretary of State election results. June 5, 2012. Retrieved June 27, 2012.
- ^ https://uselectionatlas.org/POLLS/PRESIDENT/2012/polls.php?fips=18
- ^ http://www.uselectionatlas.org/RESULTS/state.php?year=2012&fips=18&f=0&off=0&elect=0&minper=0
- ^ "Analysis: Hoosiers back Republicans but want them in the middle". The Indianapolis Star. Retrieved November 8, 2012.
http://www.indiana.gov/sos/elections/files/2012_Presidential_Elector_Candidate_List.pdf
External links
- The Green Papers: for Indiana
- The Green Papers: Major state elections in chronological order


