
Demographics of the West Midlands County: Difference between revisions
Content deleted Content added
mNo edit summary |
|||
| Line 605: | Line 605: | ||
== References == |
== References == |
||
{{reflist}} |
|||
<references /> |
|||
Revision as of 11:28, 30 June 2024
The Demographics of West Midlands County is analysed by the Office for National Statistics and data is produced for each of its seven metropolitan boroughs and the county overall.

Ethnicity
| Ethnic Group | Year | |||||||||||
|---|---|---|---|---|---|---|---|---|---|---|---|---|
| 1966 estimations[1] | 1971 estimations[2] | 1981 estimations[3] | 1991 census[4] | 2001 census[5] | 2021 census[6] | |||||||
| Number | % | Number | % | Number | % | Number | % | Number | % | Number | % | |
| White: Total | – | – | 2,580,903 | 93.2% | 2,371,072 | 88.7% | 2,237,135 | 85.1% | 2,043,231 | 80% | 1,793,173 | 61.4% |
| White: British | – | – | – | – | – | – | – | – | 1,956,156 | 76.5% | 1,630,823 | 55.9% |
| White: Irish | – | – | – | – | – | – | – | – | 54,011 | 2.1% | 31,490 | 1.1% |
| White: Gypsy or Irish Traveller[a] | – | – | – | – | – | – | – | – | 2417 | |||
| White: Roma | – | – | – | – | – | – | – | – | 4246 | |||
| White: Other | – | – | – | – | – | – | – | – | 33,064 | 1.3% | 124,197 | 4.3% |
| Asian or Asian British: Total | – | – | – | – | 206,289 | 7.7% | 276,162 | 10.5% | 352,288 | 13.8% | 667,315 | 22.9% |
| Asian or Asian British: Indian | – | – | – | – | 118,101 | 4.4% | 148,320 | 5.6% | 157,062 | 6.1% | 226,927 | 7.8% |
| Asian or Asian British: Pakistani | – | – | – | – | 65,985 | 2.5% | 93,426 | 3.6% | 138,007 | 5.4% | 278,837 | 9.6% |
| Asian or Asian British: Bangladeshi | – | – | – | – | 11,006 | 0.4% | 19,131 | 0.7% | 29,085 | 1.1% | 72,168 | 2.5% |
| Asian or Asian British: Chinese[b] | – | – | – | – | 4,543 | 0.2% | 6,119 | 0.2% | 10,548 | 0.4% | 22,718 | 0.8% |
| Asian or Asian British: Other Asian | – | – | – | – | 6,654 | 9,166 | 17,586 | 66,665 | 2.3% | |||
| Black or Black British: Total | – | – | – | – | 80,412 | 3% | 96,384 | 3.7% | 95,234 | 3.7% | 236,047 | 8.1% |
| Black or Black British: African | – | – | – | – | 3,602 | 0.1% | 4,134 | 0.2% | 10,000 | 0.4% | 126,041 | 4.3% |
| Black or Black British: Caribbean | – | – | – | – | 63,597 | 2.4% | 75,612 | 2.9% | 76,386 | 3% | 81,732 | 2.8% |
| Black or Black British: Other Black | – | – | – | – | 13,213 | 16,638 | 0.6% | 8,848 | 0.3% | 28,274 | 1% | |
| Mixed: Total | – | – | – | – | – | – | – | – | 54,757 | 2.1% | 121,685 | 4.2% |
| Mixed: White and Black Caribbean | – | – | – | – | – | – | – | – | 31,525 | 1.2% | 59,903 | 2.1% |
| Mixed: White and Black African | – | – | – | – | – | – | – | – | 2,446 | 9,735 | ||
| Mixed: White and Asian | – | – | – | – | – | – | – | – | 12,641 | 28,872 | ||
| Mixed: Other Mixed | – | – | – | – | – | – | – | – | 8,145 | 23,175 | ||
| Other: Total | – | – | – | – | 15,327 | 0.5% | 19,719 | 0.7% | 10,082 | 0.4% | 101,435 | 3.5% |
| Other: Arab[a] | – | – | – | – | – | – | – | – | – | – | 28,083 | 1% |
| Other: Any other ethnic group | – | – | – | – | – | – | – | – | 10,082 | 0.4% | 73,352 | 2.5% |
| Ethnic minority: Total | 102,850 | – | 188,306 | 6.8% | 302,027 | 11.3% | 392,265 | 14.9% | 512,361 | 20% | 1,126,482 | 38.6% |
| Total | – | 100% | 2,769,209 | 100% | 2,673,099 | 100% | 2,629,400 | 100% | 2,555,592 | 100% | 2,919,655 | 100% |
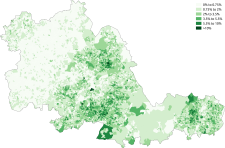
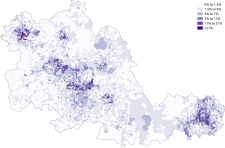
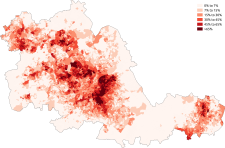
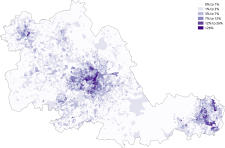
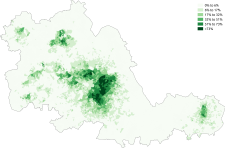
Distribution of ethnic groups in the West Midlands according to the 2011 census.
-
 White
White -
 White-British
 -
 White-Irish
 -
 White-Other
 -
 Asian
Asian -
 Asian-Indian
 -
 Asian-Pakistani
 -
 Asian-Bangladeshi
 -
 Asian-Chinese
 -
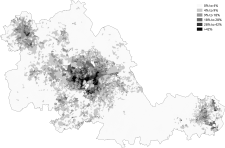 Black
Black -
 Black-African
 -
 Black-Caribbean
 -
 Other-Arab


Country of birth
| Country of birth | 2021[7] | |
|---|---|---|
| Number | % | |
| United Kingdom | 2,286,558 | 78.3% |
| EU Countries | 165,431 | 5.7% |
| Other European | 15,241 | 0.5% |
| Africa | 102,205 | 3.5% |
| Middle East and Asia | 308,122 | 10.6% |
| Caribbean and Americas | 37,477 | 1.3% |
| Oceania | 2,275 | 0.1% |
| British Overseas | 2,340 | 0.1% |
| Overall | 2,919,649 | 100% |
Religion
| Religion | 2001[8] | 2021[9] | ||
|---|---|---|---|---|
| Number | % | Number | % | |
| No religion | 305,365 | 11.9% | 814,372 | 27.9% |
| Christian | 1,701,519 | 66.5% | 1,189,066 | 40.7% |
| Buddhist | 5,817 | 9,380 | ||
| Hindu | 49,484 | 68,376 | ||
| Jewish | 3,310 | 2,559 | ||
| Muslim | 191,559 | 7.5% | 501,480 | 17.2% |
| Sikh | 91,890 | 148,937 | ||
| Other religion | 5,381 | 17,805 | ||
| Not answered | 201,267 | 167,685 | ||
| Total | 2,555,592 | 100% | 2,919,660 | 100% |
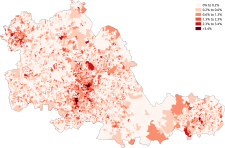
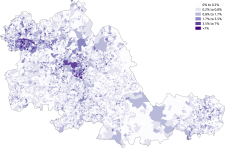
Distribution of religions in the West Midlands according to the 2011 census.
-
 Christianity
 -
 Islam
Islam -
 Judaism
 -
 Hinduism
 -
 Sikhism
 -
 Buddhism
 -
 Other religion
 -
 No religion


Housing
| Tenure | 2001[10] | 2021[11] | ||
|---|---|---|---|---|
| Number | % | Number | % | |
| Owned | 667,665 | 657,680 | ||
| Social renting | 262,163 | 248,490 | ||
| Private renting | 73,373 | 221,929 | ||
| Rent free | 29,743 | 3,661 | ||
| Total | 1,032,944 | 100% | 1,131,760 | |
References
- ^ Patterson, Sheila; Relations, Institute of Race (1969). Immigration and Race Relations in Britain, 1960-1967. Institute of Race Relations. ISBN 978-0-19-218174-9.
- ^ Explaining ethnic differences: Changing patterns of disadvantage in Britain (1 ed.). Bristol University Press. 2003. doi:10.2307/j.ctt1t8915s. JSTOR j.ctt1t8915s.
- ^ Ethnicity in the 1991 census: Vol 3 - Social geography and ethnicity in Britain, geographical spread, spatial concentration and internal migration. Internet Archive. London : HMSO. 1996. ISBN 978-0-11-691655-6.
{{cite book}}: CS1 maint: others (link) - ^ Ethnicity in the 1991 census: Vol 3 - Social geography and ethnicity in Britain, geographical spread, spatial concentration and internal migration. Internet Archive. London : HMSO. 1996. ISBN 978-0-11-691655-6.
{{cite book}}: CS1 maint: others (link) - ^ "KS006 - Ethnic group - Nomis - Official Census and Labour Market Statistics". www.nomisweb.co.uk. Retrieved 2024-06-15.
- ^ "Ethnic group - Office for National Statistics". www.ons.gov.uk. Retrieved 2024-06-15.
- ^ "TS004 - Country of birth - Nomis - Official Census and Labour Market Statistics". www.nomisweb.co.uk. Retrieved 2024-06-30.
- ^ "KS007 - Religion - Nomis - Official Census and Labour Market Statistics". www.nomisweb.co.uk. Retrieved 2024-06-30.
- ^ "TS030 - Religion - Nomis - Official Census and Labour Market Statistics". www.nomisweb.co.uk. Retrieved 2024-06-30.
- ^ "KS018 - Tenure - Nomis - Official Census and Labour Market Statistics". www.nomisweb.co.uk. Retrieved 2024-06-30.
- ^ "TS054 - Tenure - Nomis - Official Census and Labour Market Statistics". www.nomisweb.co.uk. Retrieved 2024-06-30.
Cite error: There are <ref group=lower-alpha> tags or {{efn}} templates on this page, but the references will not show without a {{reflist|group=lower-alpha}} template or {{notelist}} template (see the help page).