Central Scotland: Difference between revisions
Appearance
Content deleted Content added
mNo edit summary |
mNo edit summary |
||
| Line 19: | Line 19: | ||
* [[John Swinburne]] ([[Scottish Senior Citizens Unity Party]]) |
* [[John Swinburne]] ([[Scottish Senior Citizens Unity Party]]) |
||
==Scottish Parliament Vote, 1999== |
===Scottish Parliament Vote, 1999=== |
||
<TABLE BORDER=1 CELLPADDING=3> |
<TABLE BORDER=1 CELLPADDING=3> |
||
| Line 64: | Line 64: | ||
*Lib-Dem - [Donald Gorrie]] |
*Lib-Dem - [Donald Gorrie]] |
||
==Scottish Parliament Vote, 2003== |
===Scottish Parliament Vote, 2003=== |
||
<TABLE BORDER=1 CELLPADDING=3> |
<TABLE BORDER=1 CELLPADDING=3> |
||
Revision as of 11:26, 6 April 2004
Regional Council
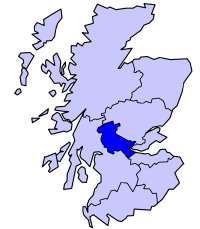
Central was a local government region of Scotland from 1974 to 1995. It is now divided into the council areas of Falkirk, Stirling, and Clackmannanshire, which had previously been distiricts under Central.
Scottish Parliament
Central Scotland is also the name of one of the eight electoral areas for the Scottish Parliament from which the 56 Additional Members System MSPs are elected. It covers a different geographical area from the former Central Region though, stretching from Kilmarnock, through most of Lanarkshire up to Falkirk.
The seven currently sitting MSPs to be elected through the AMS electoral method in Central Scotland are:
- Alex Neil (Scottish National Party)
- Michael Matheson (SNP)
- Linda Fabiani (SNP)
- Margaret Mitchell (Tory)
- Donald Gorrie (Lib-Dem)
- Carolyn Leckie (Scottish Socialist Party)
- John Swinburne (Scottish Senior Citizens Unity Party)
Scottish Parliament Vote, 1999
| Political Party | Votes | Share of Vote (%) | % Change | List Seats Won |
| Labour | ? | 39.28 | K.A. | 0 |
| SNP | ? | 27.78 | K.A. | 5 |
| Tories | ? | 9.15 | K.A. | 1 |
| D Canavan (Independent) | ? | 8.38 | K.A. | 0 |
| Lib-Dems | ? | 6.20 | K.A. | 1 |
| SLP | ? | 3.32 | K.A. | 0 |
| Greens | ? | 1.79 | K.A. | 0 |
| SSP | ? | 1.74 | K.A. | 0 |
| SUP | ? | 0.87 | K.A. | 0 |
| Prolife Alliance | ? | 0.78 | K.A. | 0 |
| Scottish Families and Pensioners Party | ? | 0.42 | K.A. | 0 |
| NLP | ? | 0.22 | K.A. | 0 |
| Independent Progressive | ? | 0.08 | K.A. | 0 |
MSPs Elected:
- SNP - Alex Neil, Andrew Wilson, Michael Matheson, Gil Paterson, Linda Fabiani
- Tory - Lyndsay McIntosh
- Lib-Dem - [Donald Gorrie]]
Scottish Parliament Vote, 2003
| Political Party | Votes | Share of Vote (%) | % Change | List Seats Won |
| Labour | 106,318 | 40.41 | +1.13 | 0 |
| SNP | 59,274 | 22.53 | -5.25 | 3 |
| Tories | 24,121 | 9.17 | +0.02 | 1 |
| SSP | 19,016 | 7.23 | +5.49 | 1 |
| SSCUP | 17,146 | 6.52 | K.A. | 1 |
| Lib-Dems | 15,494 | 5.89 | -0.31 | 1 |
| Greens | 12,248 | 4.66 | +2.87 | 0 |
| SLP | 3,855 | 1.47 | -1.85 | 0 |
| SUP | 2,147 | 0.82 | -0.05 | 0 |
| M Lynch Anderson (Independent) | 1,265 | 0.48 | K.A. | 0 |
| SPA | 1,192 | 0.45 | K.A. | 0 |
| UKIP | 1,009 | 0.38 | K.A. | 0 |

