
Lancashire County Council elections: Difference between revisions
Content deleted Content added
→County result maps: added 2017 map |
→Elections in the 2010s: Added two results as per http://www.lancashire.gov.uk/council/county-councillors-and-elections/elections/by-elections-and-other-changes/ |
||
| Line 607: | Line 607: | ||
{{Election box hold with party link| |
{{Election box hold with party link| |
||
|winner = Labour Party (UK) |
|winner = Labour Party (UK) |
||
|swing = |
|||
}} |
|||
{{Election box end}} |
|||
{{Election box begin | title=Wyre Rural Central by-election, 11 January 2018}} |
|||
{{Election box candidate with party link| |
|||
|party = Conservative Party (UK) |
|||
|candidate = Matthew Salter |
|||
|votes = 1,745 |
|||
|percentage = 60.03 |
|||
|change = -6.11 |
|||
}} |
|||
{{Election box candidate with party link| |
|||
|party = Labour Party (UK) |
|||
|candidate = Nic Fogg |
|||
|votes = 925 |
|||
|percentage = 31.82 |
|||
|change = +11.01 |
|||
}} |
|||
{{Election box candidate with party link| |
|||
|party = Green Party of England and Wales |
|||
|candidate = Susan White |
|||
|votes = 237 |
|||
|percentage = 8.15 |
|||
|change = -4.90 |
|||
}} |
|||
{{Election box majority| |
|||
|votes = 820 |
|||
|percentage = 59.86 |
|||
|change = |
|||
}} |
|||
{{Election box turnout| |
|||
|votes = |
|||
|percentage = |
|||
|change = |
|||
}} |
|||
{{Election box hold with party link| |
|||
|winner = Conservative Party (UK) |
|||
|swing = |
|||
}} |
|||
{{Election box end}} |
|||
{{Election box begin | title=Morecambe North by-election, 15 February 2018}} |
|||
{{Election box candidate with party link| |
|||
|party = Conservative Party (UK) |
|||
|candidate = Stuart Morris |
|||
|votes = 1,332 |
|||
|percentage = 48.95 |
|||
|change = -14.23 |
|||
}} |
|||
{{Election box candidate with party link| |
|||
|party = Liberal Democrats (UK) |
|||
|candidate = Andrew Severn |
|||
|votes = 809 |
|||
|percentage = 29.73 |
|||
|change = +21.58 |
|||
}} |
|||
{{Election box candidate with party link| |
|||
|party = Labour Party (UK) |
|||
|candidate = Darren Clifford |
|||
|votes = 580 |
|||
|percentage = 21.32 |
|||
|change = -0.71 |
|||
}} |
|||
{{Election box majority| |
|||
|votes = 523 |
|||
|percentage = |
|||
|change = |
|||
}} |
|||
{{Election box hold with party link| |
|||
|winner = Conservative Party (UK) |
|||
|swing = |
|swing = |
||
}} |
}} |
||
Revision as of 18:45, 11 March 2018
Elections to Lancashire County Council are elected every four years. All councillors are elected at each election.
Political control
| Party | Period | |
|---|---|---|
| style="background-color: Template:Conservative Party (UK)/meta/color" | | Conservative | 1973–1981 |
| style="background-color: Template:Labour Party (UK)/meta/color" | | Labour | 1981–1985 |
| No overall control | 1985–1989 | |
| style="background-color: Template:Labour Party (UK)/meta/color" | | Labour | 1989–2009 |
| style="background-color: Template:Conservative Party (UK)/meta/color" | | Conservative | 2009–2013 |
| No overall control | 2013-2017 | |
| style="background-color: Template:Conservative Party (UK)/meta/color" | | Conservative | 2017-present |
Council elections
- Lancashire County Council election, 1973
- Lancashire County Council election, 1977
- Lancashire County Council election, 1981
- Lancashire County Council election, 1985
- Lancashire County Council election, 1989
- Lancashire County Council election, 1993
- Lancashire County Council election, 1997
- Lancashire County Council election, 2001
- Lancashire County Council election, 2005
- Lancashire County Council election, 2009
- Lancashire County Council election, 2013
- Lancashire County Council election, 2017
County result maps
-
 2005 results map
 -
 2009 results map
 -
 2013 results map
 -
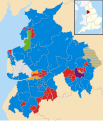 2017 results map


By-election results
Elections in the 1990s
| Party | Candidate | Votes | % | ±% | |
|---|---|---|---|---|---|
| Labour | 2,263 | 53.1 | |||
| Conservative | 2,004 | 46.9 | |||
| Majority | 259 | 6.2 | |||
| Turnout | 4,267 | 37.9 | |||
| Labour hold | Swing | ||||
| Party | Candidate | Votes | % | ±% | |
|---|---|---|---|---|---|
| Labour | 1,644 | 60.4 | −5.3 | ||
| Conservative | 1,076 | 39.6 | +5.3 | ||
| Majority | 568 | 20.8 | |||
| Turnout | 2,720 | 31.1 | |||
| Labour hold | Swing | ||||
| Party | Candidate | Votes | % | ±% | |
|---|---|---|---|---|---|
| Labour | 751 | 38.5 | −11.2 | ||
| Conservative | 636 | 32.6 | −2.2 | ||
| Liberal Democrats | 565 | 28.9 | +13.4 | ||
| Majority | 115 | 5.9 | |||
| Turnout | 1,952 | 17.9 | |||
| Labour hold | Swing | ||||
| Party | Candidate | Votes | % | ±% | |
|---|---|---|---|---|---|
| Labour | 1,358 | 48.6 | −5.8 | ||
| Liberal Democrats | 1,296 | 46.3 | +14.7 | ||
| Conservative | 143 | 5.1 | −8.8 | ||
| Majority | 62 | 2.3 | |||
| Turnout | 2,797 | 29.0 | |||
| Labour hold | Swing | ||||
Elections in the 2000s
| Party | Candidate | Votes | % | ±% | |
|---|---|---|---|---|---|
| Liberal Democrats | 1,721 | 48.5 | −4.8 | ||
| Labour | 1,198 | 33.8 | +3.2 | ||
| Conservative | 627 | 17.7 | +2.1 | ||
| Majority | 523 | 14.7 | |||
| Turnout | 3,546 | 32.0 | |||
| Liberal Democrats hold | Swing | ||||
| Party | Candidate | Votes | % | ±% | |
|---|---|---|---|---|---|
| Conservative | 2,242 | 70.6 | +9.2 | ||
| Labour | 933 | 29.4 | −6.8 | ||
| Majority | 1,309 | 41.2 | |||
| Turnout | 3,175 | 30.4 | |||
| Conservative hold | Swing | ||||
| Party | Candidate | Votes | % | ±% | |
|---|---|---|---|---|---|
| Liberal Democrats | Anthony Pimblett | 1,518 | 48.8 | +13.7 | |
| Conservative | P Wakeling | 1,232 | 39.6 | +4.7 | |
| Labour | D Lyon | 358 | 11.5 | −18.4 | |
| Majority | 286 | 9.2 | |||
| Turnout | 3,108 | ||||
| Liberal Democrats hold | Swing | ||||
| Party | Candidate | Votes | % | ±% | |
|---|---|---|---|---|---|
| Conservative | William Parkinson | 1,781 | 49.8 | +20.1 | |
| Liberal Democrats | Howard Henshaw | 1,205 | 33.7 | −14.8 | |
| Labour | Jean Al-Serraj | 590 | 16.5 | −5.2 | |
| Majority | 576 | 16.1 | |||
| Turnout | 3,576 | 28.2 | |||
| Conservative gain from Liberal Democrats | Swing | ||||
| Party | Candidate | Votes | % | ±% | |
|---|---|---|---|---|---|
| Conservative | Jim Lawrenson | 1,536 | 48.3 | +7.7 | |
| Labour | Wayne Martin | 934 | 29.4 | −6.1 | |
| UKIP | Olive Bergin | 489 | 15.4 | +9.5 | |
| Liberal Democrats | Philip Pitman | 220 | 6.9 | −11.1 | |
| Majority | 602 | 18.9 | |||
| Turnout | 3,175=9 | ||||
| Conservative hold | Swing | ||||
Elections in the 2010s
| Party | Candidate | Votes | % | ±% | |
|---|---|---|---|---|---|
| Labour | Misfar Hassan | 3,157 | 44.35 | +4.75 | |
| Liberal Democrats | Martin Smith | 2,279 | 32.01 | −5.95 | |
| BNP | Paul McDevitt | 868 | 12.19 | +2.14 | |
| Conservative | Matthew Isherwood | 815 | 11.45 | −0.94 | |
| Majority | 878 | 12.3 | |||
| Turnout | |||||
| Labour gain from Liberal Democrats | Swing | ||||
| Party | Candidate | Votes | % | ±% | |
|---|---|---|---|---|---|
| Conservative | Vivien Taylor | 2,178 | 58.00 | −7.86 | |
| Labour | Kevin Higginson | 877 | 23.36 | +10.30 | |
| UKIP | Simon Noble | 361 | 9.61 | K.A. | |
| Green | Susan White | 339 | 9.03 | −12.06 | |
| Majority | 1,301 | ||||
| Turnout | 3,762 | ||||
| Conservative hold | Swing | ||||
| Party | Candidate | Votes | % | ±% | |
|---|---|---|---|---|---|
| Labour | Lizzi Collinge | 1,758 | 50.85 | +5.95 | |
| Green | Tim Hamilton-Cox | 1,408 | 40.73 | −0.27 | |
| Liberal Democrats | Robin Long | 231 | 6.68 | K.A. | |
| TUSC | Steve Metcalfe | 60 | 1.74 | K.A. | |
| Majority | 350 | 10.1 | |||
| Turnout | |||||
| Labour hold | Swing | ||||
| Party | Candidate | Votes | % | ±% | |
|---|---|---|---|---|---|
| Conservative | Alan Cullens | 1,144 | 43.76 | +2.65 | |
| Labour | Yvonne Hargreaves | 1,042 | 38.37 | +0.57 | |
| UKIP | Christopher Stuart | 303 | 11.16 | −6.15 | |
| Liberal Democrats | Stephen Fenn | 125 | 4.60 | +0.83 | |
| Majority | 102 | 3.9 | |||
| Turnout | |||||
| Conservative hold | Swing | ||||
| Party | Candidate | Votes | % | ±% | |
|---|---|---|---|---|---|
| Labour | Sobia Malik | 1,348 | 68.88 | +10.74 | |
| Liberal Democrats | Emma Payne | 276 | 14.10 | −1.42 | |
| UKIP | Mark Girven | 249 | 12.72 | −6.68 | |
| Green | Laura Fisk | 84 | 4.29 | K.A. | |
| Majority | 1,072 | ||||
| Turnout | |||||
| Labour hold | Swing | ||||
| Party | Candidate | Votes | % | ±% | |
|---|---|---|---|---|---|
| Conservative | Matthew Salter | 1,745 | 60.03 | −6.11 | |
| Labour | Nic Fogg | 925 | 31.82 | +11.01 | |
| Green | Susan White | 237 | 8.15 | −4.90 | |
| Majority | 820 | 59.86 | |||
| Turnout | |||||
| Conservative hold | Swing | ||||
| Party | Candidate | Votes | % | ±% | |
|---|---|---|---|---|---|
| Conservative | Stuart Morris | 1,332 | 48.95 | −14.23 | |
| Liberal Democrats | Andrew Severn | 809 | 29.73 | +21.58 | |
| Labour | Darren Clifford | 580 | 21.32 | −0.71 | |
| Majority | 523 | ||||
| Conservative hold | Swing | ||||