
List of metropolitan areas in the Americas
(Redirected from List of the largest metropolitan areas in the Americas)

The list of metropolitan areas in the Americas has the top 50 most populous as of the most recent census results or projections. It is impossible to definitively compare and rank areas because each country may set its own definition of metropolitan area. Where available, it uses official definitions of metropolitan areas based on one urban core and immediate surroundings, as opposed to polycentric conurbations. Population data are the most recent census results or projections from the authoritative national agency responsible for demographics.
List
[edit]Gallery
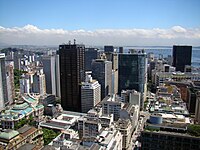
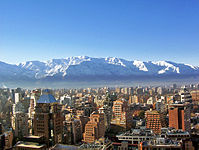
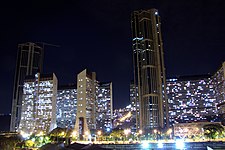
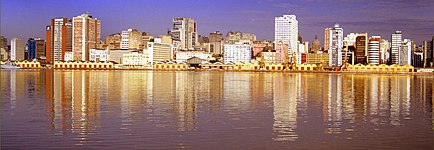
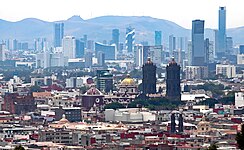
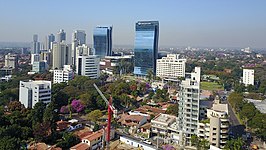
[edit]- Largest metropolitan areas in the Americas
-

-

-

-

-

-
-

-

-

-

-

-

-

-

-
-

-

-

-

-

-
-

-

-

-

-

-
-

-

-
-
-

-

-

-
 Santo Domingo
 -

-

-

-

-

-
-
-

-

-

-

-
-

-


.jpg)


.jpg)


.jpg)


Notes
[edit]- ^ INDEC defines Greater Buenos Aires as comprising the Autonomous City of Buenos Aires plus 24 partidos of Buenos Aires Province, namely Almirante Brown, Avellaneda, Berazategui, Esteban Echeverría, Ezeiza, Florencio Varela, Hurlingham, Ituzaingó, José C. Paz, La Matanza, Lanús, Lomas de Zamora, Malvinas Argentinas, Merlo, Moreno, Morón, Quilmes, San Fernando, San Isidro, San Miguel, Tigre and Vicente López.[4]
- ^ DANE defines the metropolitan area of Bogotá as comprising the Capital District and 17 municipalities in Cundinamarca: Soacha, Facatativá, Zipaquirá, Chía, Mosquera, Madrid, Funza, Cajicá, Sibaté, Tocancipá, La Calera, Sopó, Tabio, Tenjo, Cota, Gachancipá and Bojacá.[8]
- ^ INEI defines the Lima Metropolitan Area as comprising Lima Province and the Constitutional Province of Callao.[10]
References
[edit]- ^ a b c d e f g h i "Censo do IBGE : consulte a população atualizada por cidade". Exame (in Brazilian Portuguese). 2022.
- ^ a b c d e "Censo de Población y Vivienda 2020 - SCITEL" (in Spanish). Retrieved 2021-01-26.
- ^ a b c d e f g h i j k l m n o p q r Bureau, U. S. Census. "Metropolitan and Micropolitan Statistical Areas Population Totals: 2020-2023". United States Census Bureau. Retrieved 2024-04-30.
- ^ ¿Qué es el Gran Buenos Aires? (PDF) (Report). INDEC. 2005. Archived from the original (PDF) on 2017-10-23. Retrieved 2016-04-25.
- ^ "Población estimada al 1 de julio de cada año calendario por sexo, según comuna. Ciudad Autónoma de Buenos Aires. Años 2010-2025". INDEC. Archived from the original on 2015-06-12. Retrieved 2016-04-23.
- ^ "Población estimada al 1 de julio de cada año calendario por sexo, según partido. Provincia de Buenos Aires. Años 2010-2025". INDEC. Archived from the original on 2015-09-24. Retrieved 2016-04-23.
- ^ "IBGE releases population estimates of the municipalities in 2015". IBGE. 2015-08-25. Retrieved 2016-04-25.
- ^ "Censo 2005" (PDF). DANE. Retrieved 2016-04-25.
- ^ a b c "ESTIMACIONES DE POBLACIÓN 1985 - 2005 Y PROYECCIONES DE POBLACIÓN 2005 - 2020 TOTAL MUNICIPAL POR ÁREA". DANE. 2011-05-12. Retrieved 2016-04-25.
- ^ "PERÚ: LISTADO DE DISTRITOS QUE CONFORMAN LAS CIUDADES PRINCIPALES, SEGÚN DEPARTAMENTO". Perú: Estimaciones y Proyecciones de Población total y edades quinquenales, según Departamento, Provincia y Distrito, 2005-2015. INEI. November 2010. Retrieved 2016-04-23.
- ^ "Cuadro Nº 11. Perú: Población total al 30 de junio, por grupos quinquenales de edad, según departamento y provincia, 2015". Perú: Estimaciones y Proyecciones de Población total y edades quinquenales, según Departamento, Provincia y Distrito, 2005-2015. INEI. November 2010. Retrieved 2016-04-23.
- ^ a b "Annual demographic estimates by census metropolitan area, age and sex, based on the Standard Geographical Classification (SGC) 2011". Statistics Canada. 2018-02-13. Retrieved 2018-12-10.
- ^ "Censo de Población y Vivienda". Default. Retrieved 2023-11-27.
- ^ World Agglomerations Retrieved on May 24, 2009.
- ^ Bureau, US Census. "Metropolitan and Micropolitan Statistical Areas Population Totals: 2020-2022". Census.gov. Retrieved 2023-11-27.
- ^ [1]Archived November 14, 2009, at the Wayback Machine
- ^ "Proyección de la población al 30 de junio con base al censo 2011, según entidad federal y municipios, 2000-2050". Instituto Nacional de Estadística. Retrieved 2016-04-23.
- ^ "Informe básico XCPV". Retrieved 1 February 2024.
- ^ "X Censo Nacional de Población y VI de Vivienda 2011: Resultados Generales" [10th National Population Census and 6th Housing Census 2011: General Results] (PDF). Archived from the original (PDF) on 2012-10-21. Retrieved 2012-09-27.
- ^ Macrotrends Metro Area Estimate 2024
- ^ "Proyección de la Población Ecuatoriana, por años calenario, según cantones 2010-2020". Instituto Nacional de Estadística y Censos. Retrieved 2016-04-23.
- ^ POPULATION TOTALE, DE 18 ANS ET PLUS MENAGES ET DENSITES ESTIMES EN 2015 (PDF) (Report). Institut Haïtien de Statistique et d’Informatique (IHSI). March 2015. p. 23. Archived from the original (PDF) on 2015-11-06. Retrieved 2015-04-25.
- ^ Citypopulation.de Population and area of Quito
| City proper | |
|---|---|
| Metropolitan area | |
| Urban area/agglomeration | |
| Historical | |
| Related articles | |