利用者:紅い目の女の子/F値 (精度)
記事名 F値 (評価指標)F値 (精度指標)F値 (精度) 統計学レベルだと、F検定のF値と被る

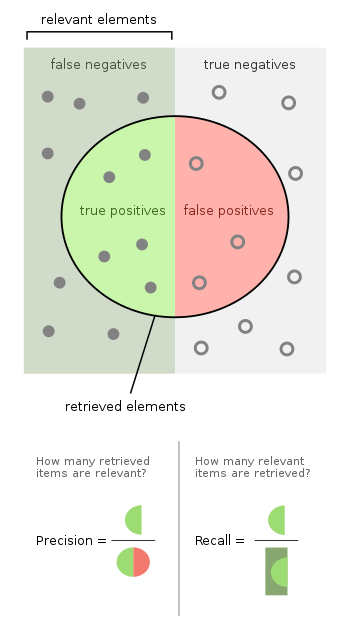
F値(えふち、英:F-measure, F-score)は、二項分類の統計解析において精度を測る指標の一つである。F値は適合率と再現率から計算される。適合率とは陽性と予測したもののうち(この中には正しく予測できていないものも含まれる)実際に正しく予測できたものの割合で、再現率は全ての陽性のうち実際に陽性であると予測できたものの割合である。適合率は陽性的中率(Positive predict value, PPV)とも、再現率は感度(sensitivity)と呼ばれることもある。
F1スコア(F1)は適合率と再現率の調和平均で計算される。より一般的なF値も考えることができて、重み付けF値(Weighted F-score)は適合率または再現率に何らかの重みをかけた上で調和平均をとって算出する。
F値が取りうる最大値は1.0であり、これは適合率と再現率がともに1.0(=100%)の場合である。逆にF値がとりうる最小値は0で、このとき適合率と再現率の少なくともいずれかは0である。F1スコアは Sørensen–Dice coefficient や Dice similarity coefficient (DSC)としても知られる[要出典]。
名称
編集F値という名称は The name F-measure is believed to be named after a different F function in Van Rijsbergen's book, when introduced to the Fourth Message Understanding Conference (MUC-4, 1992).[1]
定義
編集F値は通常、適合率と再現率の調和平均として定義される。 The traditional F-measure or balanced F-score (F1 score) is the harmonic mean of precision and recall:
- .
F値は、実整数係数βを用いてより一般化して定義できる。ここでβは、適合率と比較して再現率を何倍重視するかを表す係数である。
- .
In terms of Type I and type II errors this becomes:
- .
特に再現率をより重視する目的でβ=2、適合率をより重視する目的でβ=0.5としたものがよく使われる。
The F-measure was derived so that "measures the effectiveness of retrieval with respect to a user who attaches β times as much importance to recall as precision".[2] It is based on Van Rijsbergen's effectiveness measure
- .
Their relationship is where .
Diagnostic testing
編集This is related to the field of binary classification where recall is often termed "sensitivity". Template:Diagnostic testing diagram
Dependence of the F-score on class imbalance
編集Williams[3] has shown the explicit dependence of the precision-recall curve, and thus the score, on the ratio of positive to negative test cases. This means that comparison of the F-score across different problems with differing class ratios is problematic. One way to address this issue (see e.g., Siblini et al, 2020[4] ) is to use a standard class ratio when making such comparisons.
応用
編集The F-score is often used in the field of information retrieval for measuring search, document classification, and query classification performance.[5] Earlier works focused primarily on the F1 score, but with the proliferation of large scale search engines, performance goals changed to place more emphasis on either precision or recall[6] and so is seen in wide application.
The F-score is also used in machine learning.[7] However, the F-measures do not take true negatives into account, hence measures such as the Matthews correlation coefficient, Informedness or Cohen's kappa may be preferred to assess the performance of a binary classifier.[8]
The F-score has been widely used in the natural language processing literature,[9] such as in the evaluation of named entity recognition and word segmentation.
Criticism
編集David Hand and others criticize the widespread use of the F1 score since it gives equal importance to precision and recall. In practice, different types of mis-classifications incur different costs. In other words, the relative importance of precision and recall is an aspect of the problem.[10]
According to Davide Chicco and Giuseppe Jurman, the F1 score is less truthful and informative than the Matthews correlation coefficient (MCC) in binary evaluation classification.[11]
David Powers has pointed out that F1 ignores the True Negatives and thus is misleading for unbalanced classes, while kappa and correlation measures are symmetric and assess both directions of predictability - the classifier predicting the true class and the true class predicting the classifier prediction, proposing separate multiclass measures Informedness and Markedness for the two directions, noting that their geometric mean is correlation.[12]
Difference from Fowlkes–Mallows index
編集While the F-measure is the harmonic mean of recall and precision, the Fowlkes–Mallows index is their geometric mean.[13]
Extension to multi-class classification
編集The F-score is also used for evaluating classification problems with more than two classes (Multiclass classification). In this setup, the final score is obtained by micro-averaging (biased by class frequency) or macro-averaging (taking all classes as equally important). For macro-averaging, two different formulas have been used by applicants: the F-score of (arithmetic) class-wise precision and recall means or the arithmetic mean of class-wise F-scores, where the latter exhibits more desirable properties.[14]
See also
編集References
編集- ^ Sasaki, Y. (2007年). “The truth of the F-measure”
- ^ Van Rijsbergen, C. J. (1979). Information Retrieval (2nd ed.). Butterworth-Heinemann
- ^ Williams, Christopher K. I. (2021). “The Effect of Class Imbalance on Precision-Recall Curves”. Neural Computation 33 (4): 853–857. doi:10.1162/neco_a_01362.
- ^ Siblini, W.; Fréry, J.; He-Guelton, L.; Oblé, F.; Wang, Y. Q. (2020). "Master your metrics with calibration". In M. Berthold; A. Feelders; G. Krempl (eds.). Advances in Intelligent Data Analysis XVIII. Springer. pp. 457–469. arXiv:1909.02827. doi:10.1007/978-3-030-44584-3_36。
- ^ Beitzel., Steven M. (2006). On Understanding and Classifying Web Queries (Ph.D. thesis). IIT. CiteSeerX 10.1.1.127.634。
- ^ X. Li; Y.-Y. Wang; A. Acero (July 2008). Learning query intent from regularized click graphs. Proceedings of the 31st SIGIR Conference. doi:10.1145/1390334.1390393. S2CID 8482989。
- ^ See, e.g., the evaluation of the [1].
- ^ Powers, David M. W (2015). "What the F-measure doesn't measure". arXiv:1503.06410 [cs.IR]。
- ^ Derczynski, L. (2016). Complementarity, F-score, and NLP Evaluation. Proceedings of the International Conference on Language Resources and Evaluation.
- ^ Hand, David (英語). A note on using the F-measure for evaluating record linkage algorithms - Dimensions. doi:10.1007/s11222-017-9746-6. hdl:10044/1/46235 2018年12月8日閲覧。.
- ^ “The advantages of the Matthews correlation coefficient (MCC) over F1 score and accuracy in binary classification evaluation”. BMC Genomics 21 (6): 6. (January 2020). doi:10.1186/s12864-019-6413-7. PMC 6941312. PMID 31898477.
- ^ Powers, David M W (2011). “Evaluation: From Precision, Recall and F-Score to ROC, Informedness, Markedness & Correlation”. Journal of Machine Learning Technologies 2 (1): 37–63. hdl:2328/27165.
- ^ “Classification assessment methods”. Applied Computing and Informatics (ahead-of-print). (August 2018). doi:10.1016/j.aci.2018.08.003.
- ^ J. Opitz; S. Burst (2019). "Macro F1 and Macro F1". arXiv:1911.03347 [stat.ML]。