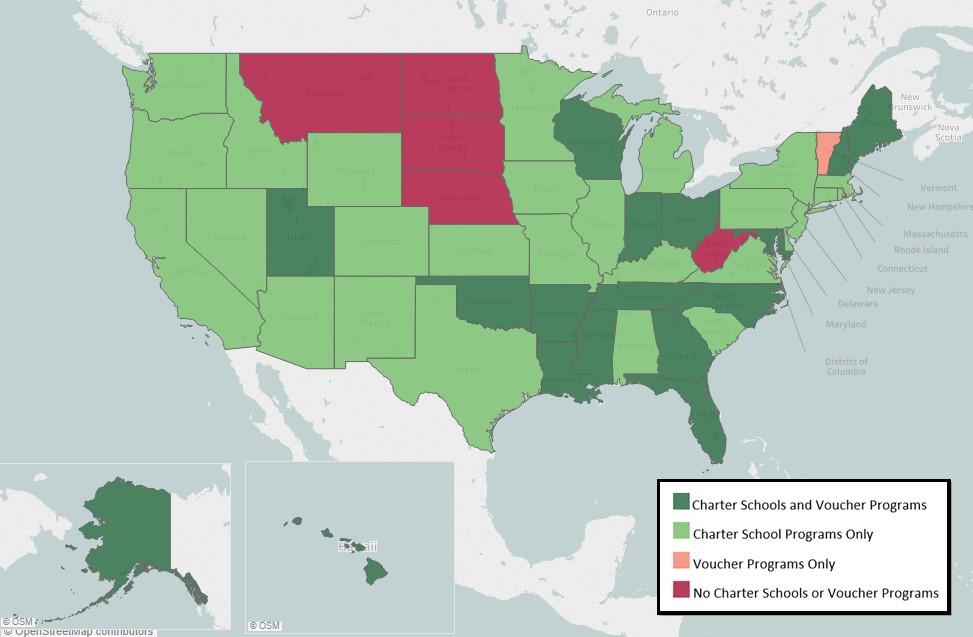
How does my state perform in education? What are some of its policies?
Reference the “color codes” to determine how much Education Freedom your state supports. In spring 2020, this image will become an interactive map. You will be able to hover the cursor over your state on the map to discover how well your state performed on the National Assessment of Educational Progress (NAEP) in 4th grade literacy and 8th grade math, compared to the other states. You will also find what percent of students graduate from high school and what percent of teachers are considered “inexperienced” in your state (if available). Clicking on your state will forward you the respective State Report Card website.
* Based on the most currently available data
| NAEP 4th Grade Reading Placement | NAEP 8th Grade Math Placement | High School Graduation Rate | Percent of Inexperienced Teachers[1] | |
| Alabama | 48th | 49th | 90.00% | 16.78% |
| Alaska | 51st | 43rd | 78.51% | 7.00% |
| Arizona | 40th | 27th | 78.36% | 20.97% |
| Arkansas | 45th | 43rd | 87.55% | 17.60% |
| California | 40th | 38th | 83.00% | 11.57% |
| Colorado | 4th | 16th | 79.00% | 25.60% |
| Connecticut | 7th | 9th | 88.30% | 22.81% |
| Delaware | 32nd | 37th | 86.69% | 18.45% |
| District of Columbia | 46th | 49th | 68.18% | 9.00% |
| Florida | 4th | 34th | 86.10% | 27.30% |
| Georgia | 32nd | 34th | 82.00% | 29.00% |
| Hawaii | 32nd | 42nd | 84.80% | 9.00% |
| Idaho | 10th | 9th | 80.60% | 23.00% |
| Illinois | 32nd | 22nd | 86.00% | 5.80% |
| Indiana | 12th | 9th | 88.10% | 28.00% |
| Iowa | 19th | 23rd | 90.98% | |
| Kansas | 29th | 23rd | 87.50% | 16.00% |
| Kentucky | 19th | 36th | 91.10% | 13.25% |
| Louisiana | 49th | 47th | 81.00% | 20.36% |
| Maine | 19th | 23rd | 86.70% | 13.00% |
| Maryland | 24th | 27th | 87.12% | 16.55% |
| Massachusetts | 1st | 1st | 87.90% | 18.30% |
| Michigan | 32nd | 27th | 80.64% | 15.90% |
| Minnesota | 12th | 3rd | 83.20% | 14.77% |
| Mississippi | 29th | 43rd | 84.00% | 22.30% |
| Missouri | 32nd | 26th | 89.64% | 6.17% |
| Montana | 12th | 20th | 86.00% | 3.00% |
| Nebraska | 12th | 16th | 88.00% | 21.80% |
| Nevada | 32nd | 43rd | 83.16% | |
| New Hampshire | 7th | 5th | 88.81% | 14.50% |
| New Jersey | 2nd | 2nd | 90.90% | 24.50% |
| New Mexico | 50th | 49th | 73.90% | |
| New York | 24th | 27th | 80.40% | 16.00% |
| North Carolina | 19th | 20th | 86.30% | 24.90% |
| North Dakota | 19th | 9th | 88.00% | |
| Ohio | 12th | 9th | 85.30% | 7.86% |
| Oklahoma | 40th | 38th | 83.10% | |
| Oregon | 32nd | 27th | 79.10% | 25.80% |
| Pennsylvania | 10th | 16th | 86.57% | |
| Rhode Island | 24th | 38th | 84.00% | 16.52% |
| South Carolina | 40th | 38th | 81.10% | 13.80% |
| South Dakota | 12th | 5th | 84.00% | 14.00% |
| Tennessee | 29th | 27th | 89.10% | |
| Texas | 40th | 27th | 90.00% | 14.20% |
| Utah | 4th | 16th | 87.00% | |
| Vermont | 12th | 5th | 89.10% | |
| Virginia | 7th | 5th | 91.50% | 5.20% |
| Washington | 24th | 9th | 80.90% | 27.30% |
| West Virginia | 47th | 47th | 90.16% | 18.62% |
| Wisconsin | 24th | 4th | 90.80% | 24.26% |
| Wyoming | 2nd | 9th | 81.70% | 12.24% |
[1] As available on respective State Report Card. Each state determines what “inexperienced” means. Some states define inexperienced as “less than one year in the classroom” while others define it as less than 3-to-5 years of experience.