Wikimedia Traffic Analysis Report - Wikipedia Page Edits Per Country - Overview
Monthly requests or daily averages, for period: 1 Jul 2009 - 30 Sep 2013 (last 12 months)
|
|
This analysis is based on a 1:1000 sampled server log (squids)Unresolved Bugzilla bugs: 55443
Recently resolved bugs: 46205 (Aug 2013)
Page Views Per Country - Overview / Breakdown / Trends, Page Views Per Wikipedia Language - Breakdown
Page Edits Per Country - Overview / Breakdown / Trends, Page Edits Per Wikipedia Language - Breakdown
, and notes about reliability of these data
Portal is www.wikipedia.org
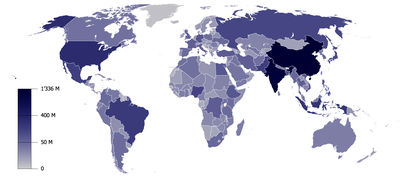
| Location | Population
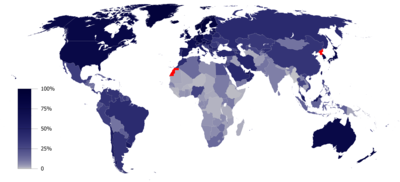
absolute count and percentage of world population | Internet
Users
absolute count and percentage of country population | Monthly Page Edits |
| Country | Region
 | N/S | absolute count and monthly Page Editss per internet user | share of global total note:blue and red bars have different scale |
| | | | | | | | | | |
|---|
| All countries in | World | | 7040 M | 100% | 2485 M | 35% | 5.5 M | 0.0022 | 100% | |
|---|
| |
| All countries in | Global North | | 1296 M | 18.4% | 949 M | 73% | 4.3 M | 0.0045 | 78.3% |  |
|---|
| All countries in | Global South | | 5744 M | 81.6% | 1536 M | 27% | 1.2 M | 0.0008 | 21.7% | |
|---|
| |
| All countries in | Africa | | 1072 M | 15.2% | 201 M | 19% | 50 K | 0.0003 | 0.9% | |
|---|
| All countries in | Asia | | 4234 M | 60.1% | 1216 M | 29% | 1.0 M | 0.0009 | 19.0% | |
|---|
| All countries in | Europe | | 738 M | 10.5% | 501 M | 68% | 2.9 M | 0.0058 | 52.8% | |
|---|
| All countries in | Central-America | | 85 M | 1.2% | 23 M | 27% | 26 K | 0.0011 | 0.5% | |
|---|
| All countries in | North-America | | 471 M | 6.7% | 328 M | 70% | 1.0 M | 0.0032 | 18.9% | |
|---|
| All countries in | South-America | | 402 M | 5.7% | 192 M | 48% | 326 K | 0.0017 | 5.9% | |
|---|
| All countries in | Oceania | | 38 M | 0.5% | 23 M | 61% | 108 K | 0.0047 | 2.0% | |
|---|
| Remainder | Unknown | | | | | | 2 K | | 0.04% | |
|---|
| |
United States  | North-America | N | 317 M | 4.5% | 254 M | 80% | 831 K | 0.0033 | 15.1% |  |
|---|
Germany  | Europe | N | 81 M | 1.1% | 68 M | 85% | 408 K | 0.0060 | 7.4% | |
|---|
France  | Europe | N | 66 M | 0.9% | 54 M | 83% | 343 K | 0.0063 | 6.2% | |
|---|
United Kingdom  | Europe | N | 64 M | 0.9% | 55 M | 86% | 343 K | 0.0062 | 6.2% | |
|---|
Italy  | Europe | N | 60 M | 0.8% | 36 M | 59% | 310 K | 0.0087 | 5.6% | |
|---|
Russia  | Europe | N | 144 M | 2.0% | 76 M | 53% | 285 K | 0.0038 | 5.2% | |
|---|
Japan  | Asia | N | 127 M | 1.8% | 101 M | 79% | 236 K | 0.0023 | 4.3% | |
|---|
Spain  | Europe | N | 47 M | 0.7% | 34 M | 73% | 189 K | 0.0056 | 3.4% | |
|---|
Canada  | North-America | N | 35 M | 0.5% | 30 M | 85% | 154 K | 0.0052 | 2.8% | |
|---|
Brazil  | South-America | S | 201 M | 2.9% | 99 M | 49% | 133 K | 0.0013 | 2.4% | |
|---|
India  | Asia | S | 1235 M | 17.5% | 152 M | 12% | 128 K | 0.0008 | 2.3% | |
|---|
Poland  | Europe | N | 39 M | 0.5% | 25 M | 65% | 114 K | 0.0045 | 2.1% | |
|---|
Netherlands  | Europe | N | 17 M | 0.2% | 16 M | 93% | 107 K | 0.0069 | 1.9% | |
|---|
Ukraine  | Europe | N | 45 M | 0.6% | 15 M | 33% | 101 K | 0.0067 | 1.8% | |
|---|
Australia  | Oceania | N | 23 M | 0.3% | 18 M | 78% | 89 K | 0.0049 | 1.6% | |
|---|
Sweden  | Europe | N | 9.6 M | 0.1% | 8.6 M | 89% | 72 K | 0.0084 | 1.3% | |
|---|
South Korea  | Asia | N | 50 M | 0.7% | 41 M | 82% | 71 K | 0.0017 | 1.3% | |
|---|
Taiwan  | Asia | S | 23 M | 0.3% | 18 M | 76% | 65 K | 0.0037 | 1.2% | |
|---|
Argentina  | South-America | S | 40 M | 0.6% | 24 M | 59% | 58 K | 0.0025 | 1.1% | |
|---|
Belgium  | Europe | N | 11 M | 0.2% | 8.6 M | 77% | 58 K | 0.0068 | 1.1% | |
|---|
Israel  | Asia | S | 8.1 M | 0.1% | 5.6 M | 69% | 58 K | 0.0104 | 1.1% | |
|---|
Mexico  | North-America | S | 118 M | 1.7% | 44 M | 37% | 54 K | 0.0012 | 1.0% | |
|---|
Turkey  | Asia | S | 76 M | 1.1% | 36 M | 48% | 54 K | 0.0015 | 1.0% | |
|---|
Hong Kong  | Asia | S | 7.2 M | 0.1% | 5.2 M | 73% | 50 K | 0.0095 | 0.9% | |
|---|
Czech Republic  | Europe | N | 11 M | 0.1% | 7.6 M | 73% | 48 K | 0.0063 | 0.9% | |
|---|
Hungary  | Europe | N | 9.9 M | 0.1% | 7.2 M | 72% | 47 K | 0.0065 | 0.8% | |
|---|
China  | Asia | S | 1360 M | 19.3% | 568 M | 42% | 46 K | 0.0001 | 0.8% | |
|---|
Norway  | Europe | N | 5.1 M | 0.07% | 4.5 M | 88% | 46 K | 0.0102 | 0.8% | |
|---|
Finland  | Europe | N | 5.4 M | 0.08% | 4.8 M | 88% | 45 K | 0.0094 | 0.8% | |
|---|
Indonesia  | Asia | S | 238 M | 3.4% | 38 M | 16% | 43 K | 0.0011 | 0.8% | |
|---|
Switzerland  | Europe | N | 8.1 M | 0.1% | 6.8 M | 84% | 39 K | 0.0058 | 0.7% | |
|---|
Chile  | South-America | S | 17 M | 0.2% | 10 M | 63% | 38 K | 0.0036 | 0.7% | |
|---|
Iran  | Asia | S | 77 M | 1.1% | 21 M | 27% | 37 K | 0.0018 | 0.7% | |
|---|
Colombia  | South-America | S | 47 M | 0.7% | 22 M | 47% | 35 K | 0.0016 | 0.6% | |
|---|
Greece  | Europe | N | 11 M | 0.2% | 6.0 M | 56% | 35 K | 0.0058 | 0.6% | |
|---|
Thailand  | Asia | S | 66 M | 0.9% | 18 M | 27% | 35 K | 0.0019 | 0.6% | |
|---|
Philippines  | Asia | S | 98 M | 1.4% | 38 M | 38% | 35 K | 0.0009 | 0.6% | |
|---|
Austria  | Europe | N | 8.5 M | 0.1% | 6.7 M | 79% | 33 K | 0.0050 | 0.6% | |
|---|
Serbia  | Europe | N | 7.2 M | 0.1% | 3.5 M | 49% | 29 K | 0.0082 | 0.5% | |
|---|
Bulgaria  | Europe | N | 7.3 M | 0.1% | 3.9 M | 53% | 28 K | 0.0072 | 0.5% | |
|---|
Portugal  | Europe | N | 11 M | 0.2% | 6.9 M | 65% | 27 K | 0.0040 | 0.5% | |
|---|
Malaysia  | Asia | S | 30 M | 0.4% | 19 M | 64% | 24 K | 0.0013 | 0.4% | |
|---|
Ireland  | Europe | N | 4.6 M | 0.07% | 3.7 M | 81% | 24 K | 0.0063 | 0.4% | |
|---|
Denmark  | Europe | N | 5.6 M | 0.08% | 5.2 M | 92% | 22 K | 0.0043 | 0.4% | |
|---|
Romania  | Europe | N | 20 M | 0.3% | 11 M | 54% | 21 K | 0.0019 | 0.4% | |
|---|
Vietnam  | Asia | S | 89 M | 1.3% | 36 M | 41% | 20 K | 0.0005 | 0.4% | |
|---|
Peru  | South-America | S | 30 M | 0.4% | 11 M | 37% | 20 K | 0.0017 | 0.4% | |
|---|
New Zealand  | Oceania | N | 4.5 M | 0.06% | 3.9 M | 87% | 18 K | 0.0047 | 0.3% | |
|---|
Saudi Arabia  | Asia | S | 29 M | 0.4% | 14 M | 49% | 17 K | 0.0012 | 0.3% | |
|---|
Egypt  | Africa | S | 84 M | 1.2% | 37 M | 44% | 15 K | 0.0004 | 0.3% | |
|---|
Estonia  | Europe | N | 1.3 M | 0.02% | 1.0 M | 78% | 15 K | 0.0151 | 0.3% | |
|---|
Croatia  | Europe | N | 4.3 M | 0.06% | 2.8 M | 66% | 15 K | 0.0053 | 0.3% | |
|---|
Pakistan  | Asia | S | 184 M | 2.6% | 19 M | 10% | 15 K | 0.0008 | 0.3% | |
|---|
Venezuela  | South-America | S | 29 M | 0.4% | 12 M | 43% | 15 K | 0.0012 | 0.3% | |
|---|
Belarus  | Europe | N | 9.5 M | 0.1% | 4.5 M | 48% | 15 K | 0.0033 | 0.3% | |
|---|
Azerbaijan  | Asia | S | 9.2 M | 0.1% | 5.1 M | 56% | 14 K | 0.0027 | 0.3% | |
|---|
Kazakhstan  | Asia | S | 17 M | 0.2% | 9.3 M | 55% | 13 K | 0.0014 | 0.2% | |
|---|
Uruguay  | South-America | S | 3.3 M | 0.05% | 1.8 M | 56% | 13 K | 0.0072 | 0.2% | |
|---|
Slovakia  | Europe | N | 5.4 M | 0.08% | 4.4 M | 81% | 12 K | 0.0028 | 0.2% | |
|---|
Slovenia  | Europe | N | 2.1 M | 0.03% | 1.4 M | 68% | 10 K | 0.0074 | 0.2% | |
|---|
Latvia  | Europe | N | 2.0 M | 0.03% | 1.6 M | 81% | 10 K | 0.0063 | 0.2% | |
|---|
South Africa  | Africa | S | 53 M | 0.8% | 20 M | 38% | 10 K | 0.0005 | 0.2% | |
|---|
Lithuania  | Europe | N | 3.0 M | 0.04% | 2.4 M | 81% | 10 K | 0.0040 | 0.2% | |
|---|
Georgia  | Asia | S | 4.5 M | 0.06% | 2.1 M | 46% | 9 K | 0.0043 | 0.2% | |
|---|
Singapore  | Asia | S | 5.4 M | 0.08% | 4.0 M | 74% | 9 K | 0.0022 | 0.2% | |
|---|
Bosnia and Herzegovina  | Europe | N | 3.8 M | 0.05% | 2.5 M | 66% | 8 K | 0.0032 | 0.1% | |
|---|
Armenia  | Asia | S | 3.0 M | 0.04% | 1.2 M | 38% | 8 K | 0.0068 | 0.1% | |
|---|
Bangladesh  | Asia | S | 153 M | 2.2% | 10 M | 7% | 8 K | 0.0007 | 0.1% | |
|---|
Ecuador  | South-America | S | 16 M | 0.2% | 5.3 M | 34% | 7 K | 0.0014 | 0.1% | |
|---|
United Arab Emirates  | Asia | S | 8.3 M | 0.1% | 4.5 M | 55% | 7 K | 0.0016 | 0.1% | |
|---|
Macedonia  | Europe | N | 2.1 M | 0.03% | 1.3 M | 64% | 7 K | 0.0053 | 0.1% | |
|---|
Algeria  | Africa | S | 38 M | 0.5% | 5.7 M | 15% | 6 K | 0.0010 | 0.1% | |
|---|
Sri Lanka  | Asia | S | 20 M | 0.3% | 3.9 M | 19% | 5 K | 0.0014 | 0.10% | |
|---|
Morocco  | Africa | S | 33 M | 0.5% | 18 M | 54% | 5 K | 0.0003 | 0.10% | |
|---|
Costa Rica  | Central-America | S | 4.7 M | 0.07% | 2.2 M | 47% | 4 K | 0.0020 | 0.08% | |
|---|
Kuwait  | Asia | S | 3.6 M | 0.05% | 2.1 M | 58% | 4 K | 0.0021 | 0.08% | |
|---|
Puerto Rico  | Central-America | S | 3.7 M | 0.05% | 1.9 M | 52% | 4 K | 0.0021 | 0.07% | |
|---|
Moldova  | Europe | N | 3.6 M | 0.05% | 1.6 M | 45% | 4 K | 0.0025 | 0.07% | |
|---|
| Europe Unspecified | Europe | N | .. | | .. | .. | 4 K | .. | 0.07% | |
|---|
Albania  | Europe | N | 2.8 M | 0.04% | 1.6 M | 58% | 4 K | 0.0023 | 0.07% | |
|---|
Dominican Republic  | Central-America | S | 9.4 M | 0.1% | 4.5 M | 48% | 4 K | 0.0008 | 0.07% | |
|---|
Paraguay  | South-America | S | 6.6 M | 0.09% | 1.8 M | 27% | 3 K | 0.0018 | 0.06% | |
|---|
Macau  | Asia | S | 582 K | 0.008% | 372 K | 64% | 3 K | 0.0087 | 0.06% | |
|---|
Tunisia  | Africa | S | 11 M | 0.2% | 4.4 M | 41% | 3 K | 0.0007 | 0.06% | |
|---|
Cyprus  | Europe | N | 862 K | 0.01% | 694 K | 81% | 3 K | 0.0046 | 0.06% | |
|---|
Guatemala  | Central-America | S | 15 M | 0.2% | 2.3 M | 15% | 3 K | 0.0014 | 0.06% | |
|---|
Qatar  | Asia | S | 1.9 M | 0.03% | 1.7 M | 92% | 3 K | 0.0018 | 0.06% | |
|---|
Iceland  | Europe | N | 324 K | 0.005% | 301 K | 93% | 3 K | 0.0094 | 0.05% | |
|---|
Nepal  | Asia | S | 26 M | 0.4% | 3.3 M | 13% | 3 K | 0.0009 | 0.05% | |
|---|
El Salvador  | Central-America | S | 6.3 M | 0.09% | 1.6 M | 24% | 3 K | 0.0018 | 0.05% | |
|---|
Luxembourg  | Europe | N | 537 K | 0.008% | 468 K | 87% | 3 K | 0.0059 | 0.05% | |
|---|
Palestine  | Asia | S | 4.4 M | 0.06% | 1.8 M | 40% | 3 K | 0.0015 | 0.05% | |
|---|
Jordan  | Asia | S | 6.5 M | 0.09% | 2.7 M | 41% | 2 K | 0.0009 | 0.04% | |
|---|
Malta  | Europe | N | 416 K | 0.006% | 287 K | 69% | 2 K | 0.0084 | 0.04% | |
|---|
Mongolia  | Asia | S | 2.8 M | 0.04% | 522 K | 19% | 2 K | 0.0045 | 0.04% | |
|---|
Iraq  | Asia | S | 35 M | 0.5% | 2.2 M | 6% | 2 K | 0.0011 | 0.04% | |
|---|
Honduras  | Central-America | S | 8.4 M | 0.1% | 1.5 M | 18% | 2 K | 0.0014 | 0.04% | |
|---|
Kyrgyzstan  | Asia | S | 5.6 M | 0.08% | 1.2 M | 22% | 2 K | 0.0017 | 0.04% | |
|---|
Kenya  | Africa | S | 44 M | 0.6% | 14 M | 31% | 2 K | 0.0001 | 0.03% | |
|---|
Bolivia  | South-America | S | 10 M | 0.1% | 3.5 M | 35% | 2 K | 0.0005 | 0.03% | |
|---|
Panama  | Central-America | S | 3.4 M | 0.05% | 1.6 M | 47% | 2 K | 0.0011 | 0.03% | |
|---|
Lebanon  | Asia | S | 4.8 M | 0.07% | 2.5 M | 53% | 2 K | 0.0007 | 0.03% | |
|---|
Cambodia  | Asia | S | 15 M | 0.2% | 739 K | 5% | 2 K | 0.0021 | 0.03% | |
|---|
Yemen  | Asia | S | 25 M | 0.3% | 4.3 M | 18% | 2 K | 0.0003 | 0.03% | |
|---|
Montenegro  | Europe | N | 620 K | 0.009% | 374 K | 60% | 1 K | 0.0033 | 0.02% | |
|---|
Faroe Islands  | Europe | N | 48 K | 0.0007% | 42 K | 87% | 1 K | 0.0296 | 0.02% | |
|---|
Angola  | Africa | S | 21 M | 0.3% | 3.1 M | 15% | 1 K | 0.0004 | 0.02% | |
|---|
Ghana  | Africa | S | 25 M | 0.4% | 4.2 M | 17% | 1 K | 0.0003 | 0.02% | |
|---|
| Satellite Provider | Unknown | X | .. | | .. | .. | 1 K | .. | 0.02% | |
|---|
| Anonymous Proxy | Unknown | X | .. | | .. | .. | 1 K | .. | 0.02% | |
|---|
Jersey  | Europe | N | 98 K | 0.001% | 39 K | 40% | 916 | 0.0235 | 0.02% | |
|---|
Uzbekistan  | Asia | S | 30 M | 0.4% | 10 M | 34% | 833 | 0.0001 | 0.02% | |
|---|
Nicaragua  | Central-America | S | 6.1 M | 0.09% | 773 K | 13% | 833 | 0.0011 | 0.02% | |
|---|
Jamaica  | Central-America | S | 2.7 M | 0.04% | 1.3 M | 50% | 750 | 0.0006 | 0.01% | |
|---|
Oman  | Asia | S | 3.8 M | 0.05% | 1.9 M | 48% | 750 | 0.0004 | 0.01% | |
|---|
Bahrain  | Asia | S | 1.2 M | 0.02% | 1.1 M | 89% | 666 | 0.0006 | 0.01% | |
|---|
Sudan  | Africa | S | 38 M | 0.5% | 7.2 M | 19% | 666 | 0.0001 | 0.01% | |
|---|
Maldives  | Asia | S | 317 K | 0.005% | 154 K | 48% | 666 | 0.0043 | 0.01% | |
|---|
Mauritius  | Africa | S | 1.3 M | 0.02% | 544 K | 43% | 583 | 0.0011 | 0.01% | |
|---|
Tanzania  | Africa | S | 45 M | 0.6% | 6.1 M | 14% | 583 | 0.0001 | 0.01% | |
|---|
Isle of Man  | Europe | N | 84 K | 0.001% | .. | 0% | 500 | .. | 0.009% | |
|---|
Haiti  | Central-America | S | 10 M | 0.1% | 1.1 M | 10% | 500 | 0.0005 | 0.009% | |
|---|
Libya  | Africa | S | 6.2 M | 0.09% | 1.1 M | 18% | 500 | 0.0004 | 0.009% | |
|---|
Ethiopia  | Africa | S | 87 M | 1.2% | 1.4 M | 2% | 500 | 0.0004 | 0.009% | |
|---|
| Guadeloupe | Central-America | S | 403 K | 0.006% | .. | 0% | 500 | .. | 0.009% | |
|---|
Trinidad and Tobago  | Central-America | S | 1.3 M | 0.02% | 730 K | 55% | 416 | 0.0006 | 0.008% | |
|---|
Namibia  | Africa | S | 2.1 M | 0.03% | 280 K | 13% | 416 | 0.0015 | 0.008% | |
|---|
Guam  | Oceania | S | 159 K | 0.002% | 98 K | 62% | 416 | 0.0042 | 0.008% | |
|---|
| Asia/Pacific Region Unspecified | Asia | S | .. | | .. | .. | 416 | .. | 0.008% | |
|---|
Nigeria  | Africa | S | 174 M | 2.5% | 56 M | 32% | 333 | 0.0000 | 0.006% | |
|---|
United States Virgin Islands  | Central-America | S | 106 K | 0.002% | 43 K | 40% | 333 | 0.0078 | 0.006% | |
|---|
Madagascar  | Africa | S | 21 M | 0.3% | 452 K | 2% | 333 | 0.0007 | 0.006% | |
|---|
Aruba  | South-America | S | 101 K | 0.001% | 80 K | 78% | 333 | 0.0042 | 0.006% | |
|---|
| R�union | Asia | S | 821 K | 0.01% | .. | 0% | 333 | .. | 0.006% | |
|---|
Ivory Coast  | Africa | S | 23 M | 0.3% | 522 K | 2% | 333 | 0.0006 | 0.006% | |
|---|
Uganda  | Africa | S | 34 M | 0.5% | 4.9 M | 14% | 333 | 0.0001 | 0.006% | |
|---|
Mozambique  | Africa | S | 24 M | 0.3% | 1.1 M | 5% | 250 | 0.0002 | 0.005% | |
|---|
| Unknown | Unknown | | .. | | .. | .. | 250 | .. | 0.005% | |
|---|
Andorra  | Europe | N | 76 K | 0.001% | 74 K | 96% | 250 | 0.0034 | 0.005% | |
|---|
Saint Lucia  | Central-America | S | 167 K | 0.002% | 79 K | 47% | 250 | 0.0032 | 0.005% | |
|---|
Bermuda  | North-America | N | 64 K | 0.0009% | 63 K | 98% | 250 | 0.0040 | 0.005% | |
|---|
Brunei  | Asia | S | 393 K | 0.006% | 246 K | 63% | 250 | 0.0010 | 0.005% | |
|---|
Zimbabwe  | Africa | S | 13 M | 0.2% | 2.2 M | 17% | 250 | 0.0001 | 0.005% | |
|---|
Rwanda  | Africa | S | 11 M | 0.1% | 938 K | 9% | 250 | 0.0003 | 0.005% | |
|---|
Burma  | Asia | S | 53 M | 0.8% | 584 K | 1% | 250 | 0.0004 | 0.005% | |
|---|
Monaco  | Europe | N | 36 K | 0.0005% | 27 K | 73% | 166 | 0.0063 | 0.003% | |
|---|
Liechtenstein  | Europe | N | 37 K | 0.0005% | 33 K | 89% | 166 | 0.0051 | 0.003% | |
|---|
Fiji  | Oceania | S | 858 K | 0.01% | 300 K | 35% | 166 | 0.0006 | 0.003% | |
|---|
Guernsey  | Europe | N | 62 K | 0.0009% | .. | 0% | 166 | .. | 0.003% | |
|---|
Laos  | Asia | S | 6.6 M | 0.09% | 708 K | 11% | 166 | 0.0002 | 0.003% | |
|---|
Guyana  | South-America | S | 785 K | 0.01% | 255 K | 32% | 166 | 0.0007 | 0.003% | |
|---|
Antigua and Barbuda  | Central-America | S | 86 K | 0.001% | 75 K | 86% | 166 | 0.0022 | 0.003% | |
|---|
Barbados  | South-America | S | 274 K | 0.004% | 211 K | 77% | 166 | 0.0008 | 0.003% | |
|---|
Bahamas  | North-America | N | 351 K | 0.005% | .. | 0% | 166 | .. | 0.003% | |
|---|
Cuba  | Central-America | S | 11 M | 0.2% | 2.8 M | 25% | 166 | 0.0001 | 0.003% | |
|---|
Tajikistan  | Asia | S | 8.0 M | 0.1% | 1.1 M | 14% | 166 | 0.0001 | 0.003% | |
|---|
San Marino  | Europe | S | 32 K | 0.0005% | 16 K | 50% | 166 | 0.0102 | 0.003% | |
|---|
Democratic Republic of the Congo  | Africa | S | 68 M | 1.0% | 1.2 M | 2% | 166 | 0.0001 | 0.003% | |
|---|
Greenland  | Europe | N | 56 K | 0.0008% | 37 K | 66% | 166 | 0.0044 | 0.003% | |
|---|
Zambia  | Africa | S | 13 M | 0.2% | 1.9 M | 14% | 166 | 0.0001 | 0.003% | |
|---|
Tonga  | Oceania | S | 103 K | 0.001% | 37 K | 36% | 83 | 0.0022 | 0.002% | |
|---|
Cura�ao  | Unknown | | 151 K | 0.002% | .. | 0% | 83 | .. | 0.002% | |
|---|
Afghanistan  | Asia | S | 26 M | 0.4% | 1.7 M | 7% | 83 | 0.0001 | 0.002% | |
|---|
Grenada  | Central-America | S | 103 K | 0.001% | 46 K | 44% | 83 | 0.0018 | 0.002% | |
|---|
Suriname  | South-America | S | 534 K | 0.008% | 194 K | 36% | 83 | 0.0004 | 0.002% | |
|---|
Gambia  | Africa | S | 1.8 M | 0.03% | 229 K | 12% | 83 | 0.0004 | 0.002% | |
|---|
Somalia  | Africa | S | 10 M | 0.1% | 139 K | 1% | 83 | 0.0006 | 0.002% | |
|---|
Liberia  | Africa | S | 4.3 M | 0.06% | 148 K | 3% | 83 | 0.0006 | 0.002% | |
|---|
Mali  | Africa | S | 15 M | 0.2% | 336 K | 2% | 83 | 0.0002 | 0.002% | |
|---|
Dominica  | Central-America | S | 71 K | 0.001% | 40 K | 57% | 83 | 0.0021 | 0.002% | |
|---|
| French Guiana | South-America | S | 229 K | 0.003% | .. | 0% | 83 | .. | 0.002% | |
|---|
Gabon  | Africa | S | 1.7 M | 0.02% | 139 K | 8% | 83 | 0.0006 | 0.002% | |
|---|
Samoa  | Oceania | S | 188 K | 0.003% | 25 K | 13% | 83 | 0.0033 | 0.002% | |
|---|
Benin  | Africa | S | 10 M | 0.1% | 365 K | 4% | 83 | 0.0002 | 0.002% | |
|---|
Bhutan  | Asia | S | 739 K | 0.01% | 182 K | 25% | 83 | 0.0005 | 0.002% | |
|---|
Turks and Caicos Islands  | Central-America | S | 31 K | 0.0004% | .. | 0% | 83 | .. | 0.002% | |
|---|
�land Islands  | Europe | N | 29 K | 0.0004% | .. | 0% | 83 | .. | 0.002% | |
|---|
Burkina Faso  | Africa | S | 17 M | 0.2% | 644 K | 4% | 83 | 0.0001 | 0.002% | |
|---|
Turkmenistan  | Asia | S | 5.2 M | 0.07% | 364 K | 7% | 83 | 0.0002 | 0.002% | |
|---|
Countries are only included if the number of page edits in the period exceeds 100,000 (100 matching records in 1:1000 sampled log)
Page edits by bots are not included. Also all ip addresses that occur more than once on a given day are discarded for that day.
A few false negatives are taken for granted. Country meta data collected from English Wikipedia (population, internet users)).
Errata: WMF traffic logging service suffered from server capacity problems in Aug/Sep/Oct 2011.
Absolute traffic counts for October 2011 are approximatly 7% too low.
Data loss only occurred during peak hours. It therefore may have had somewhat different impact for traffic from different parts of the world.
and may have also skewed relative figures like share of traffic per browser or operating system.From mid September till late November squid log records for mobile traffic were in invalid format.
Data could be repaired for logs from mid October onwards. Older logs were no longer available.
In a an unrelated server outage precisely half of traffic to WMF mobile sites was not counted from Oct 16 - Nov 29 (one of two load-balanced servers did not report traffic).
WMF has since improved server monitoring, so that similar outages should be detected and fixed much faster from now on.
Generated on Wed, Oct 9, 2013 16:22
Author:Erik Zachte (Web site)
Mail: ezachte@### (no spam: ### = wikimedia.org)
All data on this page are in the public domain.
Note: page may load slower on Microsoft Internet explorer than on other major browsers