
Engage with precision: customizable election graphics for every audience
Elevate your coverage of American elections with our suite of interactive graphics and data visualizations, thoughtfully designed to enhance storytelling and drive audience engagement.
AP election graphics include results tables and maps for every race we cover, from the White House to the statehouse to city hall. AP’s election graphics are offered in multiple languages, allowing your content to resonate with diverse audiences.
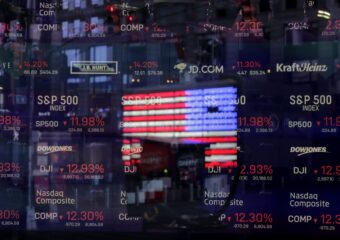
Real-time data
Elevate your coverage by staying ahead. AP’s election graphics are powered by our Vote Count results and VoteCast survey services, which provide real-time election results and details on voter opinions from the moment polls close. They allow your audience to follow along as Election Day becomes election night, keeping them informed and engaged with the latest developments in the elections they care most about.

Plug and play
AP’s graphics suite is designed for ease of use. Our “all in one” election graphic tells the whole story of Election Day from a single interactive. Looking for something more? From our AP Newsroom platform, you can select a race, pick the graphics to match the story you’d like to tell about that race, and receive a custom embed code that’s ready to place on all of your digital platforms. Create as many pages and layouts as you need to meet the needs of your audience. Our fully dynamic graphics look great on desktop, but are optimized for mobile – providing your audience with the latest details on an election no matter their device.
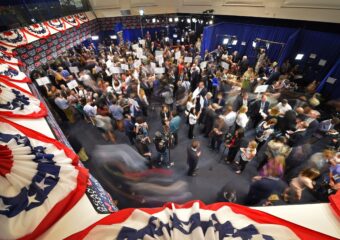
Graphics for every race
Our graphics suite includes results tables and maps not just for races at the top of the ticket, but for every race AP covers – national, state and local. You can use the same type of map that illustrates the vote count in the race for president to provide your audience with details about races for state legislature and other local elections.


Get in touch
To find out more about how our content and services can help your organization