Apartment List National Rent Report

Übersicht
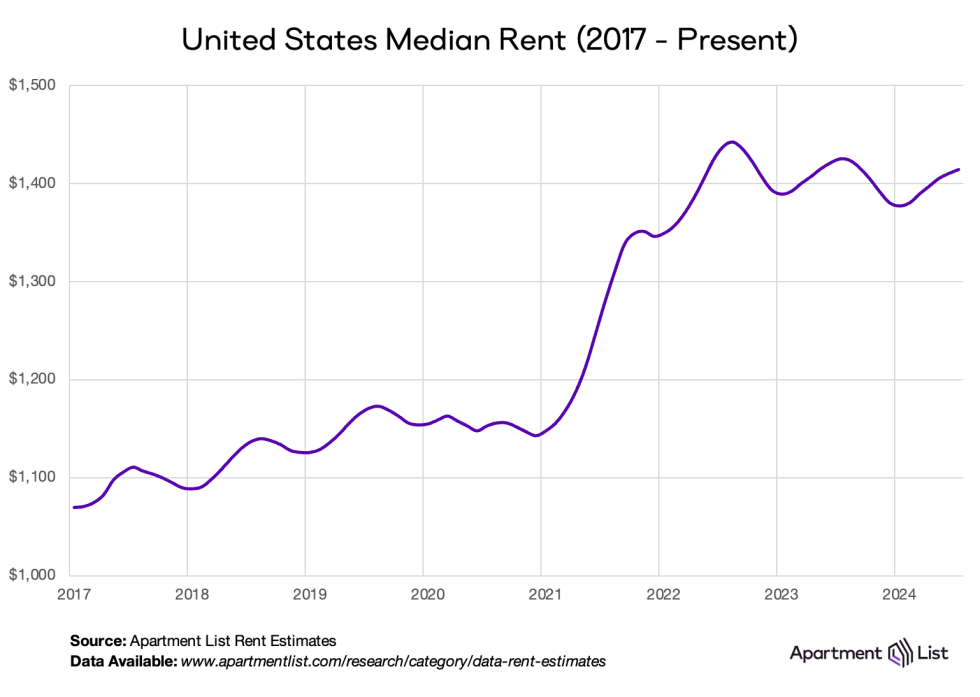
Welcome to the August 2024 Apartment List National Rent Report. Rent prices ticked up for the sixth straight month, but rent growth over the course of 2024 as a whole remains modest, signaling ongoing sluggishness in the market. And while month-over-month rent growth remains positive, it is decelerating. Prices increased just 0.2% in July and today the nationwide median rent stands at $1,414. It is very possible that rent growth will turn flat or negative in August, and stay there for the remainder of the year.
Since the second half of 2022, seasonal declines in rent prices have been steeper than usual and seasonal increases have been more mild. As a result, apartments are on average slightly cheaper today than they were one year ago. Year-over-year rent growth currently stands at -0.8 percent and has now been in negative territory for over a full year. Despite this, the national median rent is still more than $200 per month higher than it was just a few years ago.
On the supply side of the rental market, our national vacancy index remains slightly elevated, currently standing at 6.7 percent. After a historic tightening in 2021, multifamily occupancy has been slowly but consistently easing for over two years. And with 2024 bringing the most new apartment completions in decades, we expect that there will continue to be an abundance of vacant units on the market in the year ahead.
Zooming in a bit, 71 of the nation’s 100 largest cities saw rents go up in May. But on a year-over-year basis, rent growth is positive for only 52 of these cities. Many of the steepest year-over-year declines remain concentrated in Sun Belt cities that are rapidly expanding their multifamily inventory, such as Austin (-7.5 percent year-over-year), Raleigh (-5.2 percent), and Jacksonville (-4.6 percent).
Rents are up 0.2% month-over-month, down 0.8% year-over-year
Rent growth follows a seasonal pattern – prices tend to go up during the spring and summer and dip during the fall and winter. Today we are nearing the end of that busy summer season, but this year’s trend is not bringing elevated rent growth. The nationwide median rent has increased for six straight months; however, the pace of that positive rent growth is slowing, with rents up 0.2 percent in July, compared to 0.4 in June and 0.6 percent in May.
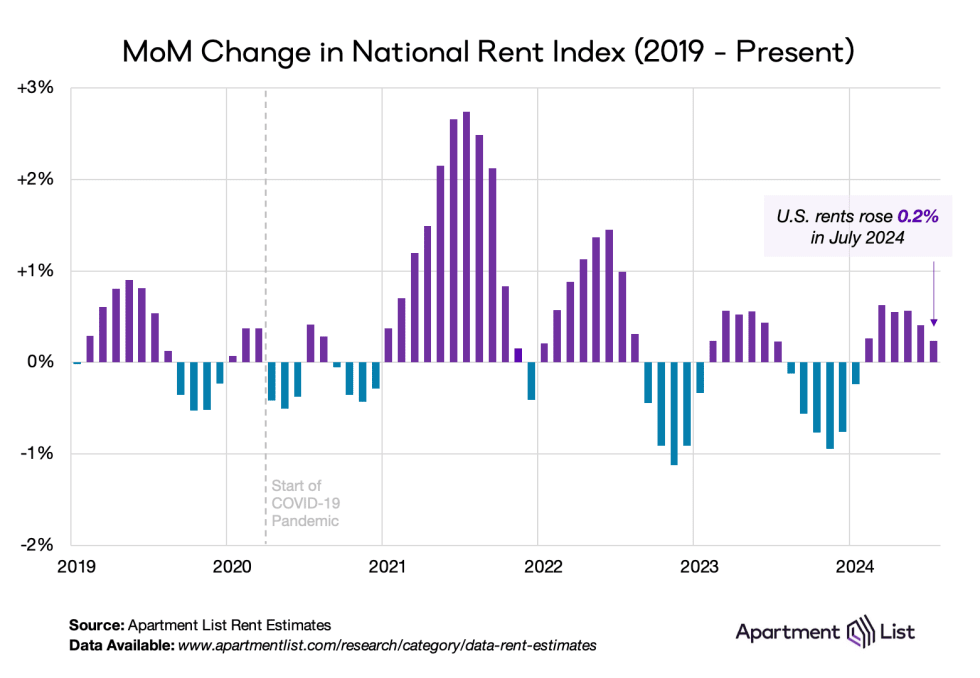
Seasonality has shifted slightly in the past two years. In both 2023 and 2024, peak monthly rent growth occurred in March, two months earlier than in pre-pandemic years. Since March, rent growth has slowly decelerated, reflecting the sluggish, supply-rich rental market that has persisted since late-2022.
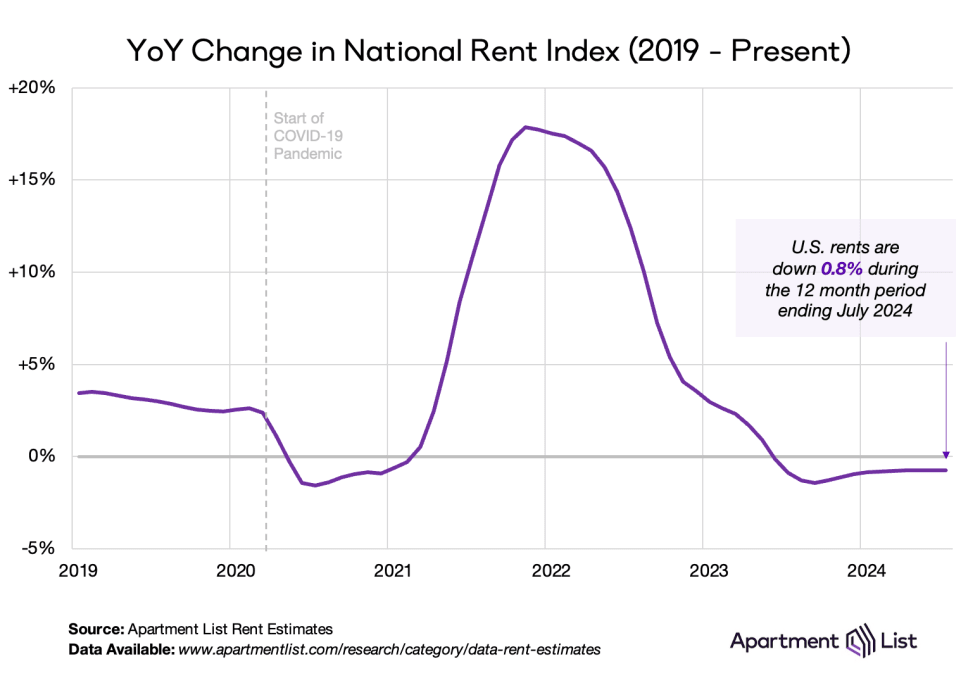
On a year-over-year basis, national rent growth remains in negative territory at -0.8 percent. Year-over-year rent growth – a simple comparison of prices in one month to prices 12 months earlier – dipped below zero in June 2023 and has stayed there for fourteen consecutive months. After prices skyrocketed in 2021 and 2022, the pendulum has since swung back as price growth has been kept in check by sluggish demand colliding with a robust supply of new inventory hitting the market. That said, this recent dip does not equate to a reversal of the earlier price hikes - although the national median rent is now 1.9 percent below its August 2022 peak, it is still 23 percent higher than it was at the start of 2021.
Rent CPI remains elevated even as rents for new leases dip
The primary measure of inflation in the United States is the Bureau of Labor Statistics's Consumer Price Index (CPI), which is heavily influenced by changes in housing prices.1 The Apartment List National Rent Index has proven to be a strong leading indicator of the CPI housing and rent components (collectively referred to as “shelter”), since our index captures price changes in new leases, which are only later reflected in price changes across all leases (what the CPI measures).
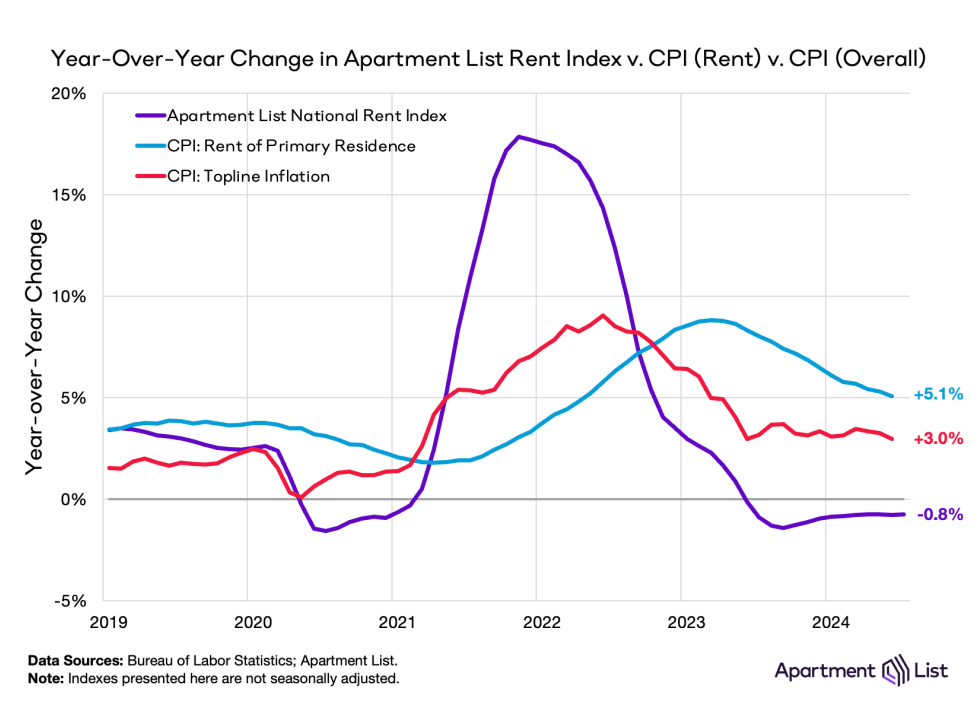
Because of these methodological differences, when our index peaked with record-setting rent growth in late 2021, the CPI’s measure of housing cost inflation was still in the early stages of its upswing. And while rent growth as measured by our index was cooling over the course of 2022, the CPI measure continued to rise. But as we had long been predicting, the shelter component of CPI finally turned the corner last spring and has been steadily cooling off ever since – while most components of inflation are difficult to predict, the Apartment List Rent Index can help tell us where shelter CPI is headed. But despite the progress, shelter CPI remains elevated and is continuing to exert upward pressure on topline CPI. As shelter inflation continues to trend down, it will help ease overall inflation as well, but it will take time for shelter CPI to fully metabolize the shock to market rents.
Apartment vacancies remain near their pandemic peak
The rapid price fluctuations that have defined the rental market over the past three years are largely attributable to changes in the balance between the number of vacant apartments available (supply) and the number of renters looking to move into them (demand). Early in the pandemic, the Apartment List Vacancy Index rose to 6.8 percent as many Americans consolidated households and moved in with family amid large job losses and economic uncertainty. Then, a suddenly tight rental market drove rapid rent growth in 2021 and 2022 as more households competed for a dwindling supply of vacant units. Our vacancy index tightened from 6.8 percent to 3.8 percent in just over a year.

But after bottoming out in October 2021, vacancies have been opening up steadily for over two years. Through July, our vacancy index sits at 6.7 percent, the highest reading since August 2020. And there’s good reason to expect that it could rise even further during the remainder of the year. Despite a recent slowdown in new permits being issued and new construction projects breaking ground, the number of multifamily units under construction remains near record levels. 2023 saw the most new apartments complete construction in more than 30 years, and an even greater number of new units are expected to come on the market this year. This means that renters should have more available options than they have in some time, especially in the Sun Belt markets where construction activity has been strongest.
Vacancy trends are highly localized, and they have been a key indicator of rapidly evolving conditions in local markets across the U.S. throughout the pandemic. To explore the topic in greater detail, monthly vacancy data are now available for download for hundreds of cities, metros, and states, and can be easily linked to our existing rent estimates using Federal Information Processing System (FIPS) codes.
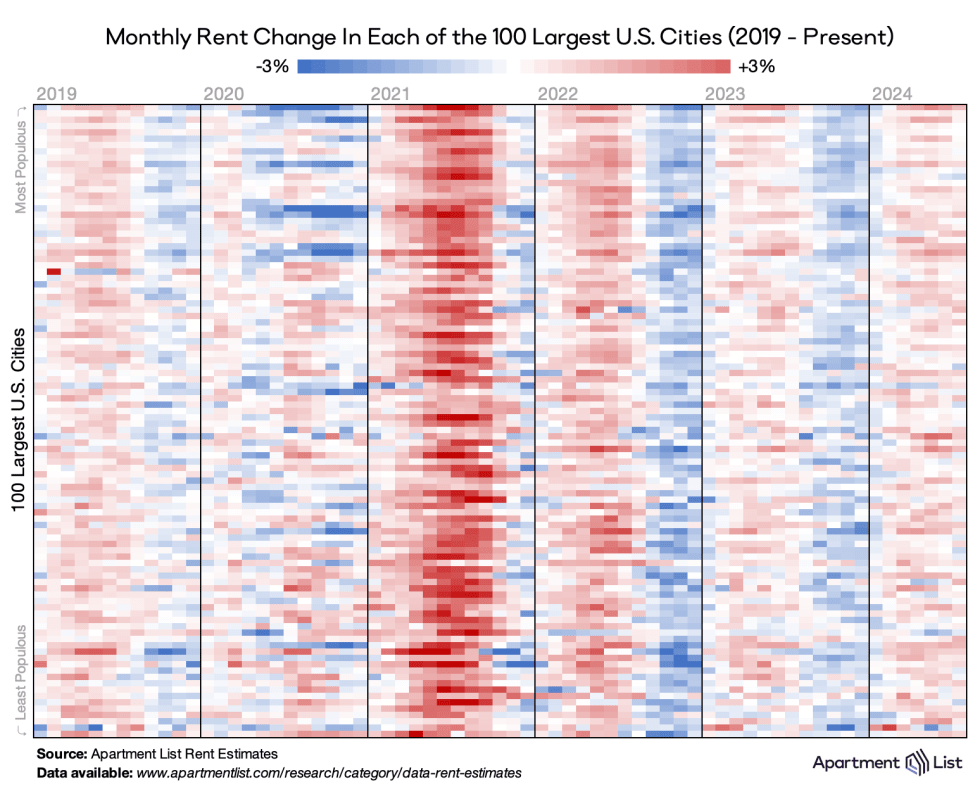
Rents are up month-over-month in 71 of 100 largest cities, up year-over-year in 52
The chart below visualizes monthly rent changes in each of the nation’s 100 largest cities from January 2019 to present. The color in each cell represents the extent to which prices went up (red) or down (blue) in a given city in a given month. We see a typical seasonal pattern in 2019, followed by 2020, where horizontal bands of dark blue represent steep rent drops in some of the nation’s largest and most expensive cities. Meanwhile, the dark red bands in 2021 and 2022 represent the rent heatwave that drove up prices nationwide. But the right side of the chart shows a strong cooldown in late 2022 and only modest rent growth in the two summers that follow. Nationwide rent growth was positive in July 2024, so too was it positive in the majority of large cities across the country; 72 of the nation’s largest 100 cities saw prices rise month-over-month.
Despite most cities seeing prices rise on a monthly basis, a majority have still seen rents dip over the past twelve months as a whole. In mid-2022, all 100 of these cities were posting positive year-over-year rent increases. But as the market cooled and many regions experienced back-to-back slow winter seasons, an increasing number of cities saw annual rent change flip negative. Today, the median rent is cheaper than it was one year ago in 48 of the 100 largest cities. Most of these cities are concentrated in Florida, Texas, Arizona, and along the West Coast. In contrast, many large cities in the Midwest and Northeast are still experiencing positive annual rent growth.
New supply driving falling rents in Sun Belt markets while Midwest and Northeast maintain positive growth
The prevalence of year-over-year rent declines in Sun Belt markets can be clearly seen in the metro-level map below. The Austin metro has seen the nation’s sharpest decline among large metros, with prices there down 7.4 percent in the last 12 months. The Austin metro is also significant for permitting new homes at the fastest pace of any large metro in the country, signaling the important role new supply plays in managing long-term affordability. Austin is not alone in exhibiting this trend. Among the ten metros with sharpest year-over-year rent declines, seven also rank in the top ten for the highest rates of multifamily permitting activity from 2021 to 2023 (Austin, Nashville, Raleigh, Jacksonville, Orlando, Phoenix, and San Antonio). Notably all of these markets are located in the Sun Belt.
At the other end of the spectrum, the fastest rent growth has been occurring in Honolulu plus metros across the Midwestern and Northeastern United States. These are markets where steady rental demand is not being matched by supply growth. The Midwest is led by Cleveland, Milwaukee, and Detroit, while the Northeast is led by Hartford, D.C., and Providence. Note, however, that even the markets topping the list are mostly experiencing fairly modest rent growth. Only three large metros have seen rents rise by more than 5 percent over the past year.
Fazit
With July’s 0.2 percent increase, rent growth is slowing down for the year. Year-over-year rent growth also indicates a sluggish market, remaining negative at -0.8 percent. Rent increases are currently being moderated by a robust construction pipeline expected to deliver a decades-high number of new apartment units in 2024. Improving consumer sentiment about broader macroeconomic conditions may be driving a modest rebound in rental demand, but that bounceback has so far been outweighed by the impact of incoming supply.
For more detailed data, see the table below, which contains the most recent estimates for the nation’s 100 largest cities. And for complete data, see our rental data download page, where you can download the full history of our monthly estimates going back to 2017 at various geographic levels (national, state, metro, county, and city). And as always, feel free to contact us with any questions.
| City | Population | Median 1BR Rent ($) | Median 2BR Rent ($) | MoM Rent Growth (%) | YoY Rent Growth (%) |
|---|---|---|---|---|---|
| New York City, NY | 8622467 | 2330 | 2457 | 1.3 | 2.4 |
| Los Angeles, CA | 3881041 | 1885 | 2404 | 0.2 | -1.8 |
| Chicago, IL | 2721914 | 1615 | 1758 | 0.2 | 1.6 |
| Houston, TX | 2296253 | 1157 | 1372 | 0 | -0.9 |
| Phoenix, AZ | 1609456 | 1171 | 1396 | 0 | -3.4 |
| Philadelphia, PA | 1593208 | 1320 | 1527 | 0.1 | 0.8 |
| San Antonio, TX | 1445662 | 1040 | 1281 | 0.1 | -3.7 |
| San Diego, CA | 1383987 | 1986 | 2489 | -0.1 | -3.5 |
| Dallas, TX | 1300642 | 1249 | 1478 | 0.2 | -2.8 |
| San Jose, CA | 1001176 | 2502 | 2969 | 0.7 | 1.9 |
A Note on Our Methodology
Apartment List has long been committed to making our data products as accurate and transparent as possible. Our rent estimates and vacancy index are calculated as follows:
Rent Estimates: We estimate rent growth using a same-unit approach that controls for compositional changes in the rental stock. We also control for price fluctuations that arise over the course of a vacancy by identifying the last available list price before a unit gets rented as a proxy for its transacted price. Finally, we combat luxury bias in our rent data by benchmarking our reported rent levels to fully-representative median rent statistics from the Census Bureau’s American Community Survey.
Vacancy Index: Our real-time availability data allows us to calculate a daily vacancy rate for each of our partner properties, which we then average over the course of each month to calculate a monthly rate. Our overall index is an average of these property-level vacancy rates, weighted by the number of units in each property. We restrict our sample to properties that have been on Apartment List for at least six months and that have attained a stabilized vacancy rate of 15% or less.
For those interested in getting deeper in the weeds, please see our rent estimate methodology and vacancy index methodology. And if you have any questions or custom data requests, you can reach us at [email protected].
For more context on local data, check out our market-specific rent reports for the following cities:
- Atlanta, GA
- Austin, TX
- Baltimore, MD
- Boston, MA
- Boulder, CO
- Charlotte, NC
- Chicago, IL
- Cleveland, OH
- Colorado Springs, CO
- Dallas, TX
- Denver, CO
- Detroit, MI
- Fort Collins, CO
- Fort Lauderdale, FL
- Houston, TX
- Indianapolis, IN
- Jacksonville, FL
- Los Angeles, CA
- Miami, FL
- Minneapolis, MN
- Nashville, TN
- New Orleans, LA
- New York, NY
- Orlando, FL
- Phoenix, AZ
- Philadelphia, PA
- Raleigh, NC
- San Antonio, TX
- San Diego, CA
- San Francisco, CA
- San Jose, CA
- Seattle, WA
- Tallahassee, FL
- Tampa, FL
- Tucson, AZ
- Washington, DC
If you would like to get future updates from the Apartment List Research Team, please subscribe to our email list.
About Apartment List Rent Reports:
Apartment List’s Rent Reports cover rental pricing data in major cities, their suburbs, and their neighborhoods. We provide valuable leading indicators of rental price trends, highlight data on top cities, and identify the key facts renters should know. As always, our goal is to provide price transparency to America’s 105 million renters to help them make the best possible decisions in choosing a place to call home. Apartment List publishes Rent Reports during the first calendar week of each month.
- Housing comprises roughly one-third of the Bureau of Labor Statistics’ CPI inflation measure, and the BLS methodology is based on estimates of market rents for both rentals and owner-occupied housing, a concept referred to as owners’ equivalent rent.↩
Share this Article