Release date: July 7, 2016 | Next release date: July 13, 2016
Crude-by-rail volumes to the East Coast drop as imports rise
Movements of crude by rail (CBR) within the United States, including intra-Petroleum Administration for Defense Districts (PADD) movements, averaged 442,000 barrels per day (b/d) in the first four months of 2016, down 45% from the same period last year. A reduction in CBR movements from PADD 2 (Midwest) to PADD 1 (East Coast) accounts for about one-half of the decline (Figure 1). Since September 2015, CBR volumes have generally decreased as crude oil price spreads have narrowed (making imported crudes relatively cheaper compared with railed supplies), pipelines have come online, and domestic inland production has declined.

The economics of CBR flows to east coast refiners depends largely on the relationship between the prices of domestic and international crudes. Domestic crudes priced in the Midwest and West Texas are no longer heavily discounted compared with imported crudes priced in the North Sea. The narrower the spread between domestic and imported crudes, the more likely coastal refiners will choose to run imported crudes rather than domestic supplies shipped via rail.
Crude carried by rail from the Midwest to the East Coast remain the country's largest CBR movement at 147,000 b/d, or 42%, of total CBR moved within the United States in April 2016, the latest month for which data are available. Crude imports processed by PADD 1 refineries have generally increased since early 2015, averaging 921,000 b/d in April 2016 (Figure 2), up from 538,000 b/d in April of last year.

EIA develops the crude and biofuels rail movement data using information provided by the Surface Transportation Board (STB) along with data from Canada's National Energy Board, other third-party sources, and several EIA surveys (Figure 3). EIA uses the STB Carload Waybill Sample to calculate rail movements in carloads. Railroads that deliver to their final destination more than 4,500 carloads per year in the United States must submit a Carload Waybill Sample to the STB every quarter. The sampling rate varies with the number of carloads in the waybill. The Waybill Sample provides the origin and destination terminal of each completed movement, which EIA aggregates by PADD and month. A barrel-per-carload factor is calculated quarterly from carload weights and API gravities of crudes produced in the United States and Canada, and used to convert the carloads to barrels for integration with other EIA crude oil data series. For near months, between release of STB data, CBR data are modeled using other available EIA crude oil data, such as field production, refinery inputs, imports and exports, and lagged CBR data. Similar to all of EIA's monthly petroleum data, the new CBR data are subject to revision as new information becomes available, in particular the most recent one to three months of rail data from the STB.

U.S. average regular gasoline retail and diesel fuel prices decline
The U.S. average regular gasoline retail price decreased four cents from the previous week to $2.29 per gallon on July 5, down 50 cents from the same time last year. The Midwest price dropped eight cents to $2.21 per gallon, followed by the East Coast and Gulf Coast prices, each down two cents to $2.23 per gallon and $2.07 per gallon, respectively. The West Coast and Rocky Mountain prices each dropped one cent to $2.76 per gallon and $2.31 per gallon, respectively.
The U.S. average diesel fuel price fell by less than a penny from a week ago, dipping to $2.42 per gallon, down 41 cents from the same time last year. The West Coast, East Coast, and Gulf Coast prices each dropped by less than one cent to $2.71 per gallon, $2.44 per gallon, and $2.28 per gallon, respectively. The Midwest price remained unchanged at $2.39 per gallon, while the Rocky Mountain price rose by one cent to $2.44 per gallon.
Propane inventories gain
U.S. propane stocks increased by 2.7 million barrels last week to 84.8 million barrels as of July 1, 2016, 0.9 million barrels (1.1%) lower than a year ago. Gulf Coast and Midwest inventories increased by 1.8 million barrels, and 1.2 million barrels, respectively. Rocky Mountain/West Coast inventories and East Coast inventories decreased by 0.2 million barrels, and 0.1 million barrels, respectively. Propylene non-fuel-use inventories represented 3.9% of total propane inventories.
For questions about This Week in Petroleum, contact the Petroleum Markets Team at 202-586-4522.
Retail prices (dollars per gallon)
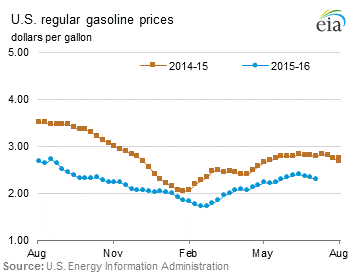
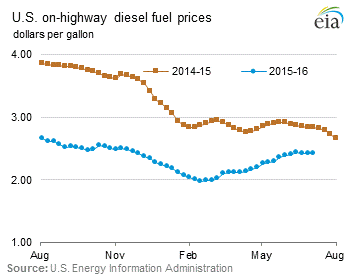
| Retail prices | Change from last | ||
|---|---|---|---|
| 07/04/16 | Week | Year | |
| Gasoline | 2.291 | -0.038 | -0.502 |
| Diesel | 2.423 | -0.003 | -0.409 |
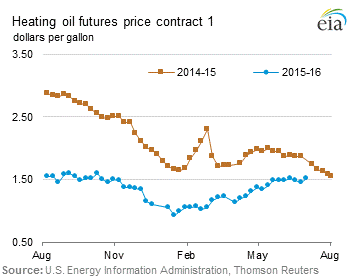
Futures prices (dollars per gallon*)
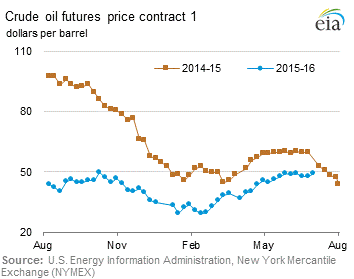
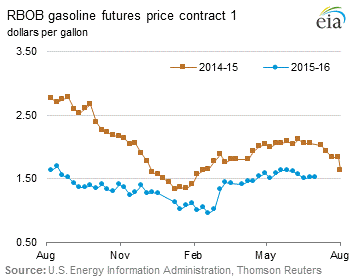
| Futures prices | Change from last | ||
|---|---|---|---|
| 07/01/16 | Week | Year | |
| Crude oil | 48.99 | 1.35 | NA |
| Gasoline | 1.514 | -0.011 | NA |
| Heating oil | 1.512 | 0.057 | NA |
| *Note: Crude oil price in dollars per barrel. | |||
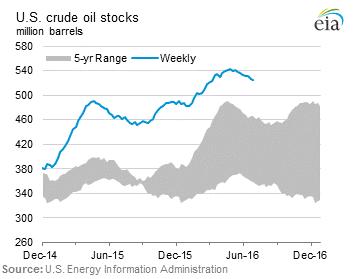
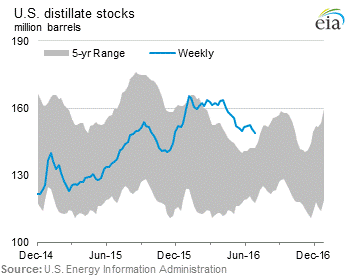
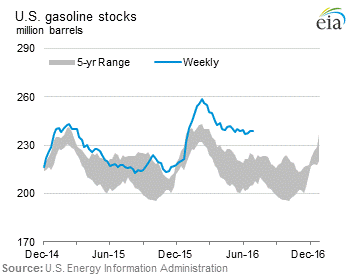
Stocks (million barrels)

| Stocks | Change from last | ||
|---|---|---|---|
| 07/01/16 | Week | Year | |
| Crude oil | 524.4 | -2.2 | 58.6 |
| Gasoline | 238.9 | -0.1 | 20.9 |
| Distillate | 148.9 | -1.6 | 11.5 |
| Propane | 84.788 | 2.715 | -0.936 |
