Release date: March 29, 2017 | Next release date: April 5, 2017
U.S. oil producers issued record equity in 2016 and increased investment in the final quarter
A group of 44 U.S. onshore-focused oil producers issued a record amount of equity in 2016. In the fourth quarter of 2016, capital expenditure for these companies was $4.9 billion (72%) higher than in the fourth quarter of 2015. This increase in investment spending was the first year-over-year increase since the fourth quarter of 2014 and largest annual increase for any quarter since at least the first quarter of 2012. Quarterly financial statements from these producers also show an overall improvement in their financial situation compared with early 2016 and all of 2015. Company announcements and continued increases in the number of active oil rigs suggest U.S. oil production companies are increasing capital expenditure in 2017.
Market conditions for U.S. oil producers grew more favorable as West Texas Intermediate (WTI) front-month futures prices averaged $49.29 per barrel (b) in the fourth quarter of 2016, compared to $42.16/b in the fourth quarter of 2015 and $33.63/b in the first quarter of 2016. Higher prices are contributing to an increase in upstream earnings for U.S. producers, prompting some companies to increase their investment budgets. In the fourth quarter of 2016, a majority of these companies experienced a year-over-year increase in earnings and a decline in long-term debt-to-equity ratios, which suggest U.S. producers are financially healthier than they were in 2015 and the beginning of 2016 (Figure 1). In addition, 73% of the 44 companies reported a year-over-year increase in earnings, the largest such percentage since the third quarter of 2014. Just over half of these companies reported an annual decrease in their debt-to-equity ratios, close to the levels of the third and fourth quarters of 2014.

Companies are acquiring reserves to eventually expand production, which will require further capital expenditure. Some notable announcements include the following:
- Concho Resources purchased 16,400 net acres in the Northern Delaware Basin from Endurance Resources for $430 million.
- RSP Permian announced that it will acquire Silver Hill Energy Partners and Silver Hill E&P II, LLC for $2.4 billion.
- SM Energy will purchase 35,700 net Permian Basin acres from QStar LLC for $1.6 billion.
- Diamondback Energy announced that it will acquire all leasehold interests in Pecos and Reeves Counties, Texas, from Brigham Resources for $2.6 billion, completing the transaction in the first quarter of 2017.
Despite the increase in crude oil prices and capital expenditure, cash from operations declined $475 million year-over-year in the fourth quarter of 2016 (Figure 2). Significant reductions in exploration and development spending over the course of 2015-16 led to less drilling, which reduced oil production in the fourth quarter of 2016, likely offsetting some increased revenue that came from higher prices. Companies' cash flow statements also show an increase in working capital movements, which lowers the net cash generated from operating activities. The fourth quarter of 2016 had the lowest year-over-year decline in cash from operations since it began falling in the first quarter of 2015. Cash from operations lags capital expenditure for these companies because they invest to develop reserves that will increase oil production and cash flow in the future. In the years 2011-14, these companies had typically raised cash through debt—either borrowing from a bank or issuing bonds.

These companies raised over $4.5 billion in the fourth quarter through equity issuance, more than all but one quarter in the 2011-15 period (Figure 3). For 2016 as a whole, these companies raised $15.8 billion in equity, with the average equity issuance of $4.0 billion per quarter, significantly above the 2011-15 quarterly average of $1.4 billion. Equity issuance is often considered to be less attractive to companies than debt funding given the tax deductibility of interest expenses. Another factor that may have reduced debt issuance is that banks often set credit limits based on the value of proved reserves. The effect of lower prices in 2015 on the value of proved reserves was compounded by a 1.0 billion barrel decline in the level of proved reserves for the 44 companies in 2015. Proved reserves (defined as the estimated quantities of oil and natural gas that analyses of geologic and engineering data demonstrate with reasonable certainty are recoverable under existing economic and operating conditions) increased 0.1 billion barrels for this set of companies in 2016, which together with higher prices could allow some companies to increase bank borrowing in 2017.

The U.S. active oil-directed rig count stood at 652 on March 24, with growth accelerating since the end of the fourth quarter of 2016, when the count was only 525. In addition, the number of short positions in futures and option contracts held by producers and merchants, which provides a measure for the amount of future production oil companies have hedged, accelerated since crude oil prices rose above $50/b in the fourth quarter of 2016, approaching a ten-year high of 756,000 contracts on February 14, 2017 (Figure 4). Financial hedging reduces the effect of a fall in revenue if prices were to decline. These indicators suggest that U.S. oil companies are continuing to increase capital expenditures in exploration and development and support continued production growth in the United States. Financial results for the first quarter of 2017 will be released in May.

U.S. average regular gasoline and diesel prices fall
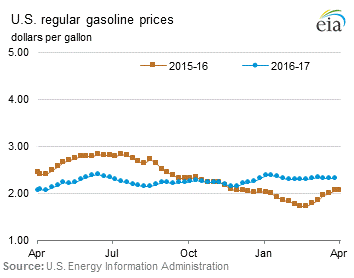
The U.S. average regular gasoline retail price fell less than one cent from the previous week, remaining at $2.32 per gallon on March 27, up 25 cents from the same time last year. The Midwest price fell four cents to $2.18 per gallon, while the West Coast and Rocky Mountain prices remained virtually unchanged at $2.85 per gallon and $2.30 per gallon, respectively. The Gulf Coast price increased nearly two cents to $2.09 per gallon, and the East Coast price increased one cent to $2.28 per gallon.
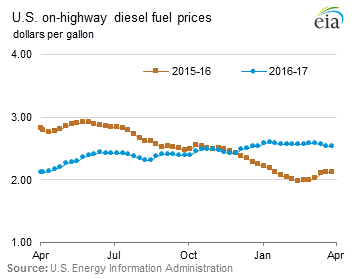
The U.S. average diesel fuel price fell one cent to $2.53 per gallon on March 27, 41 cents higher than a year ago. The East Coast price decreased by one cent to $2.59 per gallon, the West Coast price fell less than one cent to $2.82 per gallon, and the Midwest price fell less than one cent, remaining at $2.46 per gallon. The Gulf Coast price remained virtually unchanged at $2.38 per gallon. The Rocky Mountain price increased by one cent to $2.60 per gallon.
Propane inventories fall
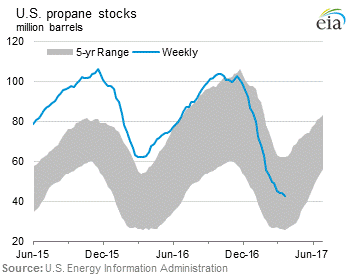
U.S. propane stocks decreased by 1.5 million barrels last week to 42.8 million barrels as of March 24, 2017, 20.0 million barrels (31.9%) lower than a year ago. Midwest, East Coast, and Rocky Mountain/West Coast inventories decreased by 0.9 million barrels, 0.4 million barrels, and 0.2 million barrels, respectively. Gulf Coast inventories were virtually unchanged. Propylene non-fuel-use inventories represented 5.9% of total propane inventories.
Residential heating fuel prices decrease
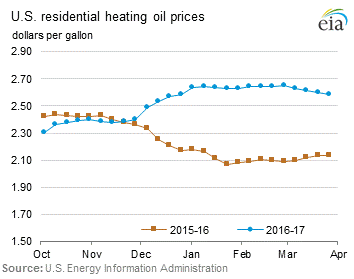
As of March 27, 2017, residential heating oil prices averaged nearly $2.59 per gallon, over one cent per gallon less than last week's price but nearly 46 cents per gallon higher than last year's price at this time. The average wholesale heating oil price is nearly $1.60 per gallon, less than one cent per gallon lower than last week but 33 cents per gallon higher than a year ago.
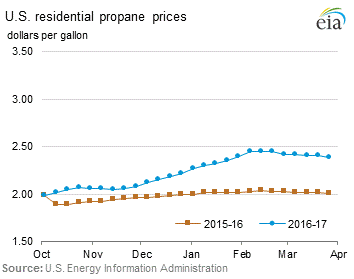
Residential propane prices averaged $2.39 per gallon, almost two cents per gallon lower than last week's price but 38 cents per gallon higher than a year ago. Wholesale propane prices averaged $0.67 per gallon, two cents per gallon lower than last week but nearly 16 cents per gallon higher than last year's price.
This is the last data collection for the 2016-2017 State Heating and Propane Program (SHOPP) heating season. Data collection will resume on October 2, 2017 for publication on Wednesday, October 4, 2017.
For questions about This Week in Petroleum, contact the Petroleum Markets Team at 202-586-4522.
Retail prices (dollars per gallon)
| Retail prices | Change from last | ||
|---|---|---|---|
| 03/27/17 | Week | Year | |
| Gasoline | 2.315 | -0.006 | 0.249 |
| Diesel | 2.532 | -0.007 | 0.411 |
| Heating Oil | 2.586 | -0.014 | 0.455 |
| Propane | 2.390 | -0.015 | 0.382 |
Futures prices (dollars per gallon*)
| Futures prices | Change from last | ||
|---|---|---|---|
| 03/24/17 | Week | Year | |
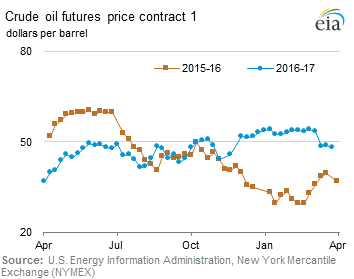
| Crude oil | 47.97 | -0.81 | NA |
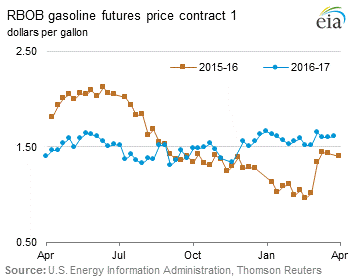
| Gasoline | 1.605 | 0.006 | NA |
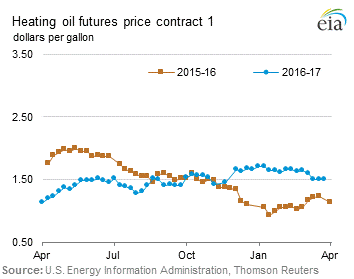
| Heating oil | 1.498 | -0.011 | NA |
| *Note: Crude oil price in dollars per barrel. | |||
Stocks (million barrels)
| Stocks | Change from last | ||
|---|---|---|---|
| 03/24/17 | Week | Year | |
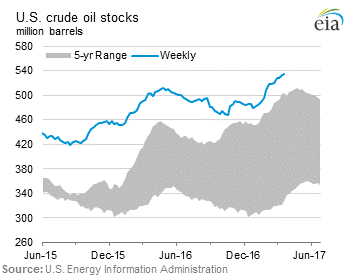
| Crude oil | 534.0 | 0.9 | 30.2 |
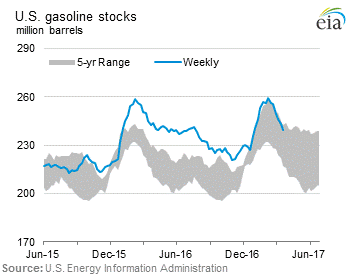
| Gasoline | 239.7 | -3.7 | -2.8 |
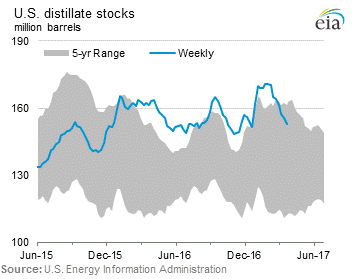
| Distillate | 152.9 | -2.5 | -8.3 |
| Propane | 42.795 | -1.538 | -20.030 |
