


Five ways to make the most of your Design System Analytics
We built Design System Analytics to give teams the context they need to make better decisions when building and maintaining their design systems. Depending on how you create your team libraries and what your goals are, some metrics will be more useful to you than others. Below we’ve summarized the analytics available in Figma and provided some tips to help you make the most of them.
What analytics are available

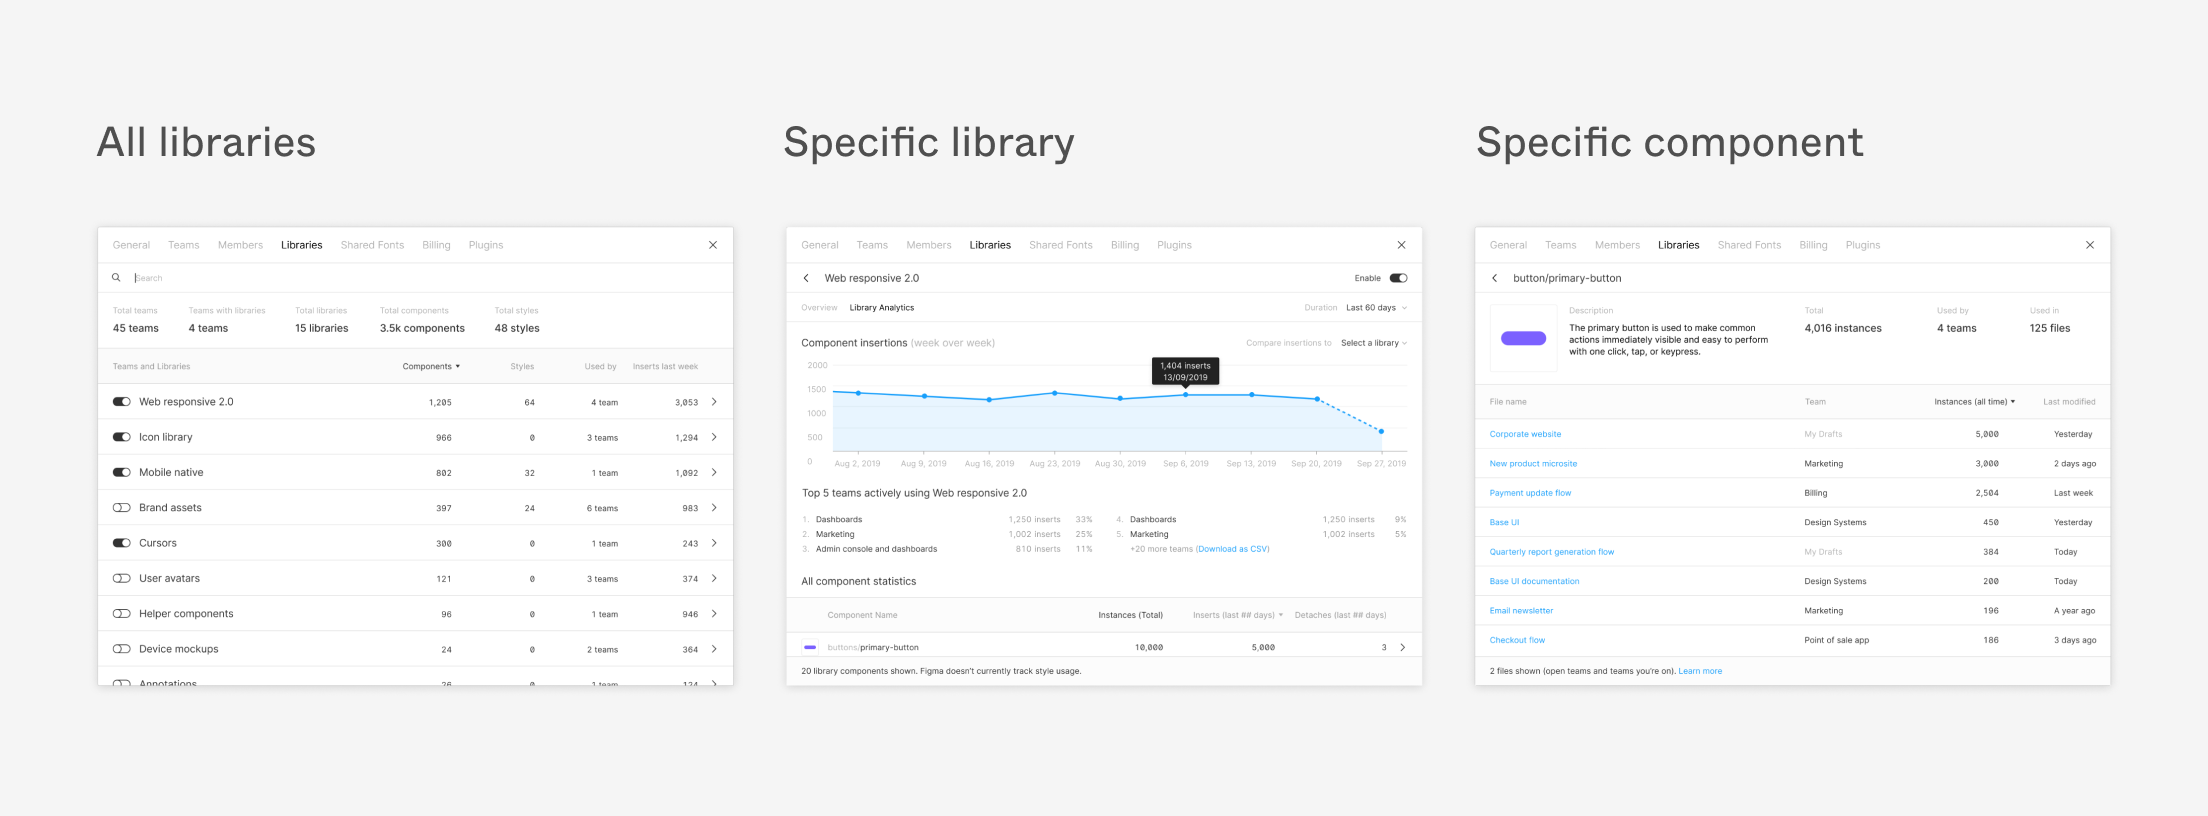
At the highest level, Figma provides analytics that show you how your organization is using your shared libraries. This includes the total number of teams, libraries, components, and styles within your organization. You can sort the libraries in your organization by the number of teams that are using each library or by heaviest recent usage (based on the number of components that were inserted from each library in the last week).
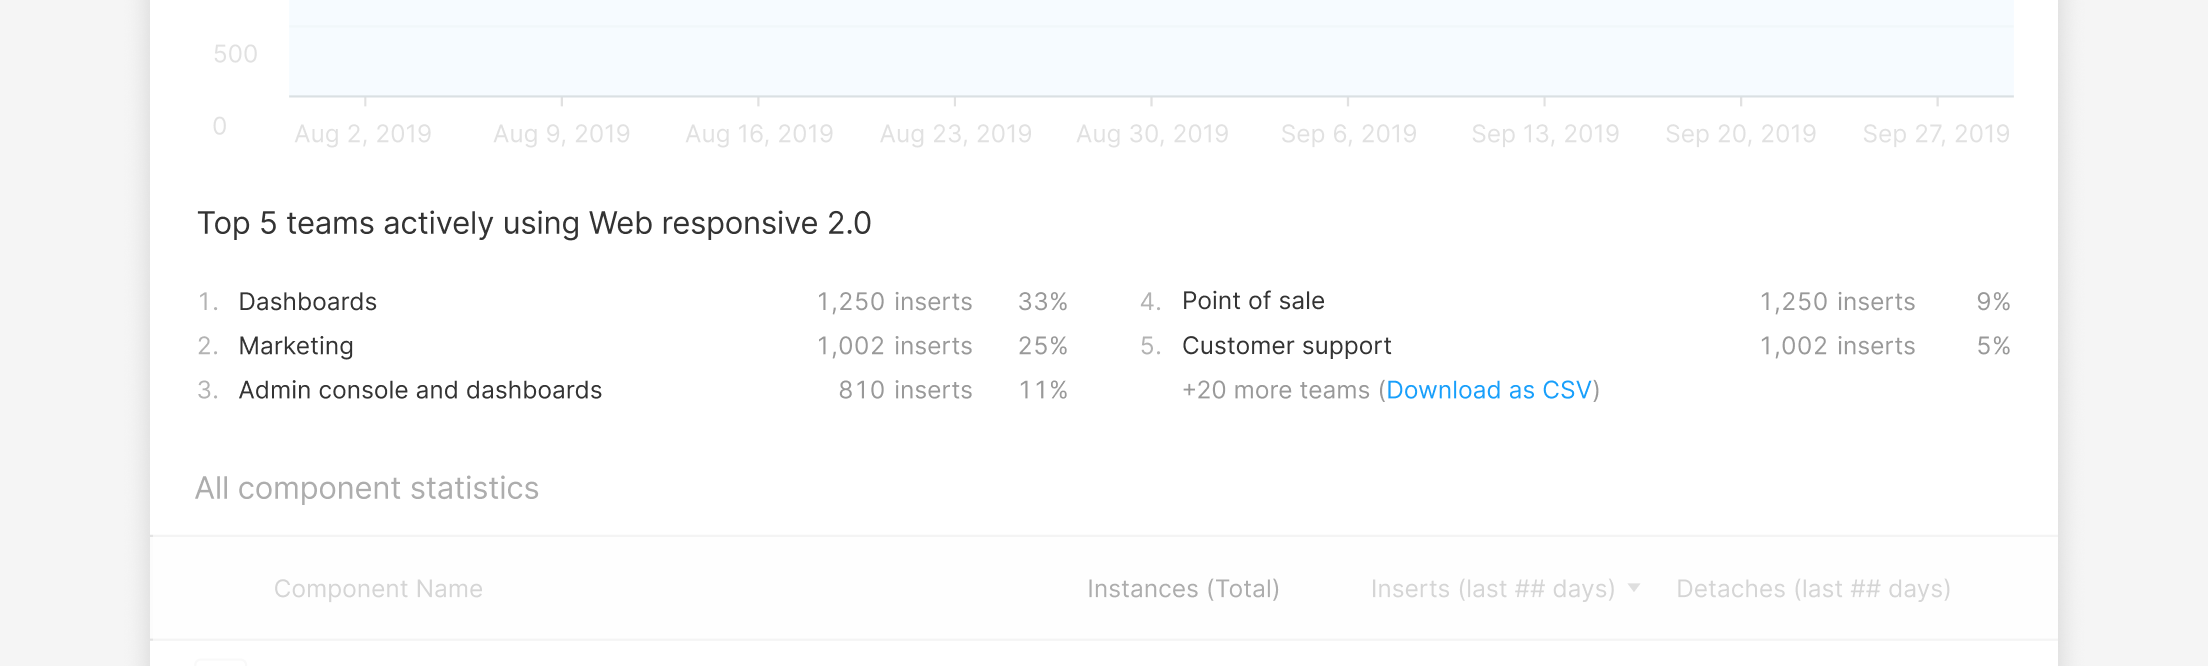
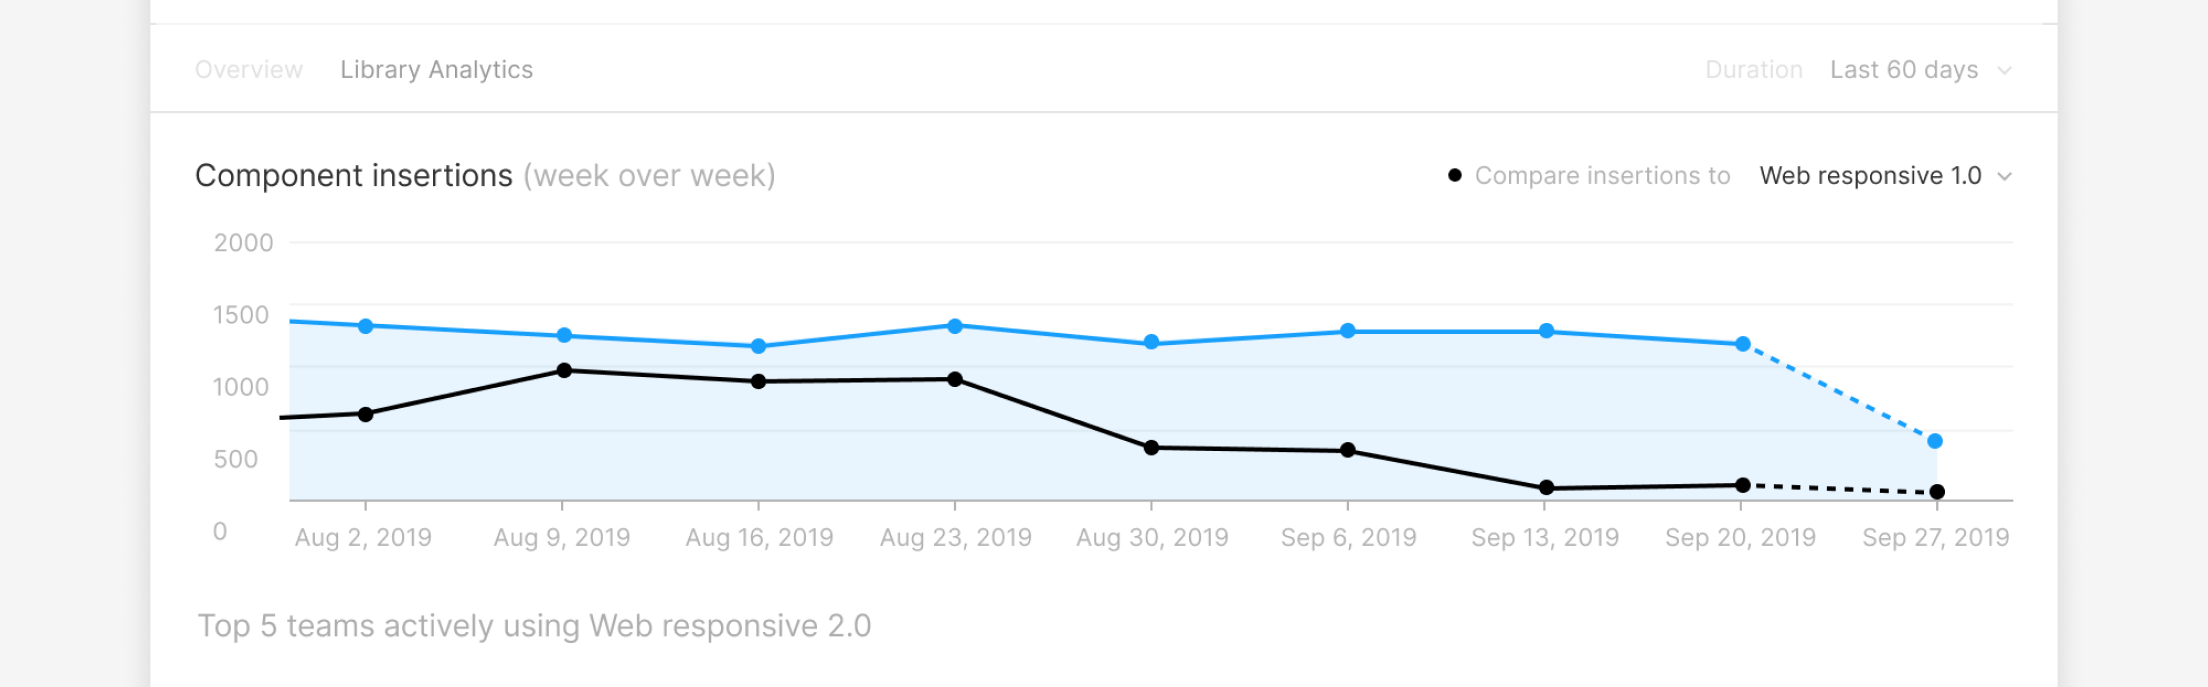
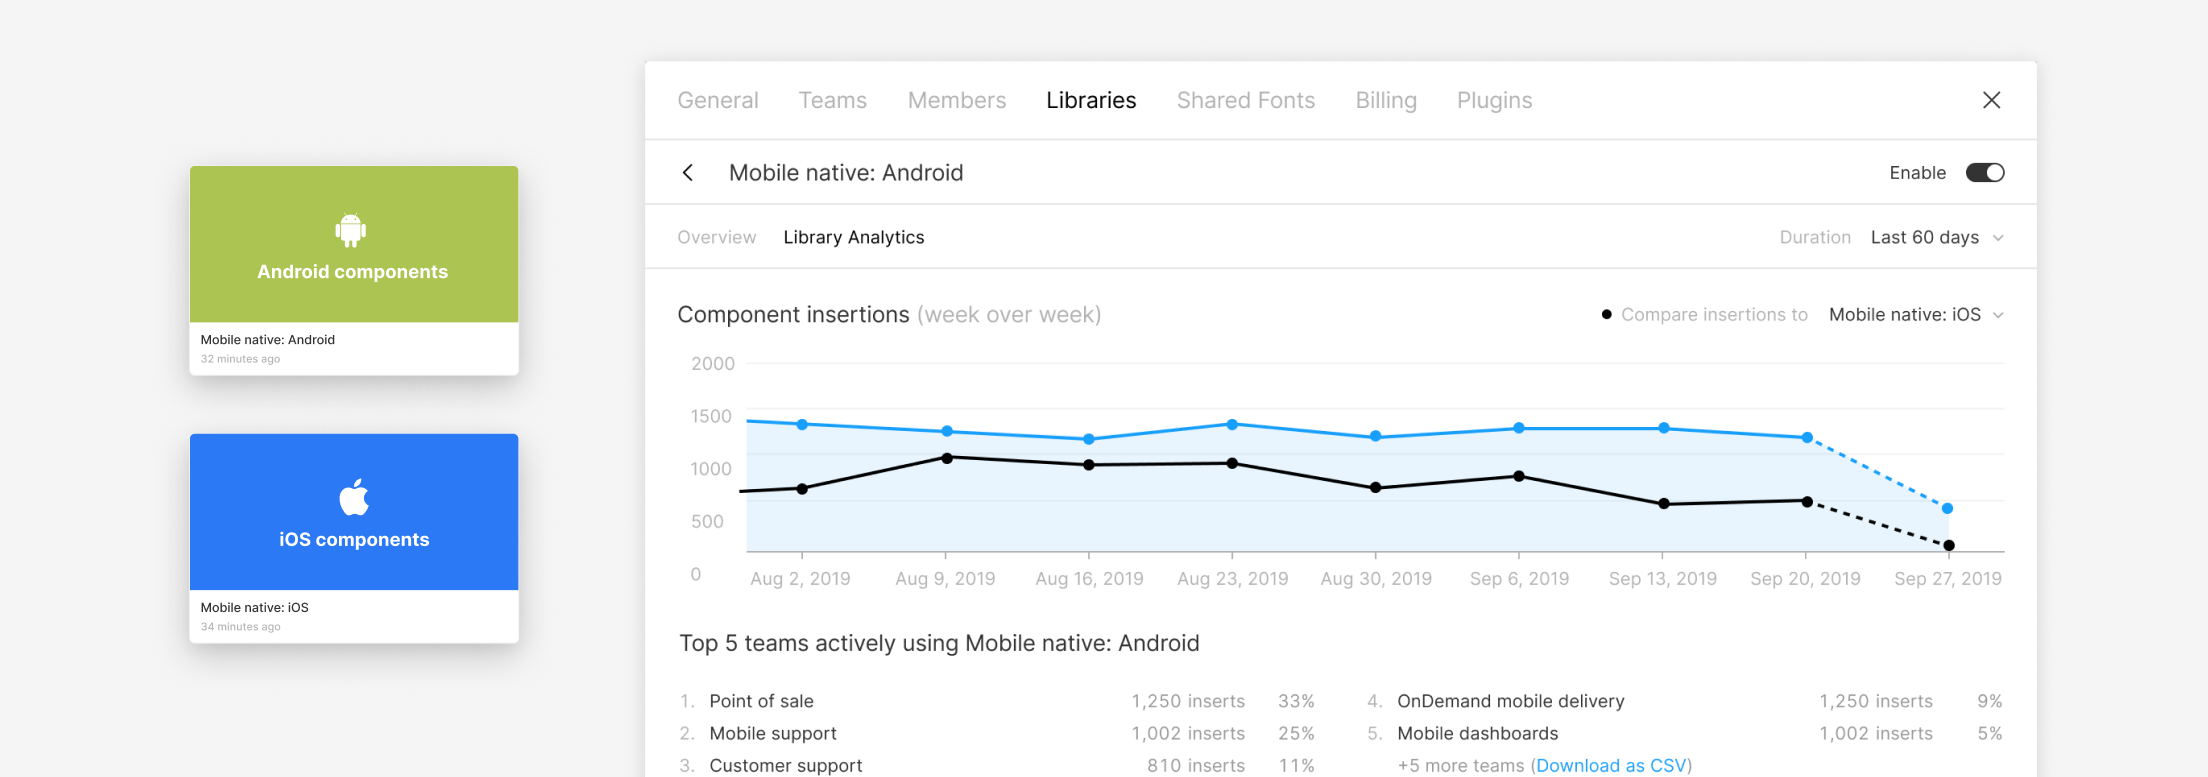
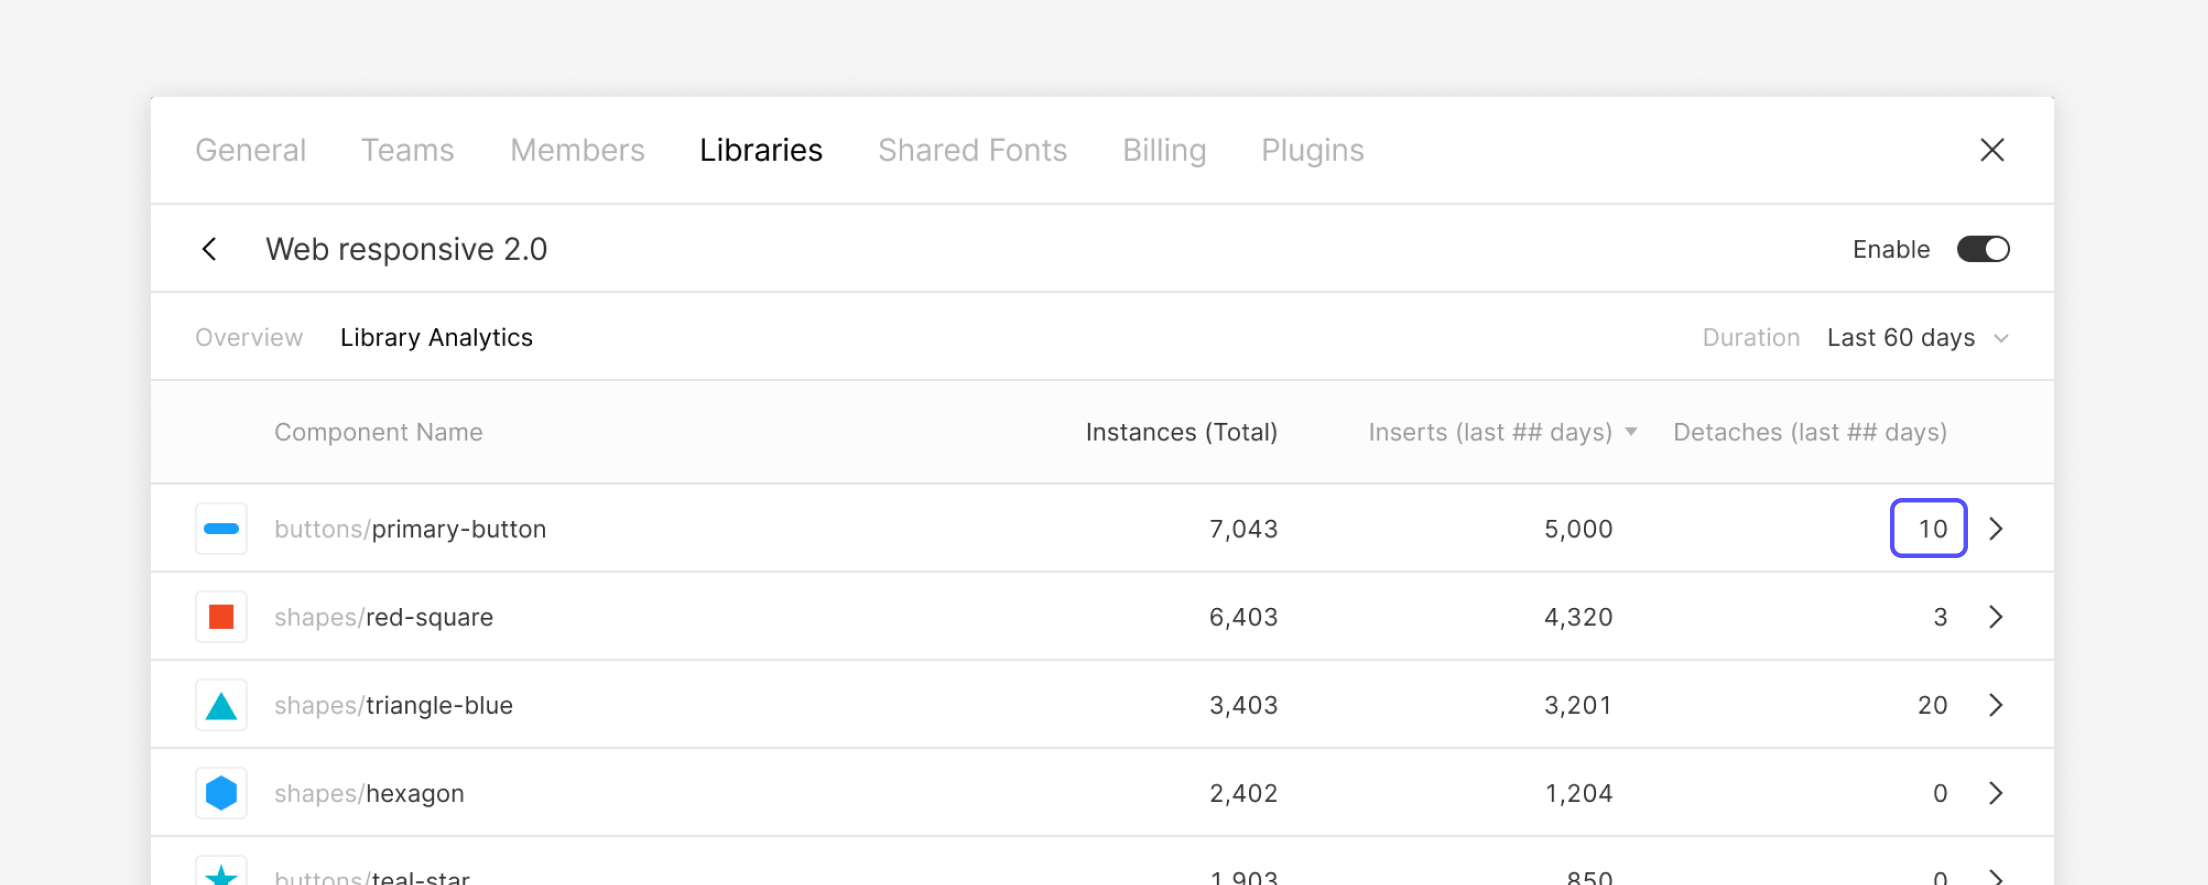
From here, you can click into any given library to see its analytics. The overview for each library includes a graph that shows component inserts from that library over time to indicate usage. You can also see two libraries side-by-side to compare usage between them. In addition, you’re able to see which components in a given library are being used the most, or least, by sorting the list of components within that library by number of inserts, total instances present across files, or detachments.
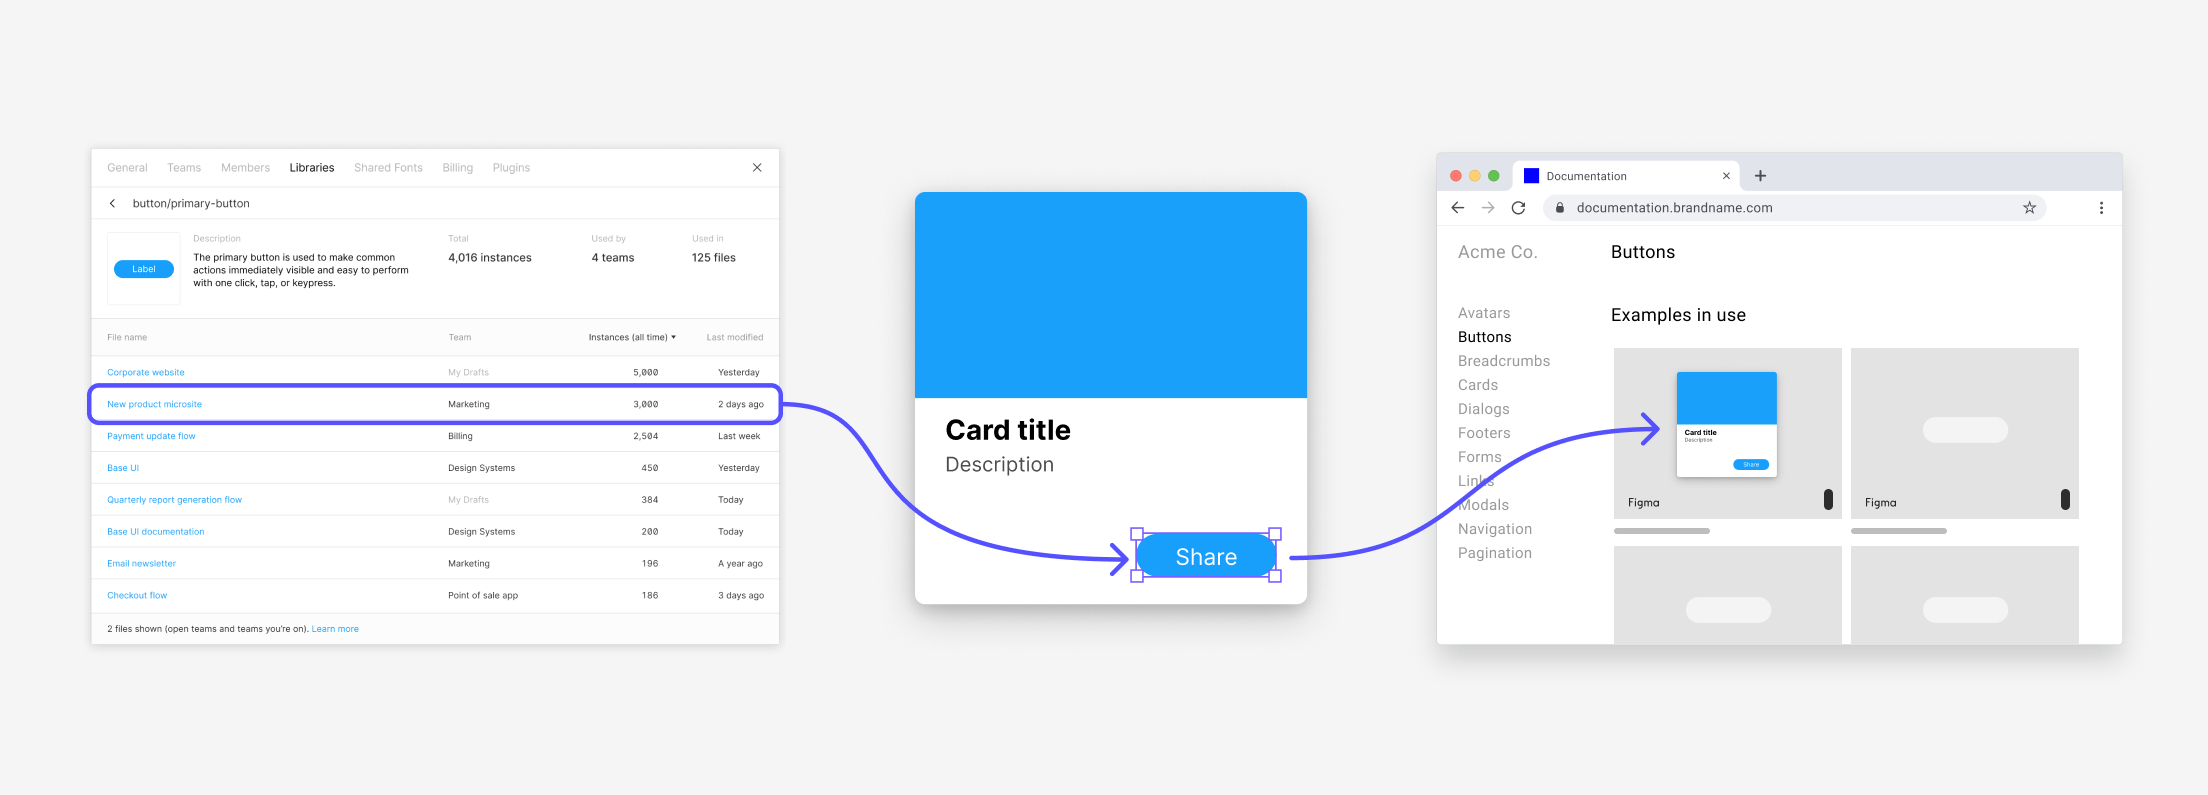
If you identify a component that you’d like to investigate further, you can click into the component level view which will include a thumbnail of the component as well as its description and total number of instances. In addition, you can see how many teams have used this component and explore the files it is currently in.
Five ways to make the most of Design System Analytics
It’s important to think through how you’ve set up your libraries and what you’re most interested in tracking in order to get the most out of Design System Analytics.
Here are some tips to get you started:
1. Consider your team structure
With the ability to create an unlimited number of teams on the Figma Organization tier, consider what level of usage information you would like to learn about your libraries. Design System Analytics can provide a breakdown of your library usage across teams, so for larger groups working within one team, if you desire more granular visibility into usage, consider dividing the work into smaller teams based on product focus or feature.

2. Create a new library when rolling out a new design system
If you’re looking to roll out a new design system, a brand new library will allow you to track adoption of your new system and continue to measure usage of your old one. This can help you assess the ongoing usage of a legacy library and make informed decisions about the right time to stop supporting and fully deprecate an existing library.

3. Build separate libraries to understand how your team designs for different platforms
If you’re interested in understanding how your team designs for different platforms or users, think about creating a different library for each. For example, you may want to create a library for iOS and a separate library for Android so you can ensure both platforms are being designed for equally. Since this approach also results in an increasing number of libraries, you should consider the trade-offs of having multiple libraries to maintain and the user experience of your designers.

4. Keep your original goals and context in mind when evaluating analytics
Using Design System Analytics to find and update frequently detached components is one of the most common use cases we’ve heard from customers. While this is a great way to use the feature, it’s important to keep your original intentions in mind when evaluating component usage. For example, certain components are designed to be detached (for instance, a template for an entire screen to use as a starting point), so a high detachment rate for those components is not necessarily a bad thing. In fact, it’s an indication that the component is being used appropriately. However, in other scenarios this could be an indication that a component is not meeting designers’ needs and requires further investigation.

5. Use analytics to look beyond the numbers
While the analytics themselves offer a number of interesting insights, you can also use Design System Analytics to supplement your design system documentation or to identify teams for additional context. If you click through to a component, you’re now able to access the files where this component is used, allowing you to easily grab real-life examples to share in your design system documentation. You can also identify which teams are using these components so you know who to follow up with for more qualitative feedback.

Getting started with Design System Analytics
We hope these tips help you think through which analytics you’re most interested in and how to make sense of the numbers for your organization.
For a quick overview of what you can do with Design System Analytics, check out this video.