 S. A. P. T. Samaraweera
 M. M. M. Najim
 Bader Alhafi Alotaibi
 Abou Traore4
- 1Department of Zoology and Environmental Management, Faculty of Science, University of Kelaniya, Kelaniya, Sri Lanka
- 2Faculty of Agriculture, Sultan Sharif Ali Islamic University (UNISSA), Tutong, Brunei
- 3Department of Agricultural Extension and Rural Society, College of Food and Agriculture Sciences, King Saud University, Riyadh, Saudi Arabia
- 4Department of Community Sustainability, College of Agriculture and Natural Resources, Michigan State University, East Lansing, MI, United States
Urban stormwater drains in Kurunegala City collect runoff and untreated wastewater, leading to public health problems. The Greater Kurunegala Sewage Treatment Plant (GKSTP) was commissioned in 2018 and currently operates at 73% of its capacity to combat public health issues. This study assessed the water quality of canals, comparing it with standards and pre-GKSTP conditions. Water samples were collected from seven sites during dry and wet seasons, and physicochemical parameters were measured. The data underwent spatial and temporal analysis using the general linear model (GLM). Additionally, cluster analysis and distance-based redundancy analysis were employed. The water quality index (WQI) was employed to evaluate the effectiveness of the treatment plant. The study revealed significant spatial and temporal variations in physicochemical parameters along the canals (p < 0.05, GLM), with higher pollution levels during wet months. The WQI improved from 35 (2005) to 49 at present, indicating enhanced water quality (p < 0.05, ANOVA), although it remains unsatisfactory. This study provides novel insights into the limitations of conventional wastewater treatment practices, demonstrating that merely treating wastewater and discharging it back into canals is insufficient. Research underscores the importance of rethinking treated wastewater reuse in achieving multiple sustainable development goals (SDGs). This approach offers a pragmatic path forward for enhancing water security and environmental sustainability globally.
1 Introduction
Water is used for household requirements, industrial and agricultural production, and electricity generation. Water use has grown globally in the past century, more than twice the population growth rate. A country’s level of development may drive water demand (Gbandi, 2022). People in rich countries use more water to meet their basic needs than those in underdeveloped countries, and thus, it leads to conflicts between nations. An adequate water supply in suitable quantity and quality has to be guaranteed in developing societies under all conditions and in a continuous pattern (Salameh, 2022). Subsequently, human activities that use water produce wastewater that pollutes the available water resources. Today, the increasing demand for water results in an increase in the quantity of wastewater produced worldwide. Therefore, wastewater treatment is becoming critically important.
Every year, 380 billion m3 of municipal wastewater is generated worldwide. Wastewater production is expected to increase 24% by 2030 and 51% by 2050 (Qadir et al., 2020). However, given the general perception that wastewater is a source of pollution that needs to be treated and eliminated, wastewater is seen as a growing problem rather than a valuable source of water, energy, and nutrients. A paradigm shift is underway, with developed countries actively interested in improving wastewater management. The goal is to go beyond minimizing pollution and find ways to recover wastewater. As a result, the wastewater treatment sector in developed countries has begun to move away from the mere treatment of wastewater at wastewater treatment plants (WWTPs). Instead, it has started to realize the potential of these plants as water reclamation facilities. These reclamation facilities can produce clean water, recover nutrients, and reduce fossil fuel consumption through the generation and use of renewable energy. Despite the opportunities, the global reality is that only a tiny fraction of the total wastewater generated is collected and treated, let alone extracted for resource recovery. It is estimated that more than 80% of global wastewater is released into the environment without adequate treatment, although the extent varies by region. According to United Nations Water, high-income countries treat, on average, about 70% of the wastewater they generate. This percentage drops to 38% in upper-middle-income countries and 28% in low-middle-income countries. In low-income countries, only 8% of wastewater is treated (Ryder, 2017).
The composition of wastewater varies worldwide based on many factors. It is an often-cited statistic that wastewater comprises 99% water and 1% suspended colloidal and dissolved solids (Lakshmi and Reddy, 2017). Wastewater may be composed of toxic pollutants introduced into our water supplies through industrial, agricultural, and anthropogenic activities, such as dyes, heavy metal ions, pesticides, chlorinated organic compounds, hormones, and drugs (Ali et al., 2021). Harmful bacteria and toxins may also be present in wastewater (Ganguly et al., 2021). Many developed and developing countries focus on generating and releasing wastewater to avoid different consequences. Those consequences include adverse human health effects associated with reduced water quality, negative environmental effects due to the degradation of water bodies and ecosystems, and potential effects on economic activities (Ryder, 2017). Effluent inputs generally impair water quality near wastewater discharge points, mainly by increasing water temperature, nutrients, and concentrations of trace organic contaminants and decreasing dissolved oxygen levels. Due to these basal resources, aquatic invertebrates and fish were negatively affected in various ways (e.g., biodiversity losses and replacement of sensitive with tolerant species).
Furthermore, there are abiotic impacts of effluent, such as changes in channel morphology and hydrology, the effects of effluent on plants and vertebrates, and the impact of effluent-induced perennialization on ephemeral streams (Hamdhani et al., 2020). An existing gap in knowledge is the limited focus on the post-treatment impacts of discharged treated wastewater on the water quality of receiving drains. Although the installation of the WWTPs aimed at addressing major pollution issues, there has been insufficient examination of how the treated water, once discharged into the canals, affects overall water quality. This lack of follow-up research leaves a critical void in understanding the secondary contamination and cumulative effects on the canal ecosystem.
However, the main problems related to water resources in Sri Lanka are the degradation and depletion caused by various anthropogenic activities (Bandara, 2003). Sri Lanka has constructed WWTPs in major industrial parks. The context of Sri Lanka as a developing country presents specific limitations. The financial constraints and infrastructural challenges inherent in developing nations often hinder comprehensive environmental monitoring and the implementation of advanced water management strategies. The treatment plants at Biyagama, Seethawaka, Horana, and Kandy are a few examples of WWTPs in Sri Lanka.
Despite the many benefits of WWTPs, water pollution remains a significant problem in many urban areas worldwide. Canals that flow through cities are affected by the discharge of different sorts of wastewater from different activities in those cities and suburbs. Previous findings show that pollutants severely impacted the water quality of canals passing through Kurunegala (Nishshanka et al., 2006; Jayakody et al., 2007; Rajapakshe et al., 2007), with high nitrate levels detected in many samples and high levels of BOD5, which were critical indicators of the health of aquatic ecosystems. At that time, a significant problem observed in the study area was the high level of fecal contamination in wastewater used for agriculture, particularly for paddy cultivation (Priyanka et al., 2007), diverted from the canals via the Wilgoda anicut, creating a significant health risk to agricultural workers and their families who were directly exposed to the contaminated water during cultivation. This problem had significant implications for public health and food safety, as using contaminated water in agriculture can lead to the transmission of waterborne diseases and threaten human health. Therefore, in the past, it was crucial to implement appropriate measures to mitigate the risks associated with using wastewater for irrigation. One possible solution was to improve wastewater treatment to reduce contamination levels before it is used for irrigation. As a solution, the Greater Kurunegala Sewage Treatment Plant (GKSTP) was introduced in 2018.
The GKSTP also treats wastewater and sewage and discharges them back to the Boo Streamlet, which drains into Maguru Oya (rivulet) in the municipality area of Kurunegala. At Wilgoda anicut (a masonry check dam constructed across a stream to impound water for maintaining and regulating irrigation), water is diverted for irrigation purposes. Currently, the GKSTP treats part of the wastewater generated from the city and discharges the treated wastewater back to the canal. Finally, treated and untreated wastewater from the city is collected at the Wilgoda anicut and diverted to paddy fields for irrigation, as depicted in Figure 1. Although wastewater treatment happens, even at present, the stagnating organic matter at the anicut adds a blackish color and an unpleasant odor to irrigation water. In addition, the excessive growth of aquatic plants near the anicut portrays nutrient availability in the canal water.
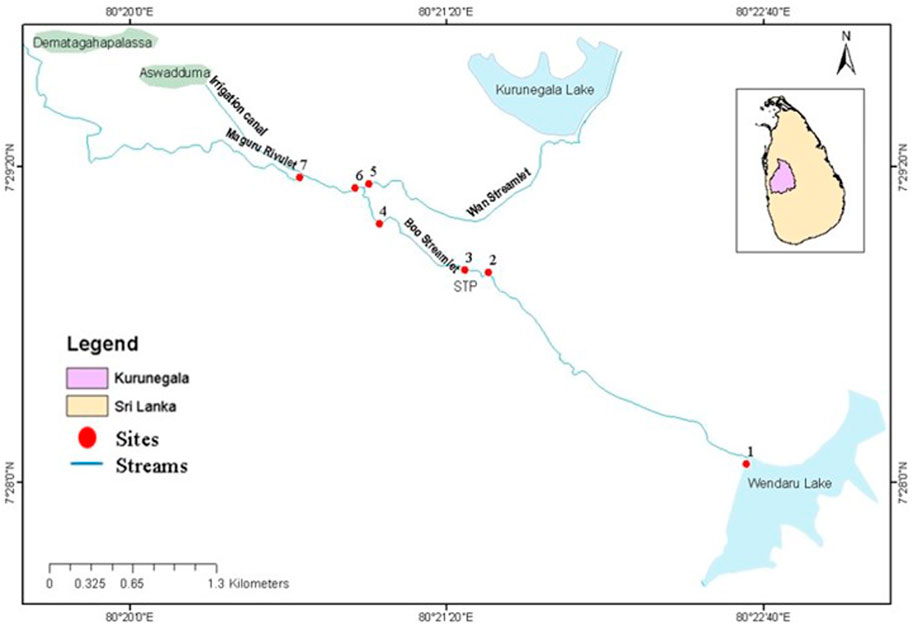
Figure 1. Map of sample sites. 1.Wendaru Lake, 2. upstream from the greater Kurunegala STP discharge point, 3. downstream from the STP discharge point, 4. Boo Streamlet before the confluence with Wan Streamlet, 5. Wan Streamlet before the confluence with Boo Streamlet, 6. Boo Streamlet after the confluence with Wan Streamlet, and 7. Wilgoda anicut.
Moreover, the upstream community still adds non-biodegradable solid waste into the canals that block the water diversion structure just above the anicut, causing water pollution that needs continuous cleaning. Therefore, the GKSTP was implemented to improve water quality in city canals by connecting key areas and treating 90% of municipal wastewater. This strategy addressed pollution-related issues, such as the accumulation of organic matter, nutrient pollution, and the disposal of non-biodegradable solid waste. However, subsequent assessments revealed that the desired outcomes were not fully achieved. This research, conducted between September 2022 and February 2023, aims to evaluate the current water quality of city canals and assess the quality of water diverted for irrigation. The study’s main objective is to identify the challenges the WWTP faces and suggest feasible solutions to attain the intended enhancements in water quality. This study seeks to establish a comprehensive framework for optimizing wastewater treatment processes and promoting sustainable water management practices by analyzing the WWTP’s efficiency and examining the factors contributing to the observed shortcomings.
2 Materials and methods
2.1 Study area
Kurunegala City, with a population of 122,172 in 2021, is located in the intermediate zone and has an area of 11 km2. Prominent rainy months in the Kurunegala area are April, May, and September–December. November is the wettest month (299 mm), whereas March is the driest (70 mm). The average annual rainfall in the Kurunegala City area is approximately 1850 mm. The annual temperature in the Kurunegala City area varies between 27°C and 30°C. The 8-km-long canal network starts from Wendaru Lake, passes through the city, and collects the stormwater generated within the city. The Boo Streamlet, originating at the Wendaru Lake, and the Wan Streamlet, originating upstream of the city, are two canals that carry wastewater from city discharges (Jayakody et al., 2007). Both Wan Streamlet and Boo Streamlet confluence, and part of the water is diverted from the Wilgoda anicut to irrigate Aswadduma, Kawdawaththa, and Dematagahapalassa paddy fields. With the establishment of the GKSTP, direct wastewater discharge to the Boo Streamlet from hospitals and municipality areas has ceased. In addition, a wastewater pump station near Kurunegala Lake allows the collection and transport of wastewater generated in the surrounding area to the GKSTP. As a result, the Wan Streamlet connected to the Kurunegala Lake, which was previously polluted with wastewater and sullage, is now assumed to experience a reduction in the amount of wastewater and pollutants discharged into it. Therefore, it is expected that the water quality of Wan Streamlet and Boo Streamlet has improved compared to their conditions before the establishment of the GKSTP.
2.2 Sampling
The sampling locations presented schematically in Figure 1 were selected considering the suitability of making discharge measurements and point sources of pollution. Since the water in the canal is highly heterogeneous, obtaining more than one sample is necessary to increase the study’s accuracy. As the canal is a dynamic system whose concentration will probably change over time, it must be sampled at many different periods to collect a representative sample. Prior knowledge of the spatial variation in pollutants (Ranaweera, 2005; Nishshanka et al., 2006) was considered to determine the sampling locations.
Water samples were collected from the seven locations during the daytime around 8.00–10.00 a.m. The monthly sampling, including the wet and dry seasons, was conducted from September 2022 to February 2023. Three grab samples were taken from mid-depth at the main flow line and combined to form a composite sample. A sampling device made of stainless steel is filled by slowly submerging the sampler into the water with minimum disturbance, and the water is transferred to the sample bottles of high-density polyethylene (HDPE). As such, 1 L of water was sampled from each location, and three replicates for each parameter were preserved, stored at 4°C temperature, transported to the laboratory, and tested. The parameters that may vary, such as surface water temperature, pH, electrical conductivity (EC), salinity, total dissolved solids (TDSs), chemical oxygen demand (COD), biological oxygen demand over 5 days (BOD5), dissolved oxygen (DO), total suspended solids (TSSs), and nitrate, were taken as the priority parameters for this study. A calibrated multiparameter HACH/Model: HQ40d was used to obtain in situ temperature, pH, EC, salinity, and TDS measurements. A calibrated DO meter (HACH/Model: HQ 30d) was used to measure in situ DO levels. To test BOD5, the 5210B 5-day BOD test method was used. COD was measured using the open reflux method, while TSS was measured using APHA-2540-D. Nitrate was measured using the 4500-NO3B Ultraviolet Spectrophotometric Screening Method (APHA, 2017).
2.3 Statistical analysis
The normality of the data was evaluated using the Anderson–Darling test, and square root transformation was employed to acquire normality. The general linear model (GLM), followed by Tukey’s pairwise comparison at a 5% significance level, was used to determine the significance of the temporal and spatial variations in the studied water quality parameters. A cluster analysis (based on Euclidean distance) was used to analyze the clustering status of the studied sites based on the overall water parameters. An analysis of similarities (ANOSIM) was used to evaluate the significance of the clustering status of sampling sites. The water quality index was calculated based on NSF-WQI using pH, temperature, BOD5, TDS, and nitrate–nitrogen. The NSF-WQI calculator is available online at http://www.waterresearch.net/index.php/water-treatment/watermonitoring/monitoring-the-quality-of-surfacewaters and https://www.knowyourh2o.com/outdoor-3/water-quality-index-calculator-for-surface-water (Cisneros Ontiveros et al., 2021). This index represents overall water quality and does not specifically address water use capacity. Several index parameters have unique significance; thus, a weighted average is beneficial for calculating the index. In this study, the weightage factors used are as follows: pH (0.11), BOD (0.11), temperature (0.1), nitrate–nitrogen (0.1), and total dissolved solids (0.07). These weightages are consistent with those used in previous studies by Kumar and Nirmal (2011), Al-Mutairi et al. (2014), and Călmuc et al. (2018). The temperature change refers to the temperature difference between upstream and downstream control sites. The weighted score (Wi) should be expanded using the sub-index value (SI) of the parameter acquired with the NSF-WQI; this expanded score is then summed using the index equation (Li, 2014):
where NSF-WQI is the score of the water quality index; SI is the sub-index value, and Wi is the weighted score (all calculated using the index calculator). The wide variety received from making use of the index is classified into five scale classes: WQI < 25 indicates very bad, 50 > WQI > 24 indicates bad, 70 > WQI > 49 indicates medium quality, 90 > WQI > 69 indicates good, and WQI > 89 depicts significantly excellent water. The results were compared with the water quality index values calculated from the water quality parameter values of canals before establishing the GKSTP (Ranaweera, 2005) and with the National Ambient Water Quality Standards (NAWQS) of Sri Lanka.
3 Results
3.1 Spatial and temporal variations in physicochemical parameters
The mean values of the studied water quality parameters at the seven sites in Kurunegala City depict significant variations among different sites (Table 1). The temperature ranged from 25.8°C to 27.0°C, suggesting a notable spatial variation. The results of the GLM indicated that the temperature denotes significant differences among the sampling sites at a 5% significance level, as shown in Table 1 (p < 0.05). Site 3 exhibited the highest mean temperature, possibly due to receiving warmer discharged water from the sewage treatment plant (STP) and exposure to direct sunlight. Conversely, site 4 displayed the lowest temperature, likely attributed to shading from surrounding trees and sand mining-induced increased water depth. The study aligns with prior research (Figueroa-Nieves et al., 2014), which observed higher water temperatures in WWTP effluents than in streams. The mean DO values ranged from 3.12 ppm to 6.15 ppm. The range of dissolved oxygen levels is relatively narrow, with a difference of less than 3.03 units between the highest and lowest values. The lowest dissolved oxygen level (3.12 ppm) at site 5 is lower than the typical range for healthy aquatic ecosystems, usually approximately 4–6 ppm. The highest dissolved oxygen level (6.15 ppm) at site 3 is within the typical range for healthy aquatic ecosystems. Sites 2, 4, and 6 have dissolved oxygen levels that fall within this range. Based on these results (p < 0.05, Table 1), some sites may have lower dissolved oxygen levels than others, which could indicate environmental stressors. Site 3 had the highest DO, attributable to its downstream position from the GKSTP discharge and higher flow rates. Site 5 displayed the lowest DO, potentially due to rampant pollution in the Wan Streamlet caused by inadequate sanitation facilities and open defecation in nearby slum areas. The pH values recorded across all sites fell within the optimal range (6.0–8.5) for aquatic life and various potential uses. The mean BOD5 values ranged from 7.28 ppm to 16.91 ppm, indicating significant variation in the amount of organic matter in the water across different sites (p < 0.05, Table 1). The highest BOD5 value is observed at site 5, while the lowest is at site 1. The average BOD5 value for the canals was 10.94 ppm. The BOD5 values for sites 5 and 7 are above average, indicating relatively more organic matter in the water at these sites. The BOD5 values for sites 1, 2, 3, 4, and 6 are below average, suggesting that the organic matter content in the water at these sites is relatively lower. Elevated BOD5 levels at sites 3, 4, 5, 6, and 7 raised concerns as high organic matter content can lead to decreased DO levels, threatening aquatic life. Site 5, with the highest BOD5 and lowest DO, highlights the inverse relationship between these parameters. The increased BOD5 levels can be attributed to uncontrolled pollutant inputs, including those from areas not connected to wastewater treatment facilities. Incomplete sewer coverage and limited pump station services contribute to organic matter accumulation in the canals. The COD values ranged from 38.9 ppm to 84.7 ppm, indicating a variation in the amount of organic matter in the water across different sites (p < 0.05, Table 1). The highest mean COD value is observed at site 1 (84.7 ppm), while the lowest mean value is observed at site 6 (38.9 ppm). The average COD value for the canals is 61.5 ppm. The mean COD values for sites 1, 2, and 4 are above average, indicating relatively more organic matter and high levels of inorganic pollutants that can chemically oxidize in the water at these sites. In contrast, the mean COD values for sites 3, 5, 6, and 7 are below average, suggesting that the organic/inorganic matter content in the water at the sites is relatively lower. Heavy commercial activity at sites 2, 3, 4, and 5 contributes to elevated COD values due to effluent discharge containing organic and inorganic pollutants. As seen at site 2, agricultural runoff further contributes to COD levels. Municipal sewage discharge, typical in urban areas, also significantly affects COD levels. Site 1 exhibits high COD due to domestic tank water usage for bathing and washing, introducing pollutants. The mean nitrate values ranged from 0.04 ppm to 0.87 ppm. The range of mean nitrate levels is quite large, with a difference of nearly 0.83 units between the highest and lowest values. The highest nitrate level (0.87 ppm) is relatively high and could indicate pollution or excessive nutrient inputs. The lowest mean nitrate level (0.04 ppm) is within the typical range for healthy aquatic ecosystems. The other nitrate levels fall within the range of typical values for nitrate in surface waters. Based on these results, some sites may have higher nitrate levels than others (p < 0.05, Table 1), which could indicate environmental stressors. Nitrate levels at all sites fall within acceptable limits. According to Estévez et al. (2019), urbanization and agriculture are the main drivers of the high salinity in freshwater. In this study area, these two are the main reasons for the spatial variation in salinity. The mean salinity values ranged from 0.06 PSU to 0.19 PSU. Based on the mean salinity values, there is a significant difference in salinity values between different sites in the canal (p < 0.05, Table 1). Sites 1 and 2 have relatively low salinity levels, while sites 3 and 5 have higher salinity levels. Sites 4, 6, and 7 fall somewhere in between. An increase in salinity leads to an increase in the TDS of freshwater (Ferdous et al., 2019). The current study results supported this relationship, as site 3, with the highest salinity, also had the highest TDS. The study results indicate a negative correlation between TSS and DO in the water. Site 5, which had the highest TSS, had the lowest DO, possibly due to increased water temperature from sunlight absorbed by the suspended particles.
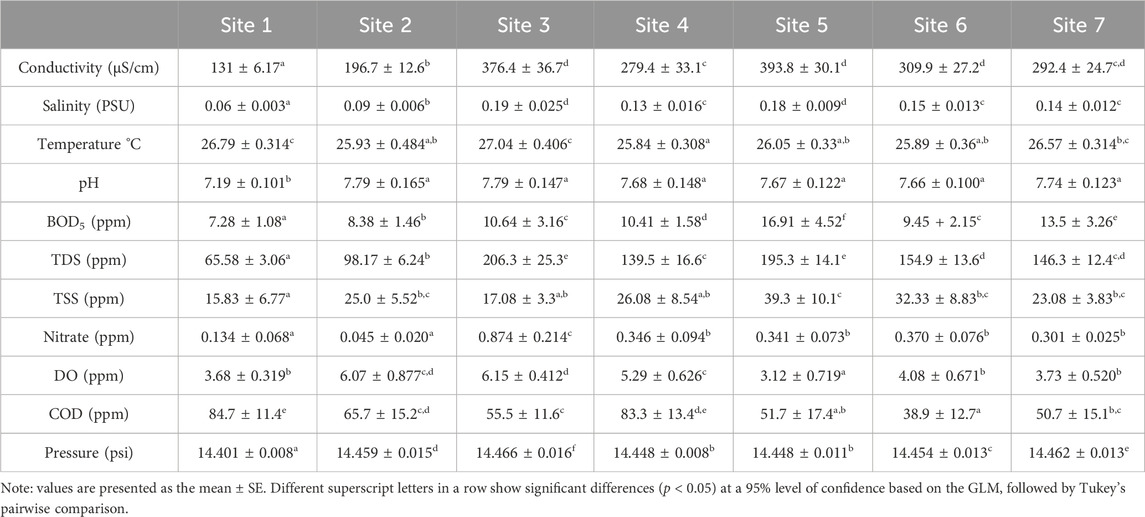
Table 1. Spatial variation in physicochemical parameters of water (mean ± SE) at the study sites, Kurunegala, 2022–2023 (n = 6).
Table 2 shows the temporal variation in physicochemical parameters in water canals, which was analyzed over 6 months (p < 0.05, GLM). The temporal variation in water temperature in the canals showed that there were significant differences in temperature between the months (p < 0.05, Table 2), with September having the highest mean temperature (27.45°C ± 0.276°C) and January having the lowest (24.53°C ± 0.173°C). The high water temperature in September may be due to increased solar radiation, while the low water temperature in January may be due to having more rainy days. For example, the decreased stream temperatures during and after rainfall runoff are well-established and confirmed by multiple studies, including Isaak et al. (2010); Kieser (2015), which further supported this relationship. The temporal variation in dissolved oxygen levels in the canals revealed significant differences in DO levels between the months (p < 0.05, Table 2), with November having the highest mean DO value (6.22 ± 0.48 ppm) and October having the lowest (2.45 ± 0.52 ppm). Temporal fluctuations in DO were observed, with lower levels in October linked to organic matter decomposition. They decreased oxygen solubility in warmer water and reached higher levels in November due to cooler temperatures and increased oxygen solubility, consistent with findings by Dębska et al. (2021). Statistical analysis revealed that there were significant differences in pH values between the months (p < 0.05, Table 2), with September having the highest mean pH value (8.43 ± 0.13) and October having the lowest (7.12 ± 0.06). Elevated pH in September could be attributed to increased photosynthesis and algal growth during drier periods.
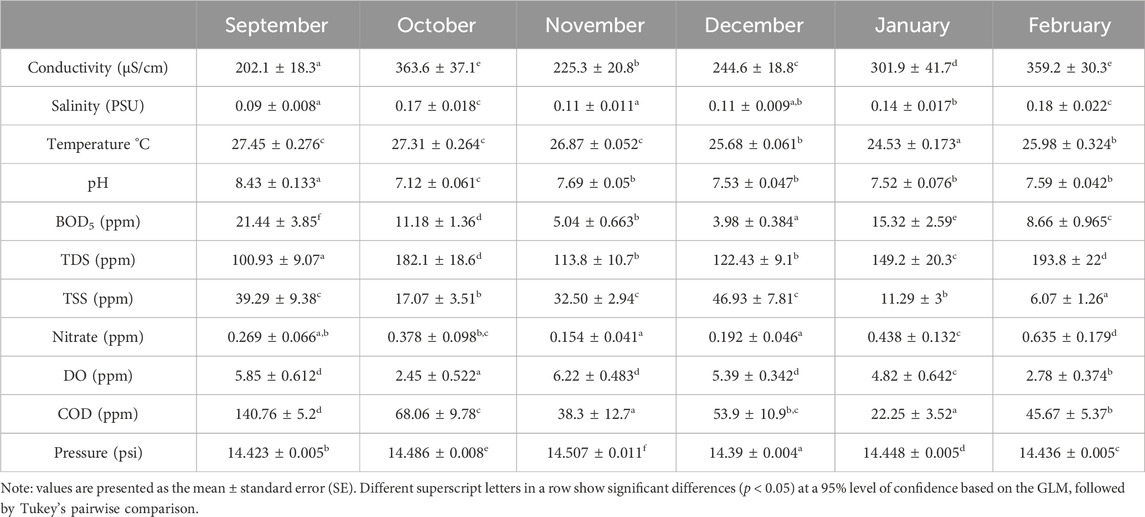
Table 2. Temporal variation in physicochemical parameters of water (mean ± SE) at the study sites, Kurunegala, 2022–2023 (n = 6).
In contrast, a lower pH in October may result from increased rainfall and runoff, which introduce acidic substances. Several studies have reported a positive correlation between photosynthesis and high pH levels. For example, a study of abnormal pH elevation in the Chaobai River stated that their calculations indicated that photosynthesis and denitrification were the primary reasons for the increase in pH in the Jian and Chaobai rivers (He et al., 2017). The temporal variation in biological oxygen demand showed significant differences in BOD5 levels between the months (p < 0.05, Table 2), with September having the highest mean BOD value (21.44 ± 3.85 ppm) and December having the lowest (3.98 ± 0.38 ppm). High BOD5 in dry months (e.g., September) results from enhanced microbial activity.
In contrast, lower BOD5 during rainy months (e.g., December) is associated with dilution effects caused by increased water flow and lower temperatures. This pattern aligns with the findings from a study in Malaysia (Fatema et al., 2014). Water quality analysis by Kamarudin et al. (2020) also showed that BOD was high in the dry season. The temporal variation in COD levels in the canals showed significant differences in COD levels between the months (p < 0.05, Table 2), with September having the highest mean COD value (140.76 ± 5.20 ppm) and January having the lowest (22.25 ± 3.52 ppm). In Kurunegala canals, high September COD levels are due to increased organic matter from agricultural activities during the Yala cropping season, a season associated with the southwest monsoon (May–August).
Conversely, lower January COD levels are linked to reduced organic matter inputs during the dry season. Statistical analysis revealed significant differences in the salinity levels between the months (p < 0.05, Table 2). However, despite these differences, the variation in salinity levels between the months was not substantial. The highest salinity observed in February may be due to the low rainfall and high evaporation rate during that month, which is supported by Baskar et al. (2022), who indicate the maximum salinity value recorded during the summer season could be attributed to the low rainfall and a higher evaporation rate.
The conductivity measurements suggest that the mean EC values are significantly different between the seven sites (p < 0.05, Table 1), with some sites having higher levels of dissolved solids or pollutants than others. The temporal variation in conductivity was also significant (Table 2). Specifically, the mean conductivity value in October (363.6 ± 37.1 μS/cm) was the highest, and the conductivity in September (202.1 ± 18.3 μS/cm) was the lowest, as determined by the GLM (p < 0.05, Table 2). EC variations coincide with precipitation, with higher values in wetter months (October). Fatema et al. (2014) reported on the temporal variation in EC values in an estuary, whereby higher values were observed during the rainy season as opposed to the dry season. These findings are consistent with the impact of continuous flush-off of effluent during rainfall, which can increase the discharge of pollutants into the estuary. Therefore, it can be concluded that effluent discharge during rainfall can contribute to changes in water quality parameters, such as EC, which may have significant ecological implications. The TDS values ranged from 65.58 ppm to 206.3 ppm. Based on the mean TDS values, there appears to be a significant spatial variation in the TDS levels in the canal (p < 0.05, Table 1). Sites 1 and 2 have relatively low TDS levels, while sites 3, 5, and 6 have higher TDS levels. Sites 4 and 7 fall somewhere in between. The temporal variation in total dissolved solids in the canals revealed significant differences in TDS levels between the months (p < 0.05, Table 2), with February having the highest mean TDS value (193.8 ± 22.0 ppm) and September having the lowest (100.93 ± 9.07 ppm). TDS variations relate to evaporation and dilution, with higher levels in February due to increased evaporation rates compared to September. For example, the study conducted by Ngabirano et al. (2016) on gravity flow water in Uganda found that the highest mean TDS value was observed during the dry season. The TSS values ranged from 15.8 ppm to 39.3 ppm. Based on the TSS values, there appears to be some spatial variation in the TSS levels in the canal. Sites 1, 3, and 7 have relatively low TSS levels, while sites 5 and 6 have higher TSS levels. Sites 2 and 4 fall somewhere in between, and there is a significant difference between the mean TSS values of the sites (p < 0.05, Table 1). Analysis of the data revealed that TSS levels varied significantly between the months (p < 0.05, Table 2), with the highest mean value (46.93 ± 7.81 ppm) occurring in December and the lowest in February (6.07 ± 1.26 ppm). TSS fluctuations are significant, with peak levels in December and lower levels in February. High TSS in December is due to increased surface runoff and agricultural erosion during the wet season. In contrast, lower February TSS is due to reduced sediment inputs during the dry season, which aligns with principles of water quality and the impact of hydrological changes during different seasons, consistent with the findings of Ngabirano et al. (2016).
3.2 Clustering of the study sites based on overall physicochemical parameters and dbRDA analysis
Based on the dendrogram of the cluster analysis (Figure 2), four major clusters of study sites could be identified. The global R-value of 0.971 resulted from the ANOSIM, which confirmed the statistical significance of the above clustering status at a significance level of 5%.
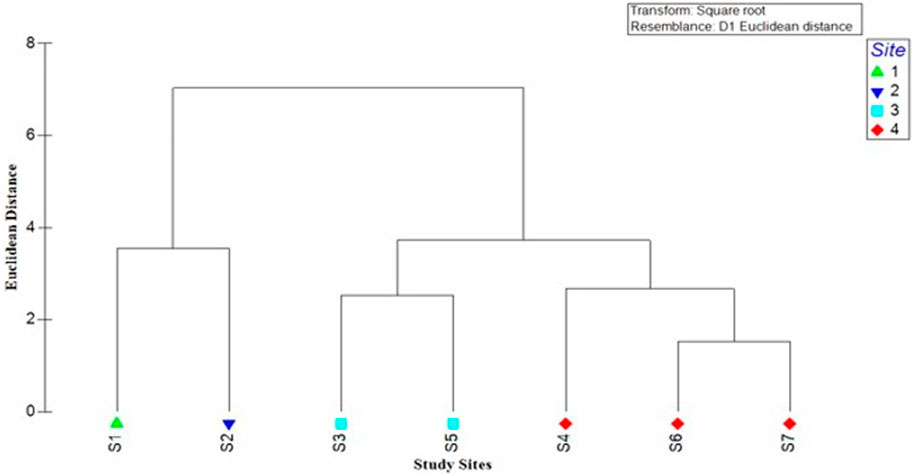
Figure 2. Dendrogram showing the clustering of study sites based on the overall physicochemical parameters of water in Kurunegala City canals (n = 6 at each site) between the seven study sites from September 2022 to February 2023.
The outcomes of the dbRDA analysis explained the major water quality parameters behind the overall variability of the study sites (Figure 3). The dbRDA1 axis accounted for 91.2% of the overall variability of the dataset, followed by the dbRDA2 axis (5.0%), explaining 96.2% of the overall variability and suggesting a good fit. The dbRDA1 axis was mainly influenced by conductivity (−0.894) and TDS (−0.415), with both parameters having a strong negative influence.
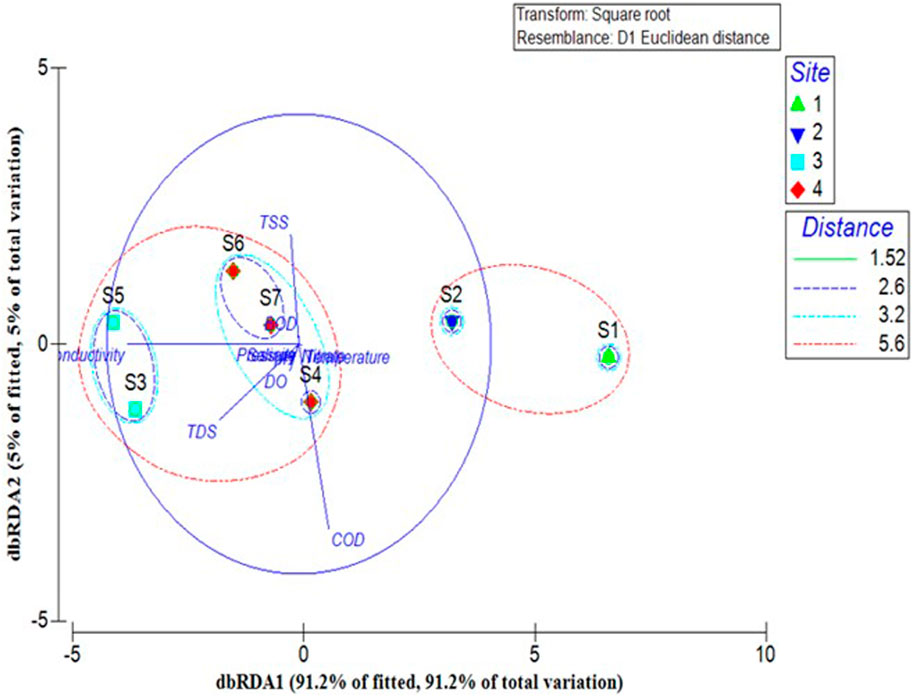
Figure 3. Ordination of the study sites based on the dbRDA analysis.
Meanwhile, COD (−0.805), TSS (0.476), and DO (−0.117) remained the most influential parameters for the dbRDA2 axis. As suggested by the radiating arms of the dbRDA plot and the respective loadings, it was evident that study sites S1 (84.7 ± 11.4 ppm), S2 (65.7 ± 15.2 ppm), and S4 (83.3 ± 13.4 ppm) were characterized with higher COD values, while S3 and S5 sites were characterized with higher conductivity (376.4 ± 36.7 μS/cm and 393.8 ± 30.1 μS/cm, respectively) and TDS (206.3 ± 25.3 ppm and 195.3 ± 14.1 ppm, respectively) values. Meanwhile, S6 and S7 sites were characterized by moderate levels of BOD5, conductivity, TDS, and TSS, as shown in Figure 3.
Considering the variation in all the parameters measured, it becomes clear that there is significant spatial and temporal variation in the physicochemical properties of the water canal, influenced by a range of factors. The findings of the cluster analysis (Figure 2) and dbRDA (Figure 3) denoted the clustering patterns of the study sites based on overall water quality parameters. Site 1 is the least polluted (WQI of 53), while site 5 is the most polluted (WQI of 46). Sites 6 and 7 formed a sub-cluster at a Euclidean distance of 1.52, indicating that the water quality parameters at these sites are similar, which could be due to the mixing of two water canals, Boo Streamlet and Wan Streamlet, after confluence (at site 6), diluting the pollutants and contaminants present in the water, leading to a reduction in their concentrations. However, the effluent from neighboring areas, which is not connected to the sewerage network, accumulates in the canals, leading to a moderate pollution level, as shown in Figure 3. However, the moderate similarity between S3 and S5 at an Euclidean distance of 2.52 in water quality parameters was unexpected. Site 3 is located after the treated water discharge and is expected to have better water quality than site 5, the most polluted canal. The similarity between these sites may be due to the direct discharge of untreated effluents from the paying wards of the ayurvedic hospital near the treatment plant. However, as a whole, the results of GLM were further confirmed by the results of the cluster and dbRDA analyses.
3.3 Water quality index
The water quality findings of the current study are compared with those of the previous study sites (Ranaweera, 2005), which studied similar sites, as shown in Figure 4. The location of the water samples collected in the canal observed in study point 1 in the previous paper is similar to that in the current study site 1. Similarly, the location of the water samples collected in the canal in the previous paper’s study point 2 is comparable to those in the current study site 3, particularly in terms of the water flow observed within the city. Moreover, the previous paper’s study points 3, 6, 7, and 8 are comparable to the current study sites 4, 5, 6, and 7 based on the canal distribution within the city.
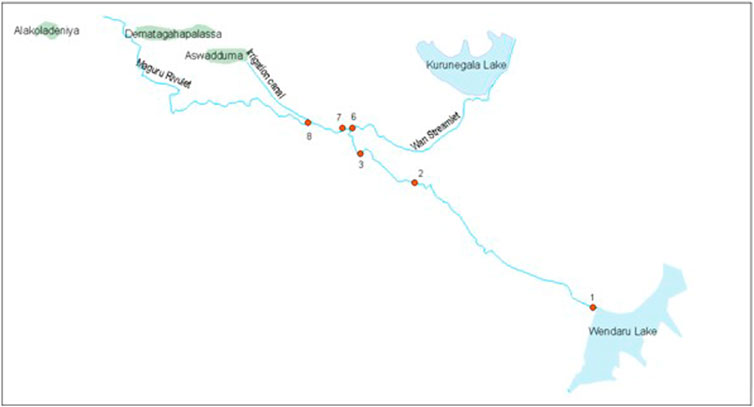
Figure 4. Sample sites of the previous study (Ranaweera, 2005).
The WQI values calculated from the previous study (Ranaweera, 2005) indicated that the WQI values for sites 1, 3, 4, 5, 6, and 7 were relatively low, ranging from 30 to 43. However, with the establishment of a wastewater treatment plant, there has been a noticeable improvement in the WQI values. The WQI values of the canals ranged from 46 to 53 after the commissioning of GKSTP, as depicted in Figure 5. An increase in the WQI score indicates an improvement in the overall water quality at all sites. The magnitude of the improvement can be assessed by calculating the difference between the before and after WQI values. Overall, the data suggest that the intervention has positively affected the water quality across the sites tested (p < 0.05, ANOVA). Generally, the WQI ranges vary depending on the region and the intended use of the water.
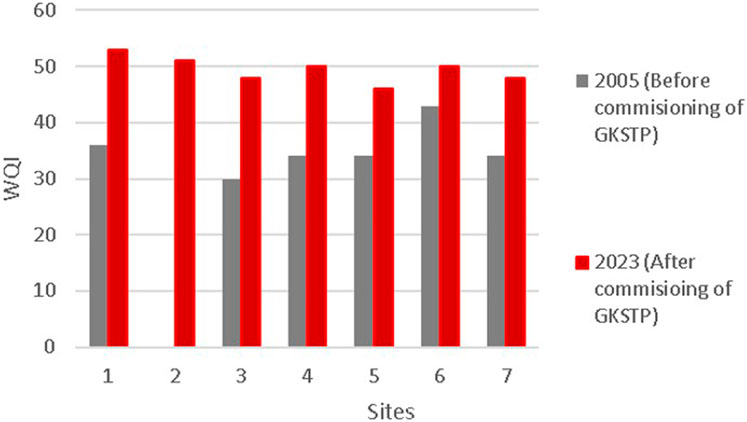
Figure 5. Water quality index of Kurunegala City canals, September 2022–February 2023.
The National Water Quality Standards in Sri Lanka guide surface water quality for various uses, including water supply, irrigation, and aquatic life protection. The WQI values were calculated based on multiple water quality parameters, including temperature, pH, biochemical oxygen demand, total dissolved solids, and nitrate nitrogen. Although the WQI is not a comprehensive indicator of the health of a water body, it shows that even with a sewage treatment plant in place, the water must still meet specific standards for irrigation purposes. However, the treated water again becomes contaminated after being added to polluted canals. Additionally, the effectiveness of the GKSTP is also affected by its design (which includes a coarse screen, fine screen, grit chamber, balancing tank, anoxic and aerobic tank, secondary settling tank, disinfecting tank, sludge treatment, and deodorization treatment), operation, and insufficient maintenance or outdated technology (such as not using the latest technology like reverse osmosis), which can cause a decrease in efficiency over time. Another factor contributing to the ineffectiveness of sewage treatment plants is the presence of a high level of pollutants in the incoming wastewater, which can overwhelm the treatment process and result in lower removal rates.
Moreover, insufficient treatment capacity or underfunding can also lead to inadequate treatment and, ultimately, reduced effectiveness in improving water quality. These examples have shown limitations or challenges in improving water quality through GKSTP. Similarly, a case study of South Africa has provided comparable reasons for the lack of adequate wastewater treatment (Edokpayi et al., 2017).
3.4 Comparison of water quality parameters between the present study and the National Ambient Water Quality Regulations, No. 01 of 2019 Sri Lanka
A study on Moragoda Streamlet, Kepu Streamlet, and Mahamodara Lake has consistently indicated suboptimal water quality levels compared to the required standards for diverse applications. The mean concentrations of COD and BOD5 were measured in these water bodies, and both BOD5 and COD values exceeded established ambient water quality standards applicable to inland waters in Sri Lanka. The degradation in water quality across these sites can be attributed to several shared factors, including the prevalence of numerous industries, institutions, and commercial entities alongside densely populated areas and unauthorized community activities, as elucidated by Madushanka et al. (2012). Furthermore, a separate case study conducted by Priyanka et al. (2007) in the context of the Wattegama Water Supply Scheme in Kandy reaffirmed concerns about water quality standards. This study found that water quality within the catchment area exceeded the regulations outlined in the National Environmental (ambient water quality) Regulations concerning physical and microbiological parameters.
Similarly, the present study delves into the suitability of sites within Kurunegala City canals post-establishment of the treatment plant following the National Ambient Water Quality Regulations, No. 01 of 2019. In Table 3, “√” depicts that all the study sites are ideal for the relevant categories of NAWQS, whereas “Χ” depicts that all the sites are not within the acceptable range for the relevant categories.
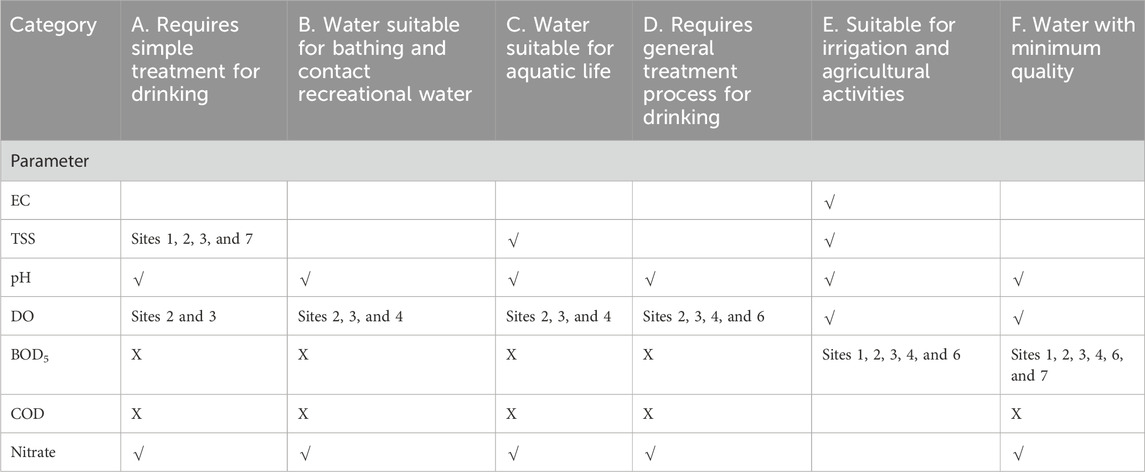
Table 3. Site suitability according to the National Ambient Water Quality Regulations, No. 01 of 2019.
Previously, the Kurunegala City canals faced notable water quality issues, resulting in a lower WQI than in the period following the establishment of the GKSTP (Figure 5). It reveals that water treatment processes contribute to a noticeable improvement in water quality. The study highlights consistent deviations from the acceptable range of specific parameters, notably BOD5, from NAWQS. Elevated BOD5 levels signify higher concentrations of organic pollutants, rendering the water unsuitable for agriculture and irrigation due to its diminished quality. Such deviations pose significant risks to both public health and the environment. Increased BOD5 levels can lead to oxygen depletion in water bodies, negatively impacting aquatic ecosystems and biodiversity.
Moreover, contaminated water used for agriculture and irrigation can introduce pollutants into the soil and crops, potentially endangering food safety and public health. Addressing these persistent deviations requires targeted interventions to mitigate pollution sources and enhance water treatment processes, ensuring compliance with NAWQS and safeguarding human health and environmental integrity. However, it is essential to note that this improvement remained marginal compared to the conditions observed before the GKSTP was established. These findings underscore the persistent challenge of maintaining water quality standards due to complex environmental factors and the need to refine water treatment methods to align with local and global water quality benchmarks.
4 Discussion
The dbRDA analysis depicted the major water quality parameters contributing to the overall variability observed across different study sites in this study. The dbRDA1 axis accounted for 91.2% of the overall variability in the dataset. The significant contribution of dbRDA1 suggests that specific water quality parameters, likely related to pollution sources such as wastewater effluent and illegal oil discharges, are the predominant factors influencing water quality, highlighting the critical areas for targeted interventions. The dbRDA2 axis explained an additional 5.0% of the variability, cumulatively accounting for 96.2% of the overall variability when combined with dbRDA1. Although dbRDA2 contributes less to the overall variability, it still represents secondary factors that might include site-specific characteristics or fewer impact pollutants, suggesting primary factors are universal across sites, local conditions, or less prevalent pollutants also play a role in water quality. The high goodness of fit (96.2%) reinforces the reliability of the identified parameters as key indicators of water quality, providing a solid basis for future monitoring and management strategies. As implications for water management, the findings suggest that addressing the primary factors identified by dbRDA1 could lead to significant improvements in water quality.
Furthermore, the variability explained by dbRDA2 indicates the need for tailored strategies to address local conditions and lesser-impact pollutants involving localized treatment solutions or community-specific waste management practices. Moreover, the parameters identified through dbRDA analysis should be integrated into regular monitoring programs to track water quality trends and the effectiveness of implemented measures.
Furthermore, the results of this study offer a thorough evaluation of the water quality in city canals, highlighting advancements and persistent challenges following the implementation of a WWTP. The pH levels of the canal water after treatment were determined to be within the alkaline range. Alkaline pH could be due to the specific treatment methods employed, which might involve adding chemicals that elevate the pH. Although alkaline pH is generally not detrimental, it can impact the solubility and toxicity of other contaminants, indicating the necessity for optimizing the treatment process to adjust the pH to a neutral level suitable for aquatic organisms. Despite the functioning of the treatment plant, pollution levels remain notably higher during the rainy season compared to the dry season. This seasonal fluctuation implies that the runoff during the wet season, which can transport additional pollutants into the canals, may surpass the treatment capacity, emphasizing the importance of enhancing stormwater management techniques and potentially installing extra treatment facilities or buffer zones to alleviate runoff impacts. The assessment of the WQI at different locations displayed significant variations. Wendaru Lake exhibited the highest WQI value of 53, indicating relatively superior water quality among the sites examined. Conversely, Wan Streamlet displayed the lowest WQI value of 46, representing the poorest water quality. Boo Streamlet and Wilgoda anicut had intermediate WQI values of 49.6 and 48, respectively. These results suggest spatial differences in water quality, likely influenced by local sources of pollution and hydrodynamic conditions. A comparison of the water quality parameters with the NAWQS indicated that most parameters did not meet the acceptable ranges. Nevertheless, the implementation of the WWTP resulted in notable enhancements in various key parameters, such as BOD5, TSS, temperature, salinity, and nitrate levels. These reductions signify eliminating organic matter-suspended particles and reducing nutrient loads efficiently. The establishment of the WWTP has significantly improved the overall WQI of the canal water, increasing from a pre-treatment value of 35 to a post-treatment value of 49. This improvement suggests that the treated wastewater is of higher quality compared to untreated water. However, the current WQI still categorizes the water quality as “bad” (50 > WQI > 24), indicating the necessity for further enhancements to achieve good water quality. Despite general progress, there are still ongoing challenges with parameters such as pH, TDS, and conductivity. The consistently high levels of TDS and conductivity may indicate that dissolved salts and other inorganic substances are not entirely removed, suggesting adjustments or enhancements to the current treatment processes may be necessary to tackle these specific issues effectively.
The water quality findings of the current study were compared with the values reported previously by Ranaweera (2005) at similar sites. Specifically, the previous study points (Figure 4)—1, 2, 3, 6, 7, and 8—are comparable to the current study sites (Figure 1)—1, 3, 4, 5, 6, and 7—based on canal distribution within the city. Based on the measurements taken in the current year at the downstream side of the GKSTP, evidence suggests that the treatment plant’s operation has reduced several key water quality parameters. Specifically, the data indicate a significant decrease in temperature, total suspended solids, salinity, biological oxygen demand over 5 days, and nitrate levels compared to the period before the treatment plant was commissioned. Before implementing the GKSTP, the region experienced heightened levels of pollutants such as nitrate (NO3−), primarily stemming from agricultural runoff, which can result from applying fertilizers and other agricultural practices.
Additionally, elevated levels of BOD5 were observed, attributed mainly to sewage discharges from unconnected pipes, leading to organic matter decomposition and subsequent oxygen depletion in aquatic ecosystems. Moreover, TSS concentrations were notable, indicating sediment and particulate matter in water bodies. Despite the establishment of the GKSTP, while improvements have been noted in BOD5, TSS, and NO3− concentrations, their mitigation remains less significant than anticipated, attributing to factors such as persistent non-point sources of pollution, highlighting the complexity and ongoing challenges in achieving comprehensive water quality management in the region. No significant difference in pH, TDS, and conductivity is observed before and after the commissioning of the GKSTP. According to the current findings, water quality exhibited low levels during the wet season due to the intentional sewage release and surface runoff from unserved city areas and entities stemming from a complex interplay of scientific factors. First, the lack of adequate sanitary infrastructure in municipal areas not connected to the STP leaves residents and businesses with few alternatives to discharge sewage directly into nearby water bodies, particularly during heavy rainfall events when sewage systems may become overwhelmed. Second, rapid urbanization contributes to increased impervious surfaces like roads and buildings, disrupting natural drainage patterns and exacerbating surface runoff. This phenomenon prevents rainwater from infiltrating the soil, leading to heightened runoff and pollution accumulation in water bodies.
Furthermore, a lack of regulatory enforcement and illegal practices allow entities to intentionally release sewage or discharge pollutants into water bodies, exploiting gaps in regulations or enforcement mechanisms. These practices could range from industrial facilities illegally dumping wastewater to individuals of disposing waste directly into waterways due to inadequate waste management infrastructure. Additionally, a lack of environmental awareness among the population may contribute to such behaviors, highlighting the importance of public education campaigns to promote responsible waste disposal and raise awareness about the detrimental impacts of pollution.
The WQI values calculated for these parameters in the current year were significantly higher than the WQI values calculated before the commissioning of the GKSTP, indicating a significant improvement in water quality (p < 0.05, ANOVA). However, based on the comparison of water quality data from 2005 to 2022–2023, it can be concluded that the GKSTP, designed to treat wastewater from hospitals, domestic sources, and shops, has shown only a marginal improvement in the overall water quality of the canals into which it discharges. Notably, the comparison of water quality data shows that pollution levels are consistently high at site 5 relative to other sites, and this high level of pollution is expected to impact downstream water quality at sites 6 and 7, as well as along the entire length of the stream. Moreover, it is worth noting that the irrigation canal is diverted at site 7, which means that the impact of site 5’s poor water quality will likely continue to affect the water diverted for irrigation purposes. It is a fact that the treatment plant effectively treats wastewater to a satisfactory level, ensuring compliance with quality standards before discharge. However, despite this treatment, marginal improvements in canal water quality are observed due to a combination of factors, including direct pollution inputs (significantly impacts water quality, introducing pollutants directly into the water body), capacity limitations in treatment infrastructure (factors contributing to capacity discrepancies could include outdated infrastructure, population growth, or inadequate investment in treatment technologies), and inadequate regulatory enforcement (may fail to address illegal discharge or ensure compliance with treatment standards), which are the major causes of the failing state of wastewater treatment facilities in other developing countries as well (Edokpayi et al., 2017).
The discharge of treated wastewater back into the canals leads to recontamination. This phenomenon occurs when treated water, although meeting regulatory requirements, is reintroduced into the canal system, where it may encounter pollutants from other sources, thereby compromising its quality. Hence, while the treatment plant operates efficiently, additional measures may be needed to prevent recontamination of the water bodies. However, in many cases, the treatment plants are ineffective in improving the water quality to the relevant standards, and there is only a slight overall improvement compared to before establishing the treatment plants. One reason why the treatment plant may not be effective is the nature of the effluent discharged. Some effluents discharged may contain high levels of pollutants that are difficult to remove through conventional treatment methods. These pollutants can interfere with the treatment plant’s performance, reducing its effectiveness in removing other pollutants. For example, the limited reduction observed in dissolved solids and unsatisfactory conductivity levels in the effluent wastewater, as reported by Hangargekar and Takpere (2015) and Agyemang et al. (2013), may be attributed to these underlying causes of treatment plant failures. Moreover, this may be due to the inadequacy of the treatment plant or its inability to operate optimally. Therefore, addressing these issues demands a multifaceted approach, including investment in sanitary infrastructure, sustainable urban planning strategies, strengthened regulatory frameworks, and comprehensive public education initiatives to foster environmental stewardship and mitigate intentional sewage release and surface runoff.
An audit query (National Audit Office EAD, 2021) related to the water reclamation system of Kurunegala suggests that the GKSTP has a designed capacity of 4500 m3 per day. However, on 26th June 2020, the actual volume treated was approximately 2600 m3/day. The water treatment plant has a processing capacity of approximately 3300 m3 per day, indicating that the plant’s capacity is not being fully utilized, leading to a lower-than-expected number of beneficiaries being served. Whether the plant is a success cannot be determined solely by the volume of water being treated but should also consider other factors, such as the quality of the treated water, the effectiveness of the treatment process, and the plant’s impact on the environment. When considering the impact on the environment, the results of this study revealed that after the commissioning of the GKSTP, the water quality of the canals in the area showed a significant improvement compared to before the commissioning of the GKSTP, which is a positive impact. However, the discharge of treated water back to polluted canals, as observed in the Kurunegala wastewater treatment plant, may not be an ideal approach to water management. Instead, treated water can be directly utilized for non-potable purposes such as irrigation, industrial processes, or landscaping, where there is no direct contact with humans. This approach helps conserve freshwater resources and reduce the amount of wastewater discharged into natural water bodies. Moreover, as the cost of treating wastewater is considerably high, it must be utilized to its maximum potential rather than being discharged back into the environment. Therefore, in the case of the Kurunegala wastewater treatment plant, if the treated wastewater is used for non-potable purposes, it can help increase the treated water’s value and reduce the plant’s operational costs while contributing toward sustainable water and environmental management.
Now, the question is whether it is worth spending millions to operate the sewage treatment plant with only a network of 136 km of pipes in place to collect wastewater, serving approximately a population of 40,000 individuals, covering 2,700 households, 1,200 commercial connections, and hospitals that represent 90% of the municipality area. The untreated sewage from unconnected pipes (10% of the municipality area) can still cause significant harm to the environment and public health. Even if the overall water quality index improves slightly due to the treatment plant, untreated sewage can still contain harmful pathogens, chemicals, and nutrients that can degrade water quality and cause diseases. These can also negatively impact aquatic ecosystems, causing eutrophication, algal blooms, and other problems. However, having sewage treatment systems in place can provide a long-term solution to water quality issues. By treating wastewater at a central site, the water can be safely cleaned for discharge into the environment or reuse, helping prevent contamination of groundwater sources, which can be costly and difficult to remediate. Sewage treatment systems can have other benefits beyond improving water quality. For example, they can produce biogas, which can be used to generate electricity and heat (Libhaber and Orozco-Jaramillo, 2012). They can also produce nutrient-rich biosolids, which can be used as fertilizer for agriculture because the nutrient content of treated wastewater is high (Chojnacka et al., 2020). These benefits can offset the treatment plant’s costs, making it more financially sustainable (Kamble et al., 2019; Nair et al., 2021). In this case, ongoing research is being conducted on using byproducts (organic waste and sludge) from the GKSTP to produce compost and biochar. It is essential to consider the long-term impacts of not treating sewage. If left untreated, sewage can accumulate in water bodies and soils, causing long-term environmental and health impacts. As it can lead to increased costs in the future to clean up the pollution and address the health impacts, it is good to take corrective action beforehand, attending to the partial connectivity of wastewater sources to the wastewater treatment plant and underutilization of the plant.
The underutilization of the treatment plant and the partial connectivity of pollutants in the city can be attributed to several factors. One primary reason for underutilization may be inadequate infrastructure, such as incomplete sewer networks or a lack of connections from unconnected areas to the treatment plant. This results in untreated or partially treated wastewater being discharged directly into water bodies, contributing to pollution. It is essential to invest in expanding the sewer networks and connecting unconnected areas to the treatment plant to improve the effectiveness of the treatment plant, ensuring that a greater portion of the wastewater is directed to the plant for proper treatment and reducing the discharge of pollutants into the environment.
Additionally, implementing advanced treatment technologies at the plant, such as tertiary treatment processes or upgrading existing infrastructure, can enhance pollutant removal efficiency and ensure compliance with water quality standards. Improving connectivity and treatment capacity would positively impact achieving sustainable development goals (SDGs) related to clean water availability and improved health by reducing pollution and safeguarding water resources. Targeted remediation strategies are essential to address water quality deterioration in unserved areas beyond WWTPs. One approach involves reducing waste loads through improved waste management practices, including implementing recycling programs, waste segregation initiatives, and public awareness campaigns to promote responsible waste disposal. Additionally, developing and enforcing policies and regulations for waste management are crucial to ensuring compliance and reducing pollution. Such policies could involve implementing penalties for illegal dumping or incentivizing environmentally friendly practices. Furthermore, addressing new constructions of houses and commercial entities requires stringent regulations for wastewater disposal and infrastructure development. Implementing measures such as mandatory connections to sewer systems or on-site wastewater treatment facilities for new construction can help mitigate pollution inputs originating from unserved areas and achieve sustainable water management goals.
The outcomes of this regional investigation underscore the crucial role played by WWTPs in enhancing urban water quality, which has broader implications for global water management practices. The concern of running treatment plants below their designed capacity raises issues about cost-effectiveness; nevertheless, the long-term benefits to community health and environmental sustainability should not be disregarded. This scenario emphasizes the significance of evaluating WWTPs based on their immediate operational measures and considering their broader contributions to societal and ecological wellbeing.
5 Conclusion
Based on this study, the following conclusions are drawn. The pH value of the canals after treatment was found to be in the alkaline range. Despite the presence of a wastewater treatment plant, pollution levels in the canals remain higher during the wet season than in the dry season, attributing to surface runoff from residential and agricultural areas and the potential intentional release of sewage to the canals by unserved city areas and entities. After evaluating the WQI of the sites, it can be concluded that Wendaru Lake has the highest WQI value of 53, followed by the Boo Streamlet, with an average value of 49.6. Wan Streamlet has a WQI of 46, while Wilgoda anicut has a value of 48. Based on this, it can be inferred that Wendaru Lake has relatively better water quality than the other sites, while Wan Streamlet has the poorest water quality. The comparison of water quality parameters with NAWQS categories indicates that most parameters are not within the acceptable range. However, after establishing the GKSTP, significant improvements have been observed, except for pH, TDS, and conductivity. The decrease in values of BOD5, TSS, temperature, salinity, and nitrate after establishing the treatment facility indicates an improvement in water quality. The calculated WQI also supports the observed improvement in water quality. Establishing a wastewater treatment plant has improved the WQI of canal water from 35 to 49, indicating that the treated wastewater has a better quality than the untreated one. However, the WQI still falls under the “bad” category (50 > WQI > 24), indicating that further improvements are necessary to achieve good water quality. The presence of unconnected sewage pipes in the network, particularly in the Wan Streamlet area, could contribute to the high level of pollutants in the canals. Therefore, appropriate remediation strategies should be developed and implemented to address these issues and improve water quality, in addition to the operations of WWTPs. It was found that although a significant investment is made to treat wastewater, the expected improvements in wastewater treatment are not achieved due to the partial connectivity of the pollutants in the city. This situation hampers progress toward achieving the SDGs by limiting the availability of clean water for farming and failing to improve health and wellbeing by enhancing water quality compared to the conditions that prevailed prior to the establishment of the facility. Hence, underutilization of the treatment plant, lack of coverage of the whole city by the sewage treatment system, and the limited use of stormwater management techniques are significant challenges that need to be addressed to improve the effectiveness of the treatment plant. Urban areas face similar obstacles in maintaining water quality due to escalating pollution. Therefore, efficient wastewater treatment is crucial to prevent the quality deterioration of water bodies, safeguard aquatic ecosystems, and ensure the availability of safe water for human consumption. The main objective was to identify the challenges faced by the WWTP and suggest feasible solutions to achieve the intended improvements in water quality. The findings of this investigation support the implementation of a comprehensive assessment framework for WWTPs, which considers not only their operational capacity but also the extensive environmental and public health advantages they offer. Moreover, this study underscores the importance of ongoing monitoring and adaptive management to tackle seasonal and location-specific pollution variations. The persistent challenges related to parameters like pH, TDS, and conductivity identified in this research indicate common global issues. Resolving these challenges necessitates the development of innovative technologies and the adoption of integrated water management approaches that can be tailored to specific local conditions. While the establishment and maintenance of WWTPs entail significant investments, their critical role in preserving water quality and bolstering community resilience cannot be overstated. The insights gained from this localized investigation contribute valuable insights to the global conversation on sustainable water management, advocating for the strategic deployment and optimization of wastewater treatment infrastructure to achieve long-term environmental and public health objectives.
Data availability statement
The raw data supporting the conclusions of this article will be made available by the authors, without undue reservation.
Author contributions
SS: conceptualization, data curation, formal analysis, investigation, methodology, and writing–original draft. MN: conceptualization, data curation, investigation, methodology, supervision, and writing–original draft. BA: data curation, funding acquisition, project administration, software, supervision, visualization, and writing–review and editing. AT: data curation, resources, software, validation, and writing–review and editing.
Finanzierung
The author(s) declare that financial support was received for the research, authorship, and/or publication of this article. This research was funded by Researchers Supporting Project Number (RSP2024R443), King Saud University, Riyadh, Saudi Arabia.
Conflict of interest
The authors declare that the research was conducted in the absence of any commercial or financial relationships that could be construed as a potential conflict of interest.
Publisher’s note
All claims expressed in this article are solely those of the authors and do not necessarily represent those of their affiliated organizations, or those of the publisher, the editors, and the reviewers. Any product that may be evaluated in this article, or claim that may be made by its manufacturer, is not guaranteed or endorsed by the publisher.
Supplementary material
The Supplementary Material for this article can be found online at: https://www.frontiersin.org/articles/10.3389/fenvs.2024.1412717/full#supplementary-material
References
Agyemang, E. O., Awuah, E., Darkwah, L., Arthur, R., and Oseiv, G. (2013). Water quality assessment of a wastewater treatment plant in a Ghanaian beverage industry. Int. J. Water Resour. Environ. Eng. 5 (5), 272–279.
Ali, I., Naz, I., Peng, C., Abd-Elsalam, K. A., Khan, Z. M., Islam, T., et al. (2021). “Sources, classifications, constituents, and available treatment technologies for various types of wastewater: an overview,” in Aquananotechnology (Amsterdam, the Netherlands: Elsevier), 11–46. doi:10.1016/B978-0-12-821141-0.00019-7
Al-Mutairi, N., Abahussain, A., and El-Battay, A. (2014). Spatial and temporal characterizations of water quality in Kuwait bay. Mar. Pollut. Bull. 83 (1), 127–131. doi:10.1016/j.marpolbul.2014.04.009
APHA (2017). Standard methods for examination of water and wastewater. Washington, DC: American Public Health Association.
Bandara, N. J. G. J. (2003). Water and wastewater-related issues in Sri Lanka. Water Sci. Technol. 47 (12), 305–312. doi:10.2166/wst.2003.0661
Baskar, A. V., Bolan, N., Hoang, S. A., Sooriyakumar, P., Kumar, M., Singh, L., et al. (2022). Recovery, regeneration and sustainable management of spent adsorbents from wastewater treatment streams: a review. Sci. Total Environ. 822, 153555. doi:10.1016/j.scitotenv.2022.153555
Călmuc, V. A., Călmuc, M., Țopa, C. M., Timofti, M., Iticescu, C., and Georgescu, L. P. (2018). Various methods for calculating the water quality index. Phys. Theor. Mech. 41 (1), 171–178. doi:10.35219/ann-ugal-math-phys-mec.2018.2.09
Chojnacka, K., Witek-Krowiak, A., Moustakas, K., Skrzypczak, D., Mikula, K., and Loizidou, M. (2020). A transition from conventional irrigation to fertigation with reclaimed wastewater: prospects and challenges. Renew. Sustain. Energy Rev. 130, 109959. doi:10.1016/j.rser.2020.109959
Cisneros Ontiveros, H. G., Medellín Castillo, N. A., Cárdenas Tristán, A., Cárdenas, M. C., Arturo Ilizaliturri Hernández, C., and Putri, R. F. (2021). Determination of the water quality index (NFS WQI) of water bodies in the huasteca potosina, Mexico. E3S Web Conf. 325, 08002. doi:10.1051/e3sconf/202132508002
Dębska, K., Rutkowska, B., Szulc, W., and Gozdowski, D. (2021). Changes in selected water quality parameters in the Utrata river as a function of catchment area land use. Water 13 (21), 2989. doi:10.3390/w13212989
Edokpayi, J. N., Odiyo, J. O., and Durowoju, O. S. (2017). “Impact of wastewater on surface water quality in developing countries: a case study of South Africa,” in Water quality (London, UK: InTech). doi:10.5772/66561
Estévez, E., Rodríguez-Castillo, T., González-Ferreras, A. M., Cañedo-Argüelles, M., and Barquín, J. (2019). Drivers of spatio-temporal patterns of salinity in Spanish rivers: a nationwide assessment. Philosophical Trans. R. Soc. B Biol. Sci. 374 (1764), 20180022. doi:10.1098/rstb.2018.0022
Fatema, K., Wan Maznah, W. O., and Isa, M. M. (2014). Spatial and temporal variation of physico-chemical parameters in the merbok estuary, kedah, Malaysia. Trop. Life Sci. Res. 25 (2), 1–19.
Ferdous, J., Ur Rahman, M. T., and Ghosh, S. K. (2019). “Detection of total dissolved solids from landsat 8 OLI image in coastal Bangladesh,” in Proceedings of the 3rd International Conference on Climate Change, Kuala Lumpur, Malaysia, 21st–22nd February 2019, 35–44.
Figueroa-Nieves, D., McDowell, W. H., Potter, J. D., Martínez, G., and Ortiz-Zayas, J. R. (2014). Effects of sewage effluents on water quality in tropical streams. J. Environ. Qual. 43 (6), 2053–2063. doi:10.2134/jeq2014.03.0139
Ganguly, K., Dutta, S. D., Patel, D. K., and Lim, K.-T. (2021). “Silver nanoparticles for wastewater treatment,” in Aquananotechnology (Amsterdam, the Netherlands: Elsevier), 385–401. doi:10.1016/B978-0-12-821141-0.00016-1
Gbandi, T. (2022). This water is all ours: water demand and civil conflicts. Res. Econ. 76 (2), 120–130. doi:10.1016/j.rie.2022.06.003
Hamdhani, H., Eppehimer, D. E., and Bogan, M. T. (2020). Release of treated effluent into streams: a global review of ecological impacts with a consideration of its potential use for environmental flows. Freshw. Biol. 65 (9), 1657–1670. doi:10.1111/fwb.13519
He, B., He, J., Wang, J., Li, J., and Wang, F. (2017). Abnormal pH elevation in the Chaobai River, a reclaimed water intake area. Environ. Sci. Process. Impacts 19 (2), 111–122. doi:10.1039/C6EM00535G
Isaak, D. J., Luce, C. H., Rieman, B. E., Nagel, D. E., Peterson, E. E., Horan, D. L., et al. (2010). Effects of climate change and wildfire on stream temperatures and salmonid thermal habitat in a mountain river network. Ecol. Appl. 20 (5), 1350–1371. doi:10.1890/09-0822.1
Jayakody, P., Gunawardana, I., Guneratne, S., Clemett, A., and Dissanayake, P. (2007). Wastewater agriculture in Kurunegala city, Sri Lanka, WASPA Asia Project Report 8.
Kamarudin, M. K. A., Wahab, N. A., Bati, N. A. M., Toriman, M. E., Saudi, A. S. M., Umar, R., et al. (2020). Seasonal variation on dissolved oxygen, biochemical oxygen demand and chemical oxygen demand in terengganu river basin, Malaysia. J. Environ. Sci. Manag. 23 (2), 1–7. doi:10.47125/jesam/2020_2/01
Kamble, S., Singh, A., Kazmi, A., and Starkl, M. (2019). Environmental and economic performance evaluation of municipal wastewater treatment plants in India: a life cycle approach. Water Sci. Technol. 79, 1102–1112. doi:10.2166/wst.2019.110
Kieser, M. S. (2015). Stormwater thermal enrichment in urban watersheds. Water Intell. 3, 9781780404332. doi:10.2166/9781780404332
Kumar, R. N., and Nirmal, K. J. I. (2011). An assessment of seasonal variation and water quality index of Sabarmati river and Kharicut canal at Ahmedabad, Gujarat. Electron. J. Environ. Agric. Food Chem. 10 (5), 2248–2261.
Lakshmi, K. S., and Reddy, M. A. (2017). Wastewater - an overview. Int. J. Contemp. Res. Rev. 8 (8), 20254–20262. doi:10.15520/ijcrr/2017/8/08/287
Li, P. (2014). Abbasi T and abbasi SA: water quality indices. Environ. Earth Sci. 71 (10), 4625–4628. doi:10.1007/s12665-014-3141-9
Libhaber, M., and Orozco-Jaramillo, Á. (2012). Sustainable treatment and reuse of municipal wastewater: for decision makers and practising engineers. London, UK: Iwa Publishing.
Madushanka, K. H. V. V., Dayanthi, W. K. C. N., Rajapaksha, R. A. S. S., and Rasanjana, K. G. (2012). Assessment of spatial variation in water quality: a case study at Moragoda Ela, Galle. Civ. Eng. Res. Exch. Symposium 2012, 30–35.
Nair, S., Manu, B., and Azhoni, A. (2021). Sustainable treatment of paint industry wastewater: current techniques and challenges. J. Environ. Manag. 296, 113105. doi:10.1016/j.jenvman.2021.113105
National Audit Office EAD (2021). Evaluation the efficiency of Waste water management in Sri Lanka. Sri Lanka: National Audit Office.
Ngabirano, H., Byamugisha, D., and Ntambi, E. (2016). Effects of seasonal variations in physical parameters on quality of gravity flow water in kyanamira sub-county, Kabale district, Uganda. J. Water Resour. Prot. 08 (13), 1297–1309. doi:10.4236/jwarp.2016.813099
Nishshanka, R., de Silva, S., Clemett, A., Dissanayake, P., Jayakody, P., and Jayaweera, P. (2006). Background report: Kurunegala, Sri Lanka. WASPA Asia Project Report, 1.
Priyanka, D., Alexandra, C., Priyantha, J., and Priyanie, A. (2007). Report on water quality survey and pollution in Kurunegala, Sri Lanka. WASPA Asia Project Report, 6.
Qadir, M., Drechsel, P., Jiménez Cisneros, B., Kim, Y., Pramanik, A., Mehta, P., et al. (2020). Global and regional potential of wastewater as a water, nutrient and energy source. Nat. Resour. Forum 44 (1), 40–51. doi:10.1111/1477-8947.12187
Rajapakshe, I., Gunawardana, I., and Najim, M. M. M. (2007). Problems associated with utilization and management of wastewater: a case study from Sri Lanka. Environ. Monit. 7 (11), 4–13.
Ranaweera, R. (2005). “Wastewater generation, its quality and conjunctive use for paddy irrigation in Kurunegala,” BSc. Thesis. Kandy (Sri Lanka): Faculty of Agriculture, University of Peradeniya.
Ryder, G. (2017). The United Nations world water development report, 2017: wastewater: the untapped resource. Paris, France: UNESCO Publishing.
Keywords: city canals, pollution, spatiotemporal variations, sustainable water management, water quality
Citation: Samaraweera SAPT, Najim MMM, Alotaibi BA and Traore A (2024) Impacts of a partially connected wastewater treatment plant on the water quality of stormwater drains used as an irrigation source. Front. Environ. Sci. 12:1412717. doi: 10.3389/fenvs.2024.1412717
Received: 05 April 2024; Accepted: 12 July 2024;
Published: 02 August 2024.
Edited by:
Cristina Sousa Coutinho Calheiros, University of Porto, PortugalReviewed by:
Mathieu Nsenga Kumwimba, Chinese Academy of Sciences (CAS), ChinaAbeer Moneer, National Institute of Oceanography and Fisheries (NIOF), Egypt
Copyright © 2024 Samaraweera, Najim, Alotaibi and Traore. This is an open-access article distributed under the terms of the Creative Commons Attribution License (CC BY). The use, distribution or reproduction in other forums is permitted, provided the original author(s) and the copyright owner(s) are credited and that the original publication in this journal is cited, in accordance with accepted academic practice. No use, distribution or reproduction is permitted which does not comply with these terms.
*Correspondence: M. M. M. Najim, [email protected]