 Yujiao Liu1,2
 Yuanfang Chai
 Yinjun Zhou
- 1Key Laboratory for Sedimentation Science and Northern Rivers Training of the Ministry of Water Resources of China, Beijing, China
- 2Key Laboratory of River Regulation and Flood Control of Ministry of Water Resources, Changjiang River Scientific Research Institute, Wuhan, China
- 3College of Civil Engineering and Architecture, Quzhou University, Quzhou, Zhejiang, China
- 4State Key Laboratory of Earth Surface Processes and Resource Ecology, Faculty of Geographical Science, Beijing Normal University, Beijing, China
- 5State Key Laboratory of Water Resources and Hydropower Engineering Science, Wuhan University, Wuhan, China
Introduction: The formation of bars and pools, characterized by concave and convex bed morphology, is a typical feature of curved rivers. The channel bed morphology has a significant influence on the flow structures in curved channels.
Methods: Based on data from physical model experiments, this study employs the RNG k-ε model and the VOF (Volume of Fluid) method to perform three-dimensional numerical simulations of flow in continuous curved channels.
Results: By comparing the variations in flow structures between channels with a flat bed and channels with bars and pools, the results show that the presence of bars and pools leads to an increase in longitudinal flow velocity on the convex bank side near the entrance of the upstream bend, while in the downstream bend it is opposite. The high-velocity region shifts slower towards the concave bank along the bend. The presence of point bars weakens the circulation near the convex bank in the upstream bend, resulting in a smaller circulation intensity. The decrease in circulation intensity is the largest (−23.91%) at the apex of the bend. In the downstream bend, the remaining circulation from the upstream bend attenuates slower in the pool and has a greater impact distance, increasing the circulation intensity in the downstream bend. The section near the bend entrance shows the largest increase in circulation intensity, with a rate of 128.18%. The unevenness of the bed topography increases the unevenness of the bed shear stress in the downstream bend.
Discussion: The findings of this study contribute to a deeper understanding of the complex flow structures and evolution trends in natural curved rivers, providing scientific basis for the management of curved river channels.
1 Introduction
Curved river channels, especially meandering rivers, are common in natural river systems and exhibit intricate flow patterns and complex sediment transport dynamics (Dietrich and Smith, 1983; Sambrook et al., 2016; Nicholas et al., 2018; Zhou and Endreny, 2020; Ielpi et al., 2022). The circulation within these bends significantly influences flow structures, shaping the channel bed morphology and impacting the overall river ecosystem (Pedersen et al., 2014; Graf et al., 2016; Zhou and Endreny, 2020; Juliandar et al., 2021). Understanding the interplay between flow dynamics and bed morphology is crucial for various applications, including river engineering, flood management, and ecosystem restoration (Schirmer et al., 2014; Yu et al., 2022). In continuous curved channels, the formation of bars and pools, characterized by concave and convex bed morphology, is a typical feature. Circulation plays a vital role in shaping these bed features (Crosato and Mosselman, 2020). Sediment-laden surface flow tends to migrate towards the concave bank under the influence of circulation, where the flow velocity decreases, facilitating sediment deposition and the formation of concave banks (Tubino et al., 1999). Conversely, sediment-rich bottom flow moves towards the convex bank, where the flow velocity increases, resulting in sediment erosion and the formation of convex bars (Peakall and Sumner, 2015). This continuous interplay between flow and bed morphology creates a complex and dynamic flow structure.
While the significance of flow patterns and bed morphology in curved channels is well recognized, previous research has mainly focused on channel cross-sections with simple geometries, such as rectangular or trapezoidal shapes (Rooniyan, 2014; Yokojima et al., 2015; Karami et al., 2017; Mulahasan and Stoesser, 2017; Fathi-moghaddam et al., 2018; Shariq et al., 2018; Ghaderi et al., 2020). For natural meandering rivers, the pools and point bars are formed in bends, which results in the shape of cross-sections is irregular. Previous research has mainly focused on channel cross-sections with simple geometries, such as rectangular or trapezoidal shapes, while the understanding of the impacts of the typical “pool-bar” bed morphology in natural meandering rivers is limited. The presence of deep pools on the concave bank enhances the formation of circulation, as the flow is constrained within the deep channel. As the flow passes over the convex bank, where the water depth is shallower, it induces a shift in the main flow towards the concave bank (Blanckaert, 2009). This lateral shift of the flow alters the momentum distribution within the bend, influencing sediment transport and erosion/deposition processes. Therefore, a comprehensive understanding of the influences of bed morphology on flow structures in continuous curved channels is essential for unraveling the complexities of flow behavior and sediment dynamics in curved river systems.
To address this research gap, this study utilizes data from physical model experiments as validation material and employs advanced numerical simulation techniques, specifically the RNG k-εmodel and the VOF method, to simulate three-dimensional flow in continuous curved channels with different bed morphologies. By comparing the flow structures between channels with a flat bed and those with a bar-pool bed morphology, the study aims to unravel the specific impacts of bed morphology on flow characteristics within curved channels. The outcomes of this research will provide deeply understanding of the complex flow characteristics of continuous bends, contributing to a comprehensive understanding of flow behavior and sediment dynamics in curved river systems. These findings can be utilized to design effective river engineering strategies, and inform river channel management practices. Moreover, developing a deeper understanding of the interplay between flow dynamics and bed morphology is crucial for various applications, including river engineering, flood management, and ecosystem restoration.
2 Materials and methods
2.1 Experimental setup and measurements
The experiments were performed in a meandering laboratory flume. The channel consists of a 7 m long straight reach both upstream and downstream of the meandering section. The two meandering bends have radii of 2.4 m, with a center angle of 90° for the upstream bend and 135° for the downstream bend. The transition sections between the bends are 2 m long. The cross-sectional shape of the bends is convex on the outer bank and concave on the inner bank. The rectangular cross-section in the straight reach is smoothly connected to the bed morphology of the meandering section through a gradual transition. The plan layout of the continuous meandering channel is shown in Figure 1.
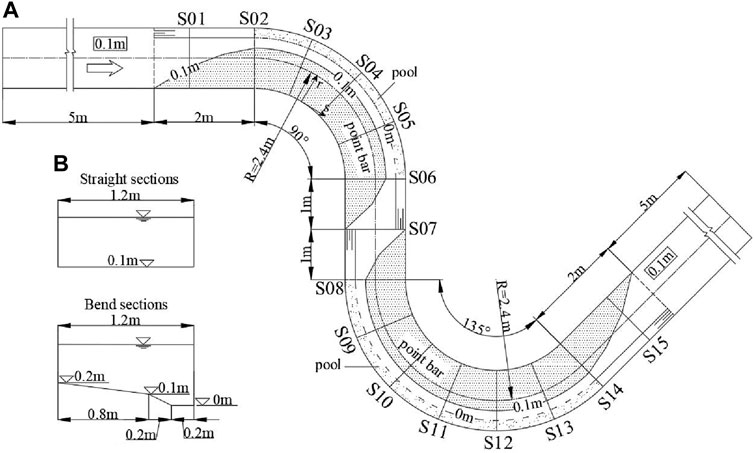
Figure 1. Laboratory flume: (A) Plan view of the experimental setup, (B) Geometry of the cross-sections.
A three-component Nortek Acoustic Doppler Velocimeter (ADV) with 200 Hz sampling frequency is adopted to measure the three-dimensional flow velocities. The sampling duration at each measuring location is 120 s. The longitudinal, transverse, and vertical velocity (u, v, w) are measured in several cross-sections. Lateral distance between the vertical measurement lines is 5 cm. Measuring points of each cross section are vertically spaced at 2 cm except in the near bed region, where they are spaced at 1 cm. More details of the experimental setup and measurements can be found in previous works (Liu et al., 2021).
2.2 Numerical simulation
In this study, the RNG k-ε model is employed to perform three-dimensional simulations of flow in a meandering channel. The RNG k-ε model is a commonly used turbulence model that is based on the Reynolds-averaged Navier-Stokes equations and incorporates additional equations for turbulent kinetic energy and turbulent dissipation rate to describe turbulent motion (Daryus et al., 2016; Gao et al., 2017; Krastev et al., 2017; Boroomand and Mohammadi, 2019; Khalaji et al., 2019). The RNG k-ε model has been widely used in three-dimensional flow simulation of bends and shown good accuracy (Stoesser et al., 2010; Zhou et al., 2017; Hu and Zhang, 2018; Wang et al., 2022).
In the RNG k-ε model, the governing equations consist of the continuity equation, momentum equation, and turbulence equations. The continuity equation describes mass conservation, which states that the mass of the flow remains constant in space and time. It can be expressed as Eq. 1:
The momentum equation describes the motion of the flow and takes into account the effects of pressure gradients, gravity, and friction (Liu et al., 2017; Boroomand and Mohammadi, 2019). The momentum equation can be expressed as Eq. 2:
where t is the time, ρ is density of fluid, μ is dynamic viscosity, p is pressure. g is the acceleration due to gravity, and τ is the stress tensor,
The turbulence equations describe the evolution of turbulent kinetic energy and turbulent dissipation rate. In the RNG k-ε model (Liu et al., 2017), the turbulence equations can be expressed as Eqs 3, 4:
where k is the turbulent kinetic energy, ε is the turbulent dissipation rate, μt is the turbulent dynamic viscosity, Gk and Gb are the generation of turbulence kinetic energy due to the mean velocity and buoyancy, respectively, YM represents the contribution of the fluctuating dilatation in compressible turbulence to the overall dissipation rate. C1ε, C2ε and C3ε are empirical constants in the model,
By numerically solving the above governing equations, it is possible to simulate three-dimensional flow in a meandering channel and obtain detailed information regarding velocity, pressure, and turbulence characteristics. These simulation results will provide valuable insights into the interactions between flow behavior and bed morphology in meandering river systems.
2.3 Grid generation and model setup
The computational model used in this study is the same geometry as in the experiments. For grid generation, the ICEM software is used to create a structured hexahedral grid. To improve computational efficiency while maintaining model accuracy, the longitudinal grid is relatively sparse in the straight reaches far away from the bends. The total number of grids in the model is 4,847,019, with grid sizes ranging from 0.3 cm to 2 cm. A schematic diagram of the grid generation is shown in Figure 2.
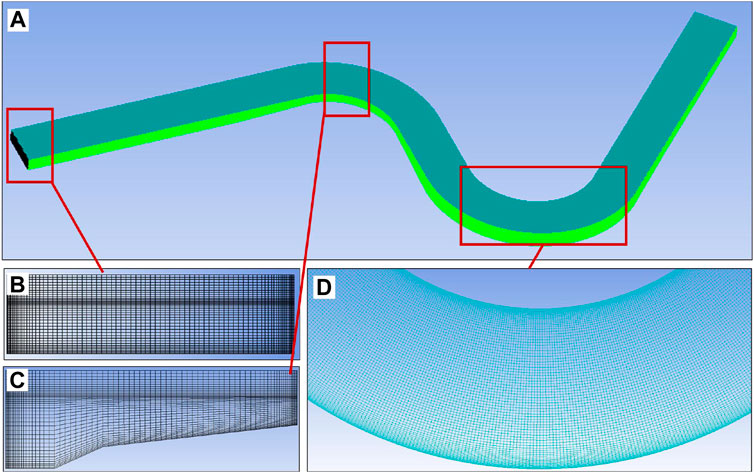
Figure 2. Model grid generation. (A) Overall grid layout of the model; (B) Detailed grid of the rectangular cross-section; (C) Detailed grid of the cross-section in the meandering bend; (D) Detailed grid of the meandering section.
The numerical simulation employs the RNG k-ε two-equation model within the Reynolds-averaged Navier-Stokes (RANS) framework, combined with the Volume of Fluid (VOF) model for capturing the free surface. The VOF model is a widely used method for simulating multiphase flows, where the interface between different fluid phases is represented using a volume fraction function (Aniszewski et al., 2014; Goodrich and Herrmann, 2023; Wang et al., 2023). It tracks the movement and deformation of the free surface by solving a transport equation for the volume fraction of each phase. The VOF model allows for the accurate representation of complex free surface phenomena such as wave breaking and fluid mixing.
To discretize the governing equations, the finite volume method is employed. The finite volume method divides the computational domain into a set of control volumes or cells, and the integral form of the conservation equations is applied to each cell. The equations are then discretized using numerical schemes to approximate the spatial derivatives. The finite volume method is known for its conservation properties and ability to handle complex geometries.
For the coupling calculation of pressure and velocity, the PISO (Pressure-Implicit with Splitting of Operators) algorithm is utilized. The PISO algorithm is an iterative procedure that solves the pressure-velocity coupling problem in a segregated manner. It involves predicting the velocity field, correcting the pressure field, and updating the velocity field iteratively until a converged solution is obtained. The PISO algorithm is widely used in computational fluid dynamics simulations and offers a stable and accurate approach for solving the Naiver-Stokes equations.
The Fluent software is chosen as the platform to establish the three-dimensional flow model of the continuous meandering channel, providing a user-friendly interface and robust numerical algorithms for efficient and accurate simulations.
2.4 Boundary conditions
The inlet boundary conditions consist of two parts: the upper air inlet and the lower water inlet. The upper air inlet is specified using a pressure inlet boundary condition, while the lower water inlet is defined using a mass inlet boundary condition with specified water level and inflow rate.
The outlet boundary conditions are composed of the upper air outlet and the lower liquid outlet. Both parts are set as pressure outlet boundary conditions, with the water level specified at the liquid outlet.
3 Model validation
The accuracy and reliability of the model are assessed through the comparison of computed results with experimental data obtained from physical model tests. The experimental conditions selected for validation include an inlet flow rate of 45 L/s and an outlet water depth of 19 cm.
Figures 3, 4 present a comprehensive comparison between the computed and measured values of the longitudinal and transverse time-averaged velocity (

Figure 3. Validation of Dimensionless U, (A) 60° section of the upstream bend, (B) 90° section of the downstream bend.
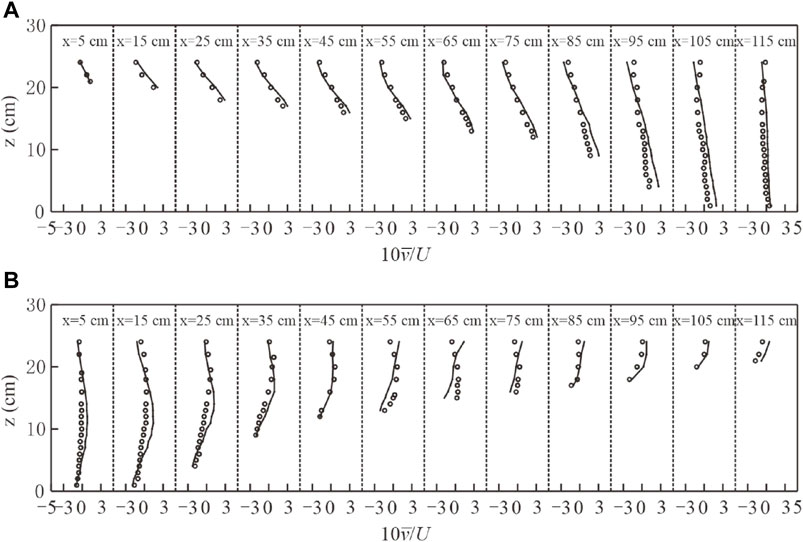
Figure 4. Validation of Dimensionless v, (A) 60° section of the upstream bend, (B) 90° section of the downstream bend.
The agreement between the computed and measured values confirms the capability of the model to accurately represent the flow behavior in the meandering channel. This validation provides confidence in the reliability and accuracy of the numerical model, enabling its application for further analysis and prediction of flow characteristics in similar meandering river systems.
4 Results and discussion
In the continuous meandering channel physical model, the flow structures in two different bed configurations, namely, Run 1 with a horizontal bed morphology and Run 2 with a bar-pool bed morphology, are compared and analyzed.
4.1 Longitudinal velocity
Figures 5, 6 depict the cross-sectional distributions of the

Figure 5. The distribution of
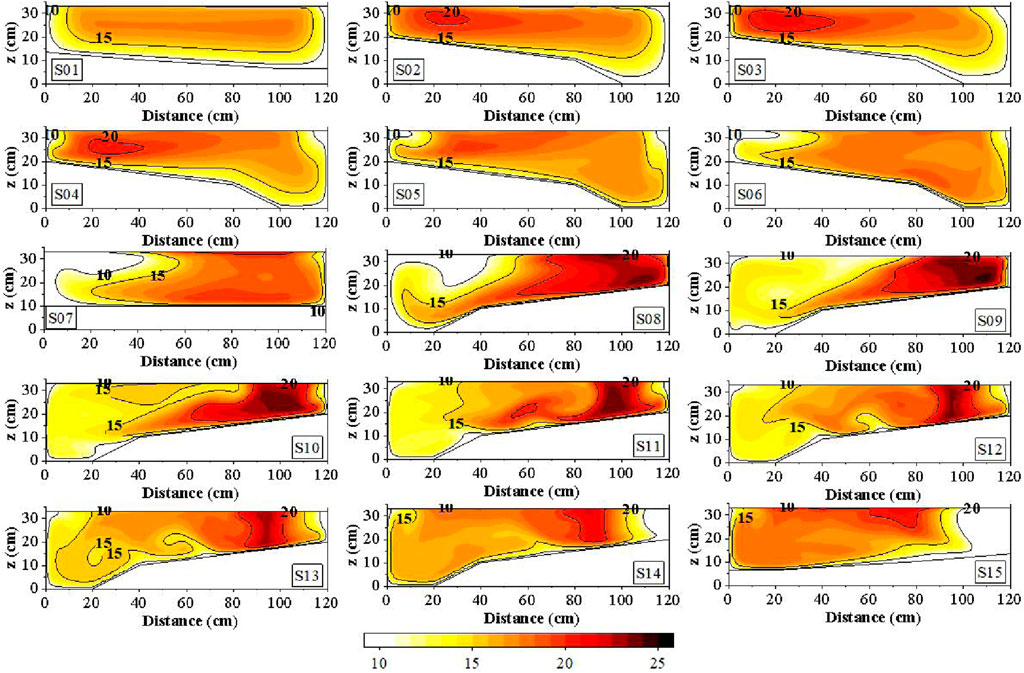
Figure 6. The distribution of
Moving to the downstream bend, Run 1 exhibits a more concentrated high-velocity region on the convex bank side, which is closely located adjacent to the convex bank. In the region 40 cm–60 cm away from the concave bank, Run 2 demonstrates higher velocities on the side bars compared to Run 1 on the bed surface. Moreover, Run 1 exhibits higher velocities in the deep channel on the concave bank side. As the bend approaches the outlet, the high-velocity region of Run 1 swiftly shifts towards the concave bank side.
The comparison and analysis of longitudinal velocities provide valuable insights into the flow characteristics and distinctions between the two bed configurations in the meandering channel. These findings contribute to a better understanding and prediction of flow phenomena in similar meandering river systems.
It is important to note that the observed differences in flow structures between Run 1 and Run 2 can be attributed to the variation in bed morphology (Figures 5, 6). The bar-pool bed morphology in Run 2 introduces more complexities in flow patterns due to the presence of bars and pools, resulting in higher velocities on the convex bank side. On the other hand, the horizontal bed morphology in Run 1 leads to a more uniform flow distribution, with higher velocities concentrated near the concave bank. These variations have significant implications for sediment transport, channel stability, and ecological habitats within meandering channels. Further investigations and analyses, including the examination of bed shear stress, turbulence characteristics, and sediment transport processes, will provide a comprehensive understanding of the flow behavior in meandering channels and aid in the development of effective river management strategies.
4.2 Bed shear stress
Figures 7, 8 present the distribution of bed shear stress (
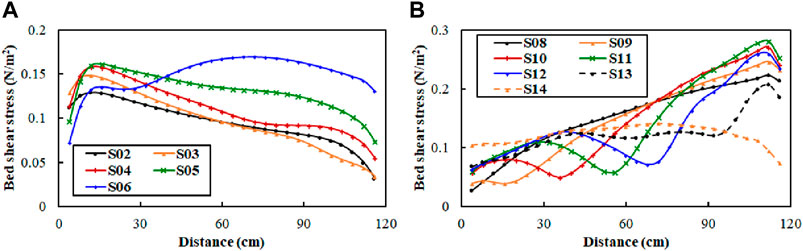
Figure 7. The distribution of
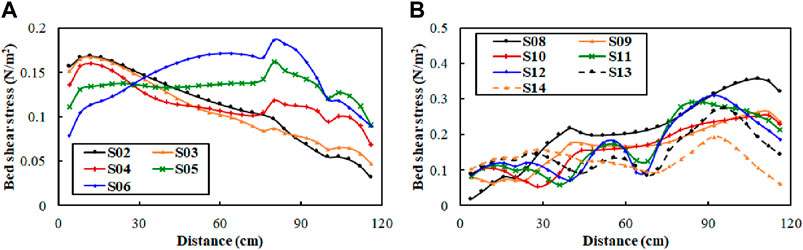
Figure 8. The distribution of
Along the cross-section, except for the outlet cross-section, the
4.3 Circulation structure
Figures 9, 10 show the vectors of the cross-stream velocity components. To quantify the secondary flow strength and identify the circulation boundary, the streamwise vorticity is calculated. The vorticity equation Eq. 5 supplies information about driving and dissipating forces of the secondary flow, which is quantified with the streamwise component of the vorticity vector (Farhadi et al., 2018):
where r and z are the lateral and vertical coordinates, respectively,

Figure 9. Flow field diagram of Section for Run 1.
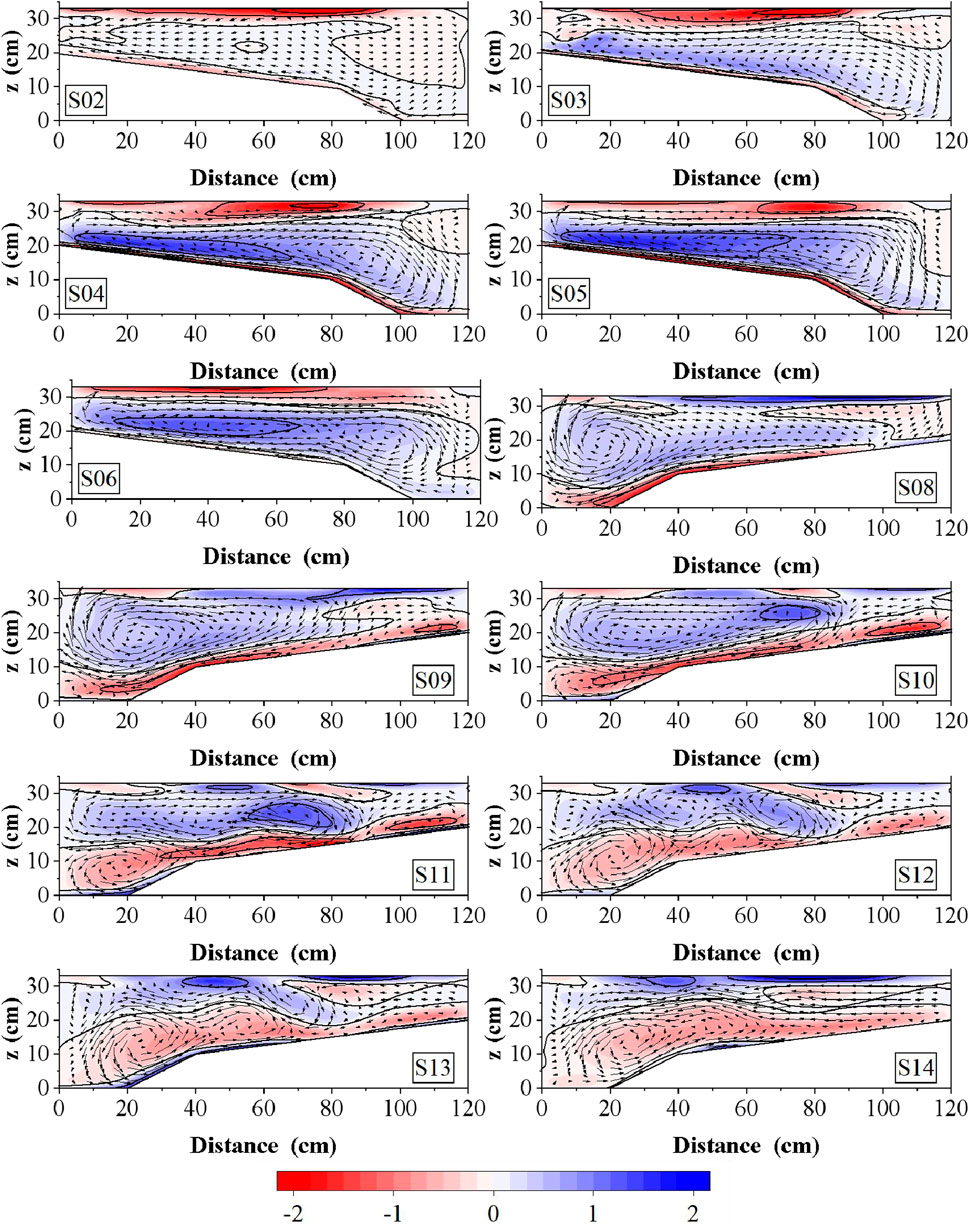
Figure 10. Flow field diagram of Section for Run 2.
For the horizontal bed Run 1 (Figure 9), no discernible circulation structures are observed in the upstream straight section (S01 and S02). However, upon entering the bend, a clockwise circulation pattern initiates at cross-section S03, encompassing the entire cross-section. The circulation center is skewed towards the concave bank and gradually shifts towards the convex bank along the bend. At the downstream bend inlet (section S08), the cross-section circulation structure primarily reflects the residual reverse circulation from the upstream bend. Consequently, the main circulation forms near the bed of convex bank. Given the propensity for the formation of a single main circulation near the concave bank, it progressively expands and shifts towards the convex bank at sections S10 and S11. In the cross-section S05, a reverse small circulation forms near the water surface of the concave bank. The small circulation is enhanced by centrifugal force in downstream bends and merges with the increasing main circulation of the concave bank. The residual reverse circulation from the upstream lies between the two main circulations, attenuating along the reach and dissipating by cross-section S12. Ultimately, the two main circulations occupy the entire cross-section and merge into a unified main circulation at cross-section S14.
In the presence of bed forms such as point bars and pools (Run 2, Figure 10), the main circulation in the upstream bend also forms at cross-section S03, with the circulation center positioned closer to the concave bank compared to the horizontal bed condition. Along the bend, the circulation center gradually shifts towards the convex bank, albeit at a slower pace. Throughout the reach, the circulation center aligns with the edge of the bar due to rapid shifts from the concave bank of the upstream bend to the opposite bank, owing to variations in bed morphology. Upon reaching the downstream bend inlet (S08), the circulation structure remains influenced by the residual reverse circulation from the upstream bend. At section S09, the main circulation forms near the bed of concave bank. The concave bank main circulation expands its influence to the bars, within the trough, from sections S11 to S13. The water depth at the edge of the beach becomes shallower, resulting in two main circulations. Comparing to Run 1, the attenuation of the residual upstream reverse circulation is slower, restricting the expansion of the main circulations. At section S14, the residual upstream circulation diminishes and vanishes, ultimately resulting in a prevailing concave bank main circulation structure across the entire cross-section.
4.4 Circulation intensity
Figure 11 shows the distribution of circulation intensity along the channel for Run 1 and Run 2. There are various methods to define the intensity of circulation, and the index Eq. 6 proposed by Shukry (1950) is selected to calculate the cross-sectional circulation intensity in this paper.

Figure 11. Distribution of circulation intensity along the channel.
In the upstream bend near the entrance, Run 2 exhibits similar circulation intensity to Run 1. From the bend crest to the bend outlet in the upstream bend, the presence of point bars weakens the circulation near the convex bank, resulting in a smaller circulation intensity for Run 2 compared to Run 1. At the apex of the bend (S05), the decrease in circulation intensity is the largest, at −23.91%. However, in the downstream bend, the presence of pools causes the remaining counter-current circulation to decay more slowly, resulting in a higher circulation intensity for Run 2 compared to Run 1. The section near the entrance of the downstream bend (S09) shows the largest increase in circulation intensity, with a rate of 128.18%. At the bend outlet, the circulation intensity for Run 1 becomes higher than that of Run 2 once again.
4.5 Influence of the pools and point bars on bedform evolution
Flow characteristics significantly impact bed deformation in meandering streams, (Ferreira and Ebrahimi, 2017). Sediment transport, which is driven by water flow, ultimately determines bed deformation through the processes of sediment deposition and entrainment (Parker, 1990). The ability of water flow to carry suspended-load sediment is positively correlated with flow velocity and the
According to the cross-sectional distribution of streamwise velocity, the presence of bars and pools tends to suppress erosion near concave banks and promote erosion near convex banks near the entrance of the upstream bend. The impacts in downstream bends is opposite. Point bars weaken upstream bend circulation near convex banks, reducing its intensity. Therefore, the transverse sediment transport intensity from the concave bank to the convex bank in the bend will decrease. In the downstream bend, the intensity of the circulation increases, but this is due to a more prolonged reverse residual circulation. Consequently, the transverse sediment transport intensity from the concave bank to the convex bank does not necessarily increase. Based on the variation law of
5 Implications
The knowledge that bars and troughs influence flow patterns can be applied to river engineering and restoration projects. For instance, in the design of river training structures, such as bank protection measures, it is crucial to consider the influence of bed morphology on flow structures to achieve desired hydraulic conditions and minimize ecological impacts.
The implications of this research are significant and relevant to various fields related to river management and research. Firstly, the study provides insights into the complex interactions between bed morphology and flow structures, which can improve our understanding of sediment transport dynamics in meandering rivers. This knowledge can be applied to predict sediment deposition and erosion patterns, inform erosion control measures, and guide river restoration efforts.
Secondly, the findings have implications for river habitat restoration and biodiversity conservation. Understanding the influence of bed morphology on flow structures allows for the design and implementation of habitat restoration projects that promote the creation of diverse aquatic habitats and enhance ecological connectivity within meandering river systems.
Thirdly, the study’s insights can contribute to more accurate flood risk assessment and mitigation strategies. By considering the impact of bars and troughs on flow structures, engineers and policymakers can improve flood forecasting models and design effective flood control measures that account for the spatial distribution of flow patterns within meandering river bends.
In conclusion, this study has demonstrated that the presence of bars and pools significantly influences the flow structure in continuous curved channels. The presence of bars affects the
Future research can delve deeper into the interactions between bed morphology, flow structures, and ecosystem dynamics in meandering rivers. The incorporation of additional factors such as vegetation and sediment characteristics can further enhance our understanding of the complex dynamics within these systems. Additionally, the application of advanced remote sensing techniques and machine learning algorithms can provide valuable data and insights for studying large-scale meandering river systems. These advancements will contribute to more effective river management and restoration practices, ensuring the resilience and functionality of meandering river ecosystems in the face of environmental changes.
6 Conclusion
Our study on the influence of bed morphology on flow structures in continuous curved channels has provided valuable insights into the complex dynamics of natural meandering rivers. The presence of bars and pools, which are typical features of meandering rivers, has a significant impact on the flow structure within bends. Through three-dimensional numerical simulations using the RNG k-ε model and VOF method, this research compared the flow structure variations between a horizontal bed and a bar-trough bed in continuous curved channels.
The results demonstrate that the presence of bars and pools affects the u distribution near the bend entrance. The presence of bars leads to an increase in the u on the convex bank side and a decrease on the concave bank side. Additionally, the high-velocity region tends to shift more rapidly towards the concave bank along the bend, resulting in higher longitudinal velocities near the downstream concave bank and lower velocities on the convex bank. The circulation patterns are confined within the troughs, and the rate of lateral migration towards the convex bank is slowed down. Furthermore, the remaining circulation from the upstream bend attenuates more slowly towards the convex bank in the downstream bend, impacting a longer distance and increasing the circulation intensity in the downstream bend.
The existence of bars and pools results in a notable increase of the
Data availability statement
The original contributions presented in the study are included in the article/Supplementary Material, further inquiries can be directed to the corresponding author.
Author contributions
YL: Writing–original draft, Visualization, Software, Investigation, Formal Analysis, Conceptualization. YC: Writing–review and editing, Writing–original draft, Validation, Methodology. MY: Writing–review and editing, Validation, Methodology, Conceptualization. YZ: Writing–review and editing, Validation, Resources, Investigation.
Finanzierung
The author(s) declare financial support was received for the research, authorship, and/or publication of this article. This study was supported by the National Natural Science Foundation of China (42301018, U2240224, U2240226), the Open Research Fund of Key Laboratory of Sediment Science and Northern River Training, the Ministry of Water Resources, the China Institute of Water Resources and Hydropower Research (IWHR-SEDI-2022-04), the Central Public-interest Scientific Institution Basal Research Fund (CKSF2021530/HL, CKSF2024324/HL).
Acknowledgments
YC would like to thank the referees for their constructive comments on the earlier version of this paper.
Conflict of interest
The authors declare that the research was conducted in the absence of any commercial or financial relationships that could be construed as a potential conflict of interest.
Publisher’s note
All claims expressed in this article are solely those of the authors and do not necessarily represent those of their affiliated organizations, or those of the publisher, the editors and the reviewers. Any product that may be evaluated in this article, or claim that may be made by its manufacturer, is not guaranteed or endorsed by the publisher.
References
Aniszewski, W., Ménard, T., and Marek, M. (2014). Volume of Fluid (VOF) type advection methods in two-phase flow: a comparative study. Comput. Fluids 97, 52–73. doi:10.1016/j.compfluid.2014.03.027
Blanckaert, K. (2009). Saturation of curvature-induced secondary flow, energy losses, and turbulence in sharp open-channel bends: laboratory experiments, analysis, and modeling. J. Geophys. Res. Earth Surf. 114 (F03015). doi:10.1029/2008jf001137
Boroomand, M. R., and Mohammadi, A. (2019). Investigation of k-ε turbulent models and their effects on offset jet flow simulation. Civ. Eng. J. 5 (1), 127. doi:10.28991/cej-2019-03091231
Crosato, A., and Mosselman, E. (2020). An integrated review of river bars for engineering, management and transdisciplinary research. Water 12 (2), 596. doi:10.3390/w12020596
Daryus, A., Siswantara, A. I., Darmawan, S., Gunadi, G. G. R., and Camalia, R. (2016). CFD simulation of turbulent flows in proto X-3 bioenergy micro gas turbine combustor using std k-ε and rng k-ε model for green building application. Int. J. Technol. 7 (2), 204–211. doi:10.14716/ijtech.v7i2.2978
Dietrich, W. E., and Smith, J. D. (1983). Influence of the point bar on flow through curved channels. Water Resour. Res. 19, 1173–1192. doi:10.1029/wr019i005p01173
Farhadi, A., Sindelar, C., Tritthart, M., Glas, M., Blanckaert, K., and Habersack, H. (2018). An investigation on the outer bank cell of secondary flow in channel bends. J. Hydro-Environment Res. 18, 1–11. doi:10.1016/j.jher.2017.10.004
Fathi-moghaddam, M., Sadrabadi, M. T., and Rahmanshahi, M. (2018). Numerical simulation of the hydraulic performance of triangular and trapezoidal gabion weirs in free flow condition. Flow Meas. Instrum. 62, 93–104. doi:10.1016/j.flowmeasinst.2018.05.005
Ferreira, da Silva A. M., and Ebrahimi, M. (2017). Meandering morphodynamics: Insights from laboratory and numerical experiments and beyond. J. Hydraul. Eng. 143 (9), 03117005. doi:10.1061/(ASCE)HY.1943-7900.0001324
Gao, F., Wang, H., and Wang, H. (2017). Comparison of different turbulence models in simulating unsteady flow. Procedia Eng. 205, 3970–3977. doi:10.1016/j.proeng.2017.09.856
Ghaderi, A., Dasineh, M., Abbasi, S., and Abraham, J. (2020). Investigation of trapezoidal sharp-crested side weir discharge coefficients under subcritical flow regimes using CFD. Appl. Water Sci. 10 (1), 31–12. doi:10.1007/s13201-019-1112-8
Goodrich, A., and Herrmann, M. (2023). A volume-of-fluid vortex sheet method for multiphase flows. J. Comput. Phys. 491, 112388. doi:10.1016/j.jcp.2023.112388
Graf, W., Leitner, P., Hanetseder, I., Ittner, L. D., Dossi, F., and Hauer, C. (2016). Ecological degradation of a meandering river by local channelization effects: a case study in an Austrian lowland river. Hydrobiologia 772, 145–160. doi:10.1007/s10750-016-2653-6
Hu, R., and Zhang, J. (2018). Numerical analysis on hydraulic characteristics of U-shaped channel of various trapezoidal cross-sections. Water 10 (12), 1788. doi:10.3390/w10121788
Ielpi, A., Lapôtre, M. G., Gibling, M. R., and Boyce, C. K. (2022). The impact of vegetation on meandering rivers. Nat. Rev. Earth Environ. 3 (3), 165–178. doi:10.1038/s43017-021-00249-6
Juliandar, M., Nuryono, B., Siahaan, Y., Trimo, D., and Mahardika, A. G. (2021). The effect of river meanders on river morphology. J. Phys. Conf. Ser. 1783 (1), 012071. IOP Publishing. doi:10.1088/1742-6596/1783/1/012071
Karami, H., Farzin, S., Sadrabadi, M. T., and Moazeni, H. (2017). Simulation of flow pattern at rectangular lateral intake with different dike and submerged vane scenarios. Water Sci. Eng. 10 (3), 246–255. doi:10.1016/j.wse.2017.10.001
Khalaji, M. N., Koca, A., and Kotcioğlu, İ. (2019). Investigation of numerical analysis velocity contours k-ε model of RNG, standard and realizable turbulence for different geometries. Int. J. Innovative Res. Rev. 3 (2), 29–34.
Krastev, V. K., Silvestri, L., and Falcucci, G. (2017). A modified version of the RNG k–ε turbulence model for the scale-resolving simulation of internal combustion engines. Energies 10 (12), 2116. doi:10.3390/en10122116
Liu, Y., Yu, M., Tian, H., and Xie, Y. (2021). Flow characteristics in continuous bends with pool–point bar topography. Proc. Institution Civ. Engineers-Water Manag. 174, 213–224. doi:10.1680/jwama.19.00082
Liu, Z., Chen, Y., Wu, Y., Wang, W., and Li, L. (2017). Simulation of exchange flow between open water and floating vegetation using a modified RNG k-ε turbulence model. Environ. Fluid Mech. 17, 355–372. doi:10.1007/s10652-016-9489-5
Mulahasan, S., and Stoesser, T. (2017). Flow resistance of in-line vegetation in open channel flow. Int. J. River Basin Manag. 15 (3), 329–334. doi:10.1080/15715124.2017.1307847
Nicholas, A. P., Aalto, R. E., Sambrook Smith, G. H., and Schwendel, A. C. (2018). Hydrodynamic controls on alluvial ridge construction and avulsion likelihood in meandering river floodplains. Geology 46 (7), 639–642. doi:10.1130/g40104.1
Parker, G. (1990). Surface-based bedload transport relation for gravel rivers. J. Hydraul. Res. 28 (4), 417–436. doi:10.1080/00221689009499058
Peakall, J., and Sumner, E. J. (2015). Submarine channel flow processes and deposits: a process-product perspective. Geomorphology 244, 95–120. doi:10.1016/j.geomorph.2015.03.005
Pedersen, M. L., Kristensen, K. K., and Friberg, N. (2014). Re-meandering of lowland streams: will disobeying the laws of geomorphology have ecological consequences? PloS one 9 (9), e108558. doi:10.1371/journal.pone.0108558
Rooniyan, F. (2014). The effect of confluence angle on the flow pattern at a rectangular open-channel. Eng. Technol. Appl. Sci. Res. 4 (1), 576–580. doi:10.48084/etasr.395
Sambrook, S. G. H., Best, J. L., Leroy, J. Z., and Orfeo, O. (2016). The alluvial architecture of a suspended sediment dominated meandering river: the Río Bermejo, Argentina. Sedimentology 63 (5), 1187–1208. doi:10.1111/sed.12256
Schirmer, M., Luster, J., Linde, N., Perona, P., Mitchell, E. A., Barry, D. A., et al. (2014). Morphological, hydrological, biogeochemical and ecological changes and challenges in river restoration–the Thur River case study. Hydrology Earth Syst. Sci. 18 (6), 2449–2462. doi:10.5194/hess-18-2449-2014
Shariq, A., Hussain, A., and Ansari, M. A. (2018). Lateral flow through the sharp crested side rectangular weirs in open channels. Flow Meas. Instrum. 59, 8–17. doi:10.1016/j.flowmeasinst.2017.11.007
Shukry, A. (1950). Flow around bends in an open flume. Trans. Am. Soc. Civ. Eng. 115 (11), 751–778. doi:10.1061/taceat.0006426
Stoesser, T., Ruether, N., and Olsen, N. R. B. (2010). Calculation of primary and secondary flow and boundary shear stresses in a meandering channel. Adv. Water Resour. 33 (2), 158–170. doi:10.1016/j.advwatres.2009.11.001
Tubino, M., Repetto, R., and Zolezzi, G. (1999). Free bars in rivers. J. ofHydraulic Res. 37 (6), 759–775. doi:10.1080/00221689909498510
Wang, K., Li, N., Song, L., Wu, J., and Jiang, H. (2023). Application of a VOF multiphase flow model for issues concerning floating raft aquaculture. Water 15 (19), 3450. doi:10.3390/w15193450
Wang, X., Mohammadian, A., and Rennie, C. D. (2022). Influence of negatively buoyant jets on a strongly curved open-channel flow using RANS models with experimental data. Water 14 (3), 347. doi:10.3390/w14030347
Yokojima, S., Kawahara, Y., and Yamamoto, T. (2015). Impacts of vegetation configuration on flow structure and resistance in a rectangular open channel. J. hydro-environment Res. 9 (2), 295–303. doi:10.1016/j.jher.2014.07.008
Yu, Z., Zhang, J., Wang, H., Zhao, J., Dong, Z., Peng, W., et al. (2022). Quantitative analysis of ecological suitability and stability of meandering rivers. Front. Bioscience-Landmark 27 (2), 042. doi:10.31083/j.fbl2702042
Zhang, R. J., and Xie, J. H. (1993). Sedimentation Research in China, Systematic SelectionsBeijing, China: Power Press
Zhou, J. Y., Shao, X. J., Wang, H., and Jia, D. D. (2017). Assessment of the predictive capability of RANS models in simulating meandering open channel flows. J. Hydrodynamics, Ser. B 29 (1), 40–51. doi:10.1016/s1001-6058(16)60714-x
Keywords: concave and convex bed morphology, continuous curved channels, flow structures, numerical simulation, flow velocity, circulation intensity, additional information
Citation: Liu Y, Chai Y, Yu M and Zhou Y (2024) Influences of channel bed morphology on flow structures in continuous curved channels. Front. Environ. Sci. 12:1431021. doi: 10.3389/fenvs.2024.1431021
Received: 13 May 2024; Accepted: 17 July 2024;
Published: 05 August 2024.
Edited by:
Jaan H. Pu, University of Bradford, United KingdomReviewed by:
Prashanth Reddy Hanmaiahgari, Indian Institute of Technology Kharagpur, IndiaBimlesh Kumar, Indian Institute of Technology Guwahati, India
Copyright © 2024 Liu, Chai, Yu and Zhou. This is an open-access article distributed under the terms of the Creative Commons Attribution License (CC BY). The use, distribution or reproduction in other forums is permitted, provided the original author(s) and the copyright owner(s) are credited and that the original publication in this journal is cited, in accordance with accepted academic practice. No use, distribution or reproduction is permitted which does not comply with these terms.
*Correspondence: Yuanfang Chai, [email protected]