Category:Election apportionment diagrams of Switzerland
Jump to navigation
Jump to search
Subcategories
This category has the following 24 subcategories, out of 24 total.
A
B
G
J
N
S
Media in category "Election apportionment diagrams of Switzerland"
The following 89 files are in this category, out of 89 total.
-
 AF2011 diagramme.png 800 × 400; 101 KB
-
 AF2015 diagramme.png 799 × 399; 101 KB
-
 Ayent Conseil général 2020.svg 360 × 185; 3 KB
-
 Bundesversammlung Sitzplan Parteien.svg 1,433 × 1,029; 571 KB
-
 Canton de Saint-Gall Conseil cantonal 2024.svg 360 × 185; 8 KB
-
 Cantonal Council Solothurn 2021.svg 360 × 185; 5 KB
-
 CE1848 diagramme.png 800 × 401; 39 KB
-
 Collonge-Bellerive Parliament 1999.svg 360 × 185; 2 KB
-
 Collonge-Bellerive Parliament 2003.svg 360 × 185; 2 KB
-
 Collonge-Bellerive Parliament 2007.svg 360 × 185; 2 KB
-
 Collonge-Bellerive Parliament 2011.svg 360 × 185; 2 KB
-
 Collonge-Bellerive Parliament 2015.svg 360 × 185; 2 KB
-
 Composition du Conseil Communal de Morges.svg 360 × 185; 6 KB
-
 Composition du Conseil Communal de Saint-Prex.svg 360 × 185; 4 KB
-
 Composition du Conseil Communal de Yens.svg 360 × 185; 3 KB
-
 Conseil communal de Montreux 2021-2026.svg 360 × 185; 7 KB
-
 Conseil communal Nyon 2021-2026.svg 360 × 185; 7 KB
-
 Conseil des États 2019.svg 360 × 185; 3 KB
-
 Consiglio Nazionale 2019.svg 544 × 469; 88 KB
-
 Diagramme af suisse 2017.svg 360 × 185; 12 KB
-
 Diagramme du conseil fédéral suisse (2019-2023).png 1,440 × 743; 54 KB
-
 Fully Conseil général 2020.svg 360 × 185; 3 KB
-
 Grisons 2014.svg 360 × 185; 6 KB
-
 Grisons Grand Conseil 2021.svg 360 × 185; 8 KB
-
 Grosser Rat 2014.svg 744 × 1,052; 38 KB
-
 Grosser Rat GR 2014-2.svg 429 × 425; 36 KB
-
 Grosser Rat GR 2014.svg 429 × 425; 38 KB
-
 Grosser Rat Graubünden, Sitzverteilung 2011.svg 512 × 256; 4 KB
-
 Lugano Conseil communal 2024.svg 360 × 185; 5 KB
-
 Martigny Conseil général 2020.svg 360 × 185; 4 KB
-
 Municipalité de Morges.svg 360 × 185; 1 KB
-
 National Council 30.11.2023.svg 360 × 185; 13 KB
-
 Parliamentary Groups Federal Assembly Switzerland 2023.svg 360 × 185; 15 KB
-

-
-
-
 Répartition des sièges au conseil général de Monthey 2020-2024.svg 360 × 185; 10 KB
-
 Saint-Gall 2020.svg 360 × 185; 6 KB
-
 Saint-Gall Conseil cantonal 2020.svg 360 × 185; 8 KB
-
 Sierre Conseil général 2020.svg 360 × 185; 4 KB
-
 Sion Conseil général 2020.svg 360 × 185; 4 KB
-
 Sitzverteilung KR SG-CH 12-16.svg 360 × 185; 6 KB
-
 Sitzverteilung Solothurn 2009.svg 1,024 × 512; 661 KB
-
 Sitzverteilung StGallen 2008.svg 1,024 × 512; 683 KB
-
 Sitzverteilung StGallen 2012.svg 512 × 256; 4 KB
-
 Sitzverteilung Thurgau 2008.svg 1,024 × 512; 766 KB
-
 Sitzverteilung Thurgau 2012.svg 512 × 256; 4 KB
-
 Soleure2021.svg 360 × 185; 6 KB
-
 Solothurn 2017.svg 360 × 185; 5 KB
-
 St.Gallen 2016.svg 360 × 185; 6 KB
-
 Suisse Conseil des États 2023.svg 360 × 185; 4 KB
-
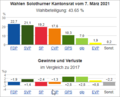
 Switzerland AR Kantonsrat 2019.svg 360 × 185; 4 KB
-
 Switzerland Council of States 2023.svg 360 × 185; 4 KB
-
 Switzerland Grisons Grand Council 2018.svg 360 × 185; 6 KB
-
 Switzerland National Council 2023 (2).svg 360 × 185; 13 KB
-
 Switzerland National Council 2023.svg 360 × 185; 12 KB
-
 Thurgau 2016.svg 360 × 185; 7 KB
-
 Thurgovie Grand Conseil 2020.svg 360 × 185; 9 KB
-
 Thurgovie Grand Conseil 2024.svg 360 × 185; 9 KB
-
 Thurgovie2020.svg 360 × 185; 7 KB
-
 Val de Bagnes Conseil général 2020.svg 360 × 185; 4 KB
-
 Wahldiagramm AR 2015.png 397 × 306; 22 KB
-
 Wahldiagramm BE 2014.png 442 × 319; 24 KB
-
 Wahldiagramm BL 2019.png 795 × 689; 48 KB
-
 Wahldiagramm BL 2023.png 398 × 322; 20 KB
-
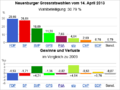
 Wahldiagramm GE 2013.png 442 × 334; 19 KB
-
 Wahldiagramm GL 2014.png 442 × 307; 22 KB
-
 Wahldiagramm NE 2013.png 442 × 330; 20 KB
-
 Wahldiagramm NE 2017.png 442 × 374; 24 KB
-
 Wahldiagramm NE 2021.png 441 × 330; 21 KB
-
 Wahldiagramm NW 2014.png 307 × 308; 19 KB
-
 Wahldiagramm OW 2014.png 307 × 328; 20 KB
-
 Wahldiagramm SG 2012.png 442 × 324; 19 KB
-
 Wahldiagramm SG 2016.png 442 × 320; 23 KB
-
 Wahldiagramm SG 2020.png 444 × 326; 20 KB
-
 Wahldiagramm SH 2012.png 397 × 328; 21 KB
-
 Wahldiagramm SH 2016.png 443 × 341; 27 KB
-
 Wahldiagramm SO 2013.png 442 × 298; 18 KB
-
 Wahldiagramm SO 2017.png 442 × 321; 19 KB
-
 Wahldiagramm SO 2021.png 397 × 320; 18 KB
-
 Wahldiagramm SZ 2012.png 262 × 328; 14 KB
-
 Wahldiagramm SZ 2016.png 442 × 328; 22 KB
-
 Wahldiagramm TG 2012.png 442 × 352; 18 KB
-
 Wahldiagramm TG 2016.png 442 × 328; 24 KB
-
 Wahldiagramm TG 2020.png 444 × 352; 18 KB
-
 Wahldiagramm TI 2011.png 397 × 336; 19 KB
-
 Wahldiagramm TI 2015.png 442 × 291; 24 KB
-
 Wahldiagramm UR 2016.png 352 × 363; 22 KB
-
 Кантональный Совет Швица 2012.png 894 × 849; 31 KB


.png)


.svg)


