Abstract
A current research topic for dielectric elastomer (DE) materials is the reduction of the thickness of the DE layer in order to achieve a lower operating voltage with the same electric field strength. As the ratio of the layer thicknesses of the electrode to the elastomer is therefore more important, the mechanical properties of the electrode layers are of greater significance. Several research articles deal with investigations, exploring the influence of electrode materials on the behavior of the DE transducer and emphasizing its importance. In analytical models, however, the electrodes are not usually considered separately, but the parameters are identified for the entire DE composite, consisting of elastomer and electrode layers. In contrast, in this article the material characterization is carried out separately for the two materials in a first step. In a further step, a holistic model for multilayer DE transducers is derived on the basis of this material-specific characterization and subsequently validated with measurements. For the DE layers, ELASTOSIL ® 2030 (EL 2030), and for the electrode layers, ELASTOSIL ® LR 3162 (EL 3162) are investigated, frequently used materials for DE transducers that offer reproducible properties for the investigation. EL 3162 is a carbon black filled elastomer material that exhibits higher elastic and viscose stresses as well as a significant rate-independent hysteresis compared to EL 2030. Experimental investigations of DE transducers with different electrode thicknesses are examined to validate the model and to demonstrate the significance and influence of the electrode layers on the transducer's performance. Furthermore, the influence of the electrode properties on the actuator, generator and sensor behavior of the DE transducer is analyzed based on the developed model. Depending on the thickness and number of layers, this underlines the relevance of the electrode properties and provides information on the optimized design of the DE transducer.
Export citation and abstract BibTeX RIS

Original content from this work may be used under the terms of the Creative Commons Attribution 4.0 license. Any further distribution of this work must maintain attribution to the author(s) and the title of the work, journal citation and DOI.
Nomenclature
 | Strain dependent sign factor of a Prandtl element in - |
| β | Electrical area ratio in - |
| δ | Thickness ratio in - |
| η | Linear viscosity material parameter in  |
| ηMW | Linear viscosity material parameter of the Maxwell element in  |
| κy | Deformation exponent in y-direction in - |
| κz | Deformation exponent in z-direction in - |
 | Prestretch in i-direction in - |
| λi | Stretch in i-direction in - |
| ω | Angular frequency in  |
| σi | True stress in i-direction in Pa |
 | Elastic true stress in i-direction in Pa |
| σel | Electrostatic pressure in Pa |
 | Plastic stress parameter of a Prandtl element n in Pa |
 | Frictional true stress in i-direction in Pa |
 | Viscoelastic true stress in i-direction in Pa |
| τe | Electrical time constant in s |
| τm | Mechanical time constant in s |
 | Lossy harvested energy in J |
| ε0 | Permittivity of vacuum in F m−1 |
| εi | Strain in i-direction in - |
| εe | Electrical strain in - |
| εfree | Free strain in - |
| εpre | Prestrain in - |
| εr | Relative permittivity in - |
 | Prestrain in i-direction in - |
| A | Cross sectional area in  |
| A0 | Cross sectional area in initial state in  |
 | Cross sectional area of the electrode in initial state in  |
| C | Electrical capacitance in F |
 | Electrical capacitance in initial state in F |
| C10 | Hyperelastic material parameter in Pa |
| C20 | Hyperelastic material parameter in Pa |
| C30 | Hyperelastic material parameter in Pa |
| d | Thickness of elastomer layer in actuation state in m |
| d0 | Thickness of elastomer layer in initial state in m |
 | Thickness of electrode layer in initial state in m |
 | Thickness of electrode layer in actuation state in m |
| E'' | Loss modulus in Pa |
| E' | Storage modulus in Pa |
 | Frictional stress slope in Pa |
| f | Frequency in Hz |
| Fi | Force in i-direction in N |
 | Blocking Force in N |
 | Electrostatic force in N |
 | Electrical Force in N |
 | Electrical limit frequency in Hz |
 | Mechanical limit frequency in Hz |
| I1 | First invariant of the left Cauchy-Green deformation tensor in - |
| l | Length of elastomer layer in actuation state in m |
| l0 | Length of elastomer layer in initial state in m |
 | Length of electrode layer in initial state in m |
 | Length of electrode layer in actuation state in m |
| N | Number of active elastomer layers in - |
 | Number of points where the individual measurements are evaluated in - |
 | Number of samples with same properties in - |
 | Number of Maxwell elements used to model viscoelastic stress in - |
 | Number of Prandtl elements used to model frictional stress in - |
 | Power of electric losses in W |
 | Hydrostatic pressure of the electrode layers in Pa |
 | Hydrostatic pressure of the inner elastomer layers in Pa |
 | Hydrostatic pressure of the outer elastomer layers in Pa |
| Q | Electrical charge in C |
| R | Serial resistance of the electrode in  |
| S | Sample configuration  {S0, S1, S2, S3} in - {S0, S1, S2, S3} in - |
 | Strain energy density in Pa |
 | Frictional hysteresis losses in Pa |
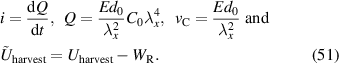
 | Lossless harvested energy in J |
 | Applied electrical driving voltage in V |
| w | Width of elastomer layer in actuation state in m |
| w0 | Width of elastomer layer in initial state in m |
 | Width of electrode layer in initial state in m |
 | Width of electrode layer in actuation state in m |
 | Energy of electric losses in J |
 | Linear elastic material parameter of the Maxwell element in Pa |
 | Linear elastic material parameter of a Prandtl element n in Pa |
1. Introduction: Multilayer thin film DE transducers
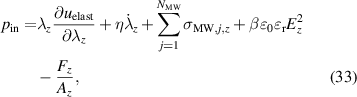
Dielectric elastomer (DE) transducers basically consist of a thin DE film coated with stretchable and conductive electrodes on both sides. By applying an electrical voltage to the electrodes, the Maxwell pressure  causes the dielectric to be compressed. Due to the material's incompressibility, the DE can be stretched in orthogonal directions, depending on the application boundaries and the transducer design. Rolled, stacked, and membrane transducers are some examples of possible DE transducer designs. An overview of DE transducer basics and several DE transducer designs is provided, among others, in [1, 2]. The properties of DE transducers, such as their bidirectional behavior, high energy density, low weight, and wide deformation ranges, enable applications as actuators, sensors and generators. Intelligent textiles [3], haptic devices [4], soft robotic [5], and wave energy generators [6] are some examples of application fields. In this contribution, stacked DE transducers with a rectangular base area [7] are investigated, but the scientific findings can be transferred to other designs, too. The working principle and the geometry parameters for a single layer DE transducer with a rectangular base area are shown in figure 1.

Figure 1. Working principle and geometry parameters of a single layer DE transducer with a rectangular base area: (a) initial state and (b) active state under applied voltage  .
.
Download figure:
Standard image High-resolution imageIn order to decrease the required electrical voltage, research is focused on reducing the thickness of the elastomer layers. Reachable elastomer layer thicknesses depend on the manufacturing process and the material itself. Common elastomer thicknesses are in the range of 20– [8]. In order to reduce the driving voltage, attempts are currently being made to make the layers thinner, down to 1–
 [9]. To maintain the volume for constant actuation capacity, DE transducers are realized in multilayer configuration, in which the electrodes are alternately connected electrically in parallel [7, 10-13]. The achievable electrode thickness depends on the electrode material, the processing methods, and the limitations due to the electrical properties. In [14] metal based and carbon black based electrodes are compared. Typically, carbon black based electrodes exhibit greater elasticity and increased electrical resistance than metal based electrodes. As a consequence, their impact on the DE transducer's behavior is lower in terms of mechanical properties. Nevertheless, as the elastomer thickness is reduced, the influence of the mechanical properties of carbon black based electrodes on DE transducer performance becomes more decisive [9]. Various influencing factors must be taken into account in order to describe the overall behavior and to be able to gain potential for optimization. As an extension of previous studies [15], the material parameters, obtained for the elastomer and electrode by tensile tests, are used in the present work to create a holistic model for DE multilayer transducers and to investigate the influence of the electrode on the overall behavior. In order to vary the electrode thickness, an elastomer material filled with carbon black is used to produce corresponding electrode layers with the Vermes MDS 3280 jetting system [16]. Usually, the electrode material is not separately characterized for DE applications, but there are several studies on modeling and characterization of filled elastomer materials, for example in the automotive field, see [5, 17, 18]. For the experimental investigation in this contribution the DE material ELASTOSIL® 2030 (EL 2030) [19] and the carbon black filled elastomer material ELASTOSIL® LR 3162 (EL 3162) [20] are taken into account, because on the one hand these commercially available materials have highly homogeneous and reproducible material properties, and on the other hand they are demonstrably suitable for manufacturing DE multilayer structures [10, 21].
The article is structured as follows. First, in section 2 suitable material models are defined for the two materials mentioned above and then parameterized by an experimental investigation with different strain rates. In contrast to [15], no compression tests are carried out, but rather tensile tests according to the standards proposed for DE materials in [22]. In section 3, the holistic model of a multilayer composite for DE transducers is derived. On the one hand, the model of only one DE layer from [23] is extended to arbitrary layers and, on the other hand, the viscous and hysteresis losses characterized in section 2 are also taken into account. The model obtained is transferred to representative configurations of DE transducers and parameterized exclusively with the material data determined in section 2 for the elastomer and electrode layers. The next step in section 4 is the validation of the holistic model. For this purpose, multilayer composites with different electrode thicknesses are produced, then measured with different strain rates and excitations in accordance with the investigation in section 2 and subsequently the experimental results are compared with the calculated results of the overall model. Finally, using the developed model, the influence of the electrode properties on the behavior of DE multilayer transducers is discussed on the basis of a parameter study for operation as an actuator, sensor, and energy harvesting system. In addition, the nomenclature used and further transducer models are listed in the appendix.
2. Material models and parametrization
Polymer materials are macro-molecules composed of repeating structural units, called monomers, and are characterized by long chains or networks of these monomers. An elastomer material is a polymer material with generally wide-meshed cross-linked polymer chains. In general, their mechanical properties are characterized by elasticity, creep, and relaxation behavior. A notable feature of elastomer materials lies in their hyperelastic material property. Numerous models have already been researched for this purpose. [24] presents a survey of 85 diverse models, for example.
An overview of modeling the viscoelastic properties of polymer materials is given, e.g. in [25]. The Kelvin–Voigt (damper and spring in parallel) and Maxwell elements (damper and spring in series) are typical rheological models used to model the viscoelastic properties of DE materials [26]. Furthermore, there exist several investigations modeling the viscoelastic properties by fractional elements [27].
The investigated electrode material EL 3162 represents an elastomer material, that is filled with carbon black particles to achieve flexible electrodes with sufficient electrical conductivity. Studies of filled elastomer material models and characterization are presented, among others, in [28, 29], and [30]. In [28] different filler contents are examined and an increase in the elastic and viscoelastic stress with increasing filler content is observed. Further, filled elastomer materials show a significant rate-independent hysteresis, caused by particle friction. In [18] this rate-independent hysteresis is modeled using Prandtl elements (spring and frictional element in series). When approximations with linear damping are used for this behavior, the damping effect is often overestimated. Since Prandtl elements can model rate-independent losses well, this modeling approach was used for DE transducers for the first time in [15] in order to characterize the mechanical properties of the electrode materials EL 3162 and PS 466. While in [15] pressed material was examined with compression tests, tensile tests according to the standards proposed for DE materials in [22] are carried out here.
2.1. Material model
Figure 2 illustrates the rheological material model used to describe the properties described above.

Figure 2. Assumed rheological material model, comprising elastic, viscoelastic, and friction elements.
Download figure:
Standard image High-resolution imageThe model includes the elastic σelast, viscoelastic σviscela, and friction true stresses σfric, whereby isotropic material properties are assumed. Equation (1) gives the stress balance in i-direction  describing the material behavior.
According to figure 2 the elastic properties are represented by a non-linear spring, the viscoelastic properties by one linear damper and a generalized Maxwell model, while the frictional properties are considered with a generalized Prandtl model. These properties are investigated in the next sections in detail. The stresses are related to the deformed cross-section in order to obtain the true stresses. Therefore, the relation between stretch λi and strain εi is defined with:

2.1.1. The elastic stress.
 in i-direction can be derived from the strain energy density
  and the hydro-static pressure p depending on the stretch λi as presented in (3).
2.1.2. The frictional stress.
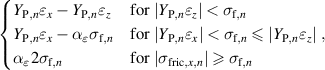
 is modeled with several Prandtl elements, consisting of a linear spring and a frictional element in series. Prandtl elements are used to describe stick-slip behavior of materials, which requires case distinction according to [18]. If the stress is lower than the stress parameter σf of the frictional element, the linear spring effect occurs, otherwise the stress is constant. The sign depends on the direction of the strain εi. This case distinction is demonstrated for one Prandtl element n in (4) using the linear spring parameter
  , the frictional stress parameter
  , and the strain dependent sign factor
  .
.

2.1.3. The viscoelastic stress.
 is simplified with one damping element and a generalized Maxwell model in parallel. The damper models a linear viscose stress depending on the velocity in i-direction with the linear viscosity η:

Each Maxwell element consists of a linear spring (linear modulus of elasticity  as material parameter) and damper (having a linear viscosity parameter
  as material parameter) in series and is usually used to model the relaxation properties of elastomer materials, whereas the parallel damper describes the creeping properties [25].
The viscoelastic stress is determined by the sum of the generalized Maxwell model and a damper model in parallel:
2.1.4. The generalized material model.
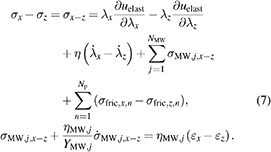
Is finally obtained with two systems of equations considering the material model in all three spatial directions under the assumption of incompressibility. For this, the stress balances in the three directions x, y, and z according to (1) and the stress expressions defined in (3), (4), and (6) are considered. Equation (7) consider the x- and z-direction, whereas the equations are transformed with the help of the hydrostatic pressure p. The equations in the y- and z-directions can be derived analogously by replacing the index x with the index y in (7).
2.2. Experimental material parameter identification
To identify the material parameters, specimens of the two base materials in a pressed state are experimentally examined. The two materials are provided by Wacker Chemie AG and were processed in dog bone shape, a typical geometry for tensile testing [22]. The samples and their dimensions are shown in figure 3, where two samples per material are measured. The test bench, demonstrated in figure 10, is used with appropriately adapted clamps for the tensile test. The test bench itself is explained more in detail in section 4. The stroke is controlled and the force is measured. For the parameter identification the true stress σi is needed and calculated using the measured force Fi, the cross-sectional area in initial state  , and the stretch λi.
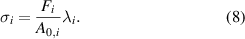

Figure 3. Tensile test samples and their geometry for the two materials EL 3162 and EL 2030.
Download figure:
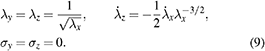
Standard image High-resolution imageDue to the geometry used, an uniaxial deformation can be assumed for the tensile test samples [22]. Combined with the incompressibility property of elastomer materials, the following conditions for the stretch λi, the velocity  , and the stress σi apply:
According to the material model presented in (7), different experimental investigations are needed to identify the parameters of the elastic, viscoelastic, and frictional model parts. The three associated experimental tests and identification methods are discussed in the next paragraphs. For identifying the material parameters, the error between the measured and calculated stress is minimized by optimizing the corresponding material parameters using the least squares method and the simplex algorithm. The hyperelasticity is characterised in a strain range of  –50%, according to [22]. For the friction and viscoelastic material parameters a prestrain of
  is exemplary determined. The influence of the prestrain or larger strain ranges on the material behavior is not the focus of this paper, since the main focus is to outline the different material behavior of the electrode layers compared to the elastomer layer, and to model and analyze the influence of electrodes on the DE transducer behavior.
2.2.1. Hyperelastic material model.
According to the generalized model (7) and the uniaxial deformation assumption (9), the effective elastic stress in x-direction is defined by:
Several earlier investigations deal with different model assumptions for the strain energy density  for DE materials. For this reason, this study does not analyze different models. Since figure 4 shows a strongly non-linear behavior in the stress–strain diagram for the electrode material EL 3162, the Yeoh model was selected for this, while a Neo-Hookean model appears to be appropriate for the elastomer material EL 2030. Using the first invariant of the left Cauchy-Green deformation tensor
  the following assumptions of these two models are defined.

Using the uniaxial deformation assumption of (9), the two elastic models of (11), (12), and the effective elastic stress defined in (10), the following two hyperelastic equations are derived:

Figure 4. Measured and calculated stress–stain curves for EL 2030 (calculated with Neo-Hookean) and EL 3162 (calculated with Yeoh).
Download figure:
Standard image High-resolution image
To define quasi-static conditions a speed variation was first carried out and a strain rate of  was found as suitable. The results are illustrated in figure 4.
Since the electrode material EL 3162 has a significant static hysteresis as expected, the characteristic curve averaged from the hysteresis is used for the parameterization. A characteristic property of the behavior is represented by the inflection point (see figure 4), at which the gradient changes from decreasing to increasing. If the gradient increases the local Young's modulus increases, resulting in stiffer material behavior. For EL 3162 the inflection point is determined at a strain of  , for EL 2030 it is outside the measuring range. Furthermore, the measured stress is significantly higher for EL 3162 compared to EL 2030, resulting in larger material parameter values as shown in table 1.
Table 1. Identified parameter values of the hyperelastic material models.
| Material | C10 in MPa | C20 in MPa | C30 in MPa |
|---|---|---|---|
| EL 2030 | 0.169 | −0.0095 | 0 |
| EL 3162 | 0.240 | −0.0882 | 0.119 |
Table 1 shows that the Neo-Hookean model for the elastomer material 2030 is sufficiently accurate in the identification range. The additional values given for the parameters  and
and  of the Yeoh model are negligibly small or zero. The linear Young's modulus is calculated with
  , resulting in
  for EL 2030 and
  for EL 3162. These values basically represents the greater stiffness of EL 3162 compared to EL 2030.
2.2.2. Friction material model.
Since only EL 3162 has a significant static hysteresis as shown in the previous section, the friction material model is parameterized only for electrode material. According to (4), (7), and (9) the effective friction stress in x-direction for the Prandtl elements is defined:

For the parameter identification several quasi-static sinusoidal-strain functions are applied for a prestrain of  and a variation in strain amplitude
  –10%. The frequency is determined as a function of the strain amplitude so that the maximum velocity
  is not exceeded to ensure quasi-static conditions. To determine the friction hysteresis separately, the elastic material properties must be considered (compare figure 2 and equation (1)). Therefore, the measured stress σx is subtracted by the hyperelastic stress σelast (see figure 5(a)) determined with the already parameterized elastic model from the paragraph before, according to:


Figure 5. Approach for friction parameter identification: (a) stress–strain curves with variation in the strain amplitude  and (b) definition of the two characteristic values hysteresis losses
  and stress slope
  .
.
Download figure:
Standard image High-resolution imageAs figure 5(b) illustrates, two characteristic values can be exploited for the parameter identification, the hysteresis losses  and the stress slope
  , as demonstrated in [18]. Measurements are carried out with different maximum strain values and in each case
  and
and  is calculated. The Prandtl parameters
  and
and  are then parameterized in a way that the deviation between the measured and estimated values becomes minimal. The measurements, the basic procedure according to the identification method in [18], and the model results obtained with the estimation are shown in figures 5 and 6.

Figure 6. Results of the friction parameter identification using three Prandtl elements: (a) stress slope  over the strain amplitude
  , (b) hysteresis losses
  over the strain amplitude
  , (c) friction stress
  over strain difference Δε, and (d) superposition of the hyperelastic stress
  and the friction stress
  over strain difference Δε.
Download figure:
Standard image High-resolution imageThe number of Prandtl elements was varied in the range of one to four. It was found that a number of three Prandtl elements provides satisfying accuracy within the investigated amplitude range, since no significant change in  and
and  for three elements compared to four elements was noticed.
The experimental data and analytical results are compared in figure 6. The corresponding parameter values can be found in table 2.


2.2.3. Viscoelastic material model.
For the parameter identification of the Maxwell elements and the additionally considered damper in parallel sinusoidal strain excitations in a small signal range with a strain amplitude of  , a prestrain of
  , and a frequency range of
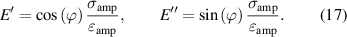
  are experimentally investigated. To separate the viscoelastic stress from the measured stress, the already parameterized friction and hyperelastic model are used and the calculated static stresses are subtracted from the measured stress resulting in the viscoelastic stress. For the parameter identification the stress amplitude σamp, stretch amplitude λamp, and the phase angle ϕ are determined based on the measured viscoelastic stress–stretch trajectory enabling the calculation of the storage E' and loss modulus E'' with (17) as carried out in [25].
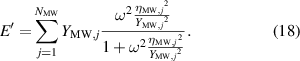
From the parameters of the linear Maxwell elements ( and
and  ) and the damper in parallel (η), the storage modulus E' and the loss modulus E'' can be determined as a function of the angular frequency:
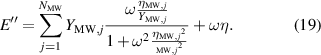
In order to apply (18) and (19) for the identification, the measured stretch λx must first be converted to an equivalent stretch  considering the uniaxial deformation assumption of (9)

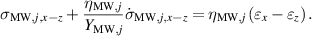
Corresponding to (7), (9), and (20), the viscose stress of the linear damper and Maxwell elements results in

For parameter identification the number of Maxwell elements was varied in the range of one to five elements. The challenge is to find a suitable parameter set so that the deviation for the storage and loss modulus is minimized over the measured frequency range. Both deviations of the modules between model and measurement are minimized with the same weighting. It turned out that the model error decreases only slightly with increasing number of Maxwell elements, consequently the material model is parameterized with only one Maxwell element and the linear damper in parallel, see figure 2. The resulting modules are compared with the measured ones in figure 7 in the frequency domain and the corresponding model parameters are provided in table 3.

Figure 7. Results of the viscoelastic parameter identification: (a) measured and calculated storage modulus E' versus frequency f and (b) measured and calculated loss modulus E'' versus frequency f, for both the electrode and the elastomer material.
Download figure:
Standard image High-resolution imageTable 3. Identified viscoelastic parameter values.
| Material | ηb |  a a |  b b |
|---|---|---|---|
| EL 2030 | 0.3 | 0.11 | 0.19 |
| EL 3162 | 5.3 | 0.99 | 693 |
According to figure 7 the storage modulus of the electrode material EL 3162 has a strong increase in the range of low frequency  , resulting in a significant stiffening during dynamic operations. For frequencies
  the changes in the storage modulus and the viscosity parameter are small compared to the low frequency range. Both, the storage and loss modulus are quite high for EL 3162 compared to EL 2030, which indicates that in addition to stiffening and hysteresis, the electrode material causes both higher loss and relaxation. This can also be seen by the identified parameters, as they are approximately 5–12 times higher for EL 3162 compared to EL 2030. Although the model shows some deviations over the measured frequency range, the significant differences in the viscoelastic properties of the two investigated materials are modelled in a sufficient way and an impact of the electrode material properties on the behavior of DE transducers can be expected.
3. Holistic model of multilayer DE transducers considering the influence of the electrodes
After the parameters were identified separately for an electrode material and an elastomer material, in this section a multilayer transducer model is developed considering both, the electrode and elastomer layers. The impact of the electrode properties is discussed in several papers. For example, in [31] the DE transducer behavior is experimentally investigated by varying the electrode material and in [21] by varying the electrode thickness. Nevertheless, the electrodes are usually not modeled separately, but rather the elastic parameter identification is performed for the whole DE transducer, as it is done in [32, 33]. Modeling both layers separately, as it is done in this contribution, has the advantages of a deeper understanding of the transducer's behavior on the one side and allows a tailored transducer optimization considering the impact of the electrode layers on the other side, although it leads to a more complex model. In contrast, if a model is needed for control and system engineering, for example, the common approach of combining both layers into one is advantageous because it leads to simpler equations. The analytical model approach in [23] combines for the first time a model for one elastomer layer with a model of electrode layers on the top and bottom side. The model assumes only uniaxial deformation and an out-of-plane actuation.
Contrary to [23], in this contribution the model is extended to a general formulation that is independent of the actuation direction and deformation assumption. In addition, the extended material models presented in the previous section, are used and an arbitrary high number of layers is taken into account. Consequently, the elastomer layers are described with a material model comprising elastic and viscoelastic properties, while the electrode layers are represented by elastic, viscoelastic, and frictional properties. The examined model approach including the assumed interacting forces is visualized in figure 8. Elastomer layers are colored green, whereas the electrode layers are colored blue. For insulation reasons, it is assumed that, that the bottom and top layers are elastomer layers. The model considers the mechanical forces in i-direction for the outer elastomer layers  , inner elastomer layers
  , and the electrode layers
  as well as the equivalent electrostatic force
  in z-direction.

Figure 8. Schematic illustration of the investigated DE multilayer transducer model with elastomer layers in green and electrode layers in blue.
Download figure:
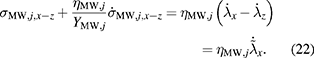
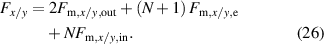
Standard image High-resolution imageThe following model is based on the assumption of homogeneous deformation and an ideal connection between the elastomer layers and electrodes. Three force balances in the z-direction (23)–(25) and one each in the x- and y-direction (26) are derived from figure 8, considering an arbitrary number of N active elastomer layers.


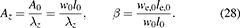
The equivalent electrostatic pressure  and the corresponding electrostatic force
  in z-direction are defined by (27), with the active area ratio β (defined in [26]), the vacuum permittivity
  , the relative permittivity εr and the electrical field strength E.


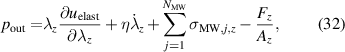
According to (1), the mechanical forces in i-direction are given by:
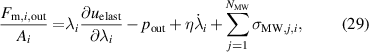
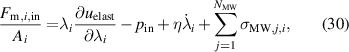
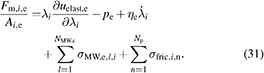
With (27)–(31) and the three force balances in z-direction (23)–(25), the three hydrostatic pressures for the two outer elastomer layers  , the active inner elastomer layers
  , and the electrode layers
  are provided by
For the derivation of the holistic model a thickness ratio is defined as the ratio of the electrode thickness to the elastomer thickness according to [23]:
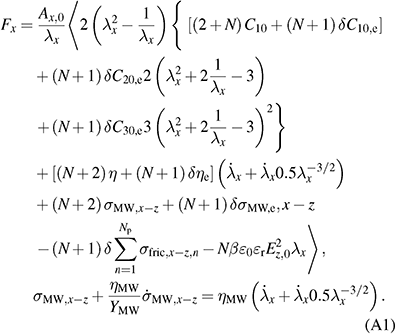
Using the force balance in x-direction (26), the definition of the mechanical forces (29)–(31), and the equations of hydrostatic pressure (32) and (33), the following general DE transducer model is derived in (36), with the abbreviation γx and the stresses of the individual Maxwell elements in (37).
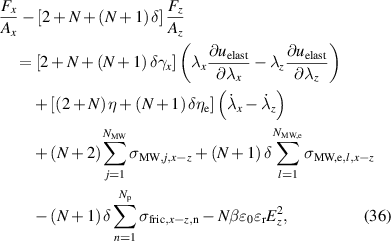
with:
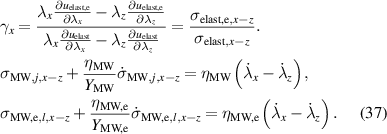
Similarly, the force balance in y-direction can be examined by simply replacing the index x with y in (36).
Finally, by applying the specific derived models for elastomer and electrode layers, direction of actuation, and boundary conditions for deformation (including the incompressibility condition), the transducer model in actuation direction can be deduced based on (36). Depending on the point of view, input and outputs of the model can be user defined. The state space representation, typically used in the field of system engineering can be obtained by selecting the external force and electric field as inputs. The strain in actuation direction and the stress of each Maxwell element are the state variables and therefore the relevant output of the model. Exemplary, transducer models with specific assumptions, which, among other are required for the following sections, are presented in the appendix.
4. Experimental investigations and validation of holistic transducer model
In this section, DE transducers with an in-plane actuation direction and varying electrode thickness are investigated to validate the modelling approach of section 3. Electrical characterizations are performed by measuring the capacitance, while mechanical tests are performed by measuring the stress–strain curves and the complex modulus. In addition, the electromechanical force and strain behavior is investigated by applying an electric field strength. First, the samples and the test bench are introduced, followed by a presentation and analysis of the measurement results, including the model validation.
4.1. Samples and test bench
Referring to [22] DE transducers should have an aspect ratio of at least 1:5, better 1:10, for electromechanical tests to be able to assume a uniform strain and electric field over the sample. The investigated DE actuators exhibit an aspect ratio of 1:9 in the undeformed state and consist of three active layers  . The layers on the bottom and top side are elastomer layers, corresponding to the model in section 3. All samples are produced with an elastomer film based on the material EL 2030 with a thickness of
  . The electrode layers are printed using the jetting system Vermes MDS 3280 applying an ink based on EL 3162. The film-based manufacturing process is explained in detail in [10]. Printing is the preferred method to produce thin and structured electrode layers with high precision. While in [34] both the electrode layer and the elastomer layer are printed with an inkjet printer, in [16] a carbon black-based electrode ink is printed with the jetting system from Vermes Microdispensing. This jetting system, integrated in the manufacturing process [10], ensures a reliable and flexible printing process in terms of printing accuracy and electrode variation.
For analyzing the impact of the electrode layers, printing parameters are varied to achieve variation in electrode thickness, and thus in thickness ratio δ. For the mechanical tests a sample configuration S0 without electrodes is investigated. The electrode thickness was measured with the confocal displacement sensor Keyence CL-P015G, resulting in the three thickness ratios  Four equivalent samples were examined for each sample configuration S0
 , S1
, S1 , S2
, S2 , and S3
 (see figure 9).

Figure 9. Manufactured DE transducers: (a) investigated samples, (b) actuator geometry, and (c) measured electrode thicknesses.
Download figure:
Standard image High-resolution imageFigure 9(a) shows the investigated samples, (b) the sample geometry parameters, and (c) the results of the three measured electrode thicknesses. The samples are electrically connected along the long side and hold by clamps. The sample is fixed on the bottom and the reaction force is measured there as shown in figure 10. A strain gauge based force sensor (ME-systems, KD40, 50 N) is used for the quasi-static measurements and a piezoelectric force sensor (Kistler, Typ 921A/A1) for the dynamic measurements. On the upper side of the sample, the stroke and thus the strain is controlled using a linear motor (Voice Coil VM8054-630), whereby the position is measured with a laser sensor (Micro Epsilon, optoNCDT 2220) on the top of the linear motor's slider.

Figure 10. Test bench used for the material characterization and the DE transducer measurements.
Download figure:
Standard image High-resolution image4.2. Measurement results and model validation
First, the capacitance is measured and the results are used to fit the deformation assumption. The stress–strain curves as well as the storage and loss modulus are then investigated for the mechanical behavior. The actuation force and the strain are measured by varying the prestrain  .
.
4.2.1. Electrical characterization.
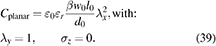
The electrical capacitance is measured with a variation in prestrain using an LCR meter (GW Instek LCR-817). In the LCR meter, a serial model is chosen as an equivalent circuit for the capacitance measurement. The measurement frequency is set to 100 Hz, which is within the bandwidth of the DE transducer. The definition of the capacitance, under consideration of parameter  in [26], independent of the deformation assumption, is given in (38) and for assumption of planar deformation in (39),
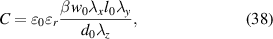
According to figure 11, the measurements and calculated results coincide well in the undeformed state, but the change in capacitance when prestrain is applied, shows a distinct difference when assuming a planar deformation, although the aspect ratio of the samples is 1:9 in the undeformed state. Thus, the sample does not deform in a planar way as assumed, but rather a deformation in y-direction can be observed (showing a narrowing at the two free sides). As the prestrain is increased, the aspect ratio decreases and the effect of narrowing increases. Further, parts of the sample are squeezed due to clamping, that also affects the deformation.

Figure 11. Electrical testing results: measured and calculated capacitance change ΔC. over strain and absolute capacitance  for the undeformed state
  .
.
Download figure:
Standard image High-resolution imageTo improve the capacitance model, the occurring deformation is approximated by introducing the deformation exponent κy in y-direction and κz in z-direction with the following correlation:

In order to fulfill the property of incompressibility, condition (41) is required.

The equations (38), (40), and (41) lead to the improved capacitance model:
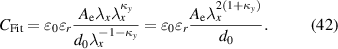
For planar deformation the coefficient is  and for uniaxial deformation
  . For the discussed measurements a factor of
  appears suitable, which is in between. The results are summarized in figure 11.
For the subsequent mechanical and electromechanical model validation, the determined assumption of real deformation, which is considered in (40) and (41), is used. The obtained model is presented in the appendix
For the following evaluation of the overall modeling, the statistical error measure normalized root mean squared error (NRMSE) was selected:
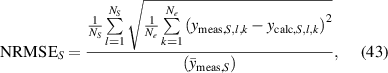
where  {S0, S1, S2, S3} represents the sample configuration, NS is the number of samples with same properties, and Ne is the number of sample points where the individual measurements are evaluated. The corresponding NRMSE values can be found in tables 4-6 for mechanical elastic, viscoelastic, and electromechanical tests, respectively.
Table 4. NRMSE of the mechanical elastic testing (see figure 12(a)).
| Sample | S0 | S1 | S2 | S3 |
|---|---|---|---|---|
| NRMSE(F) | 8.50% | 3.81% | 6.50% | 10.1% |
Table 5. NRMSE of the mechanical viscoelastic testing (see figure 13).
| Sample | S0 | S1 | S2 | S3 |
|---|---|---|---|---|
| NRMSE(E') | 35.1% | 21.3% | 23.1% | 23.1% |
| NRMSE(E'') | 23.4% | 48.9% | 23.6% | 32.1% |
Table 6. NRMSE of the electromechanical testing (see figure 14).
| Sample | S1 | S2 | S3 |
|---|---|---|---|
NRMSE( ) ) | 10.3% | 8.56% | 6.99% |
| NRMSE(εpre) | 10.7% | 20.5% | 11.1% |
4.2.2. Mechanical elasticity testing.
Force–strain curves were measured in the strain range of  at low velocity (
 ), so that a quasi-static behavior assumption is justified. In figure 12(a) the mean measured curves of four comparable samples for each sample configuration are illustrated. To evaluate the changes with the thickness ratio, the averaged force increase
  with respect to the averaged force measured for sample S0 according to (44) and the hysteresis losses
  (see figure 5) are determined (see figures 12(b) and (c)).
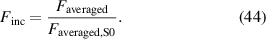

Figure 12. Mechanical elastic testing results: (a) force F depending on strain ε, (b) force increase  depending on thickness ratio δ and (c) hysteresis losses
  depending on thickness ratio δ.
Download figure:
Standard image High-resolution imageAs expected, the force and the hysteresis as well as their losses increase when the thickness ratio is enlarged, due to the material properties. Although the measured force over the strain shows certain deviations compared to analytic values, the calculated force increase  shows an accetable match for different thickness ratios. The calculated hysteresis loss appears slightly too high, however, the trend for varying δ coincides well with analytic values.
4.2.3. Mechanical viscoelastic testing.
As next, the storage E' and loss modulus E'' were determined corresponding to the viscoelastic parameter identification in section 2.2, and in accordance with (17), by applying sinusoidal-strain-excitation. The stress is measured and calculated, respectively. The investigation is performed for the three exemplary frequencies  ,
,  , and
, and  , a prestrain of
  and a strain amplitude of
  . The measured and calculated results are illustrated in figure 13.

Figure 13. Mechanical viscoelastic testing results: storage modulus E' on the left and loss modulus E'' on the right depending on the thickness ratio δ for the three different frequencies f = 1 Hz, f = 3 Hz, and f = 10 Hz.
Download figure:
Standard image High-resolution imageCorresponding to larger storage and loss modules for the electrode material (see figure 7) both values increase with an increase in thickness ratio δ. Especially for the frequency f = 3 Hz, the calculated and measured values show a good agreement, whereas the difference is higher for f = 1 Hz and f = 10 Hz. This behavior can be explained by the model error of the viscoelastic material behavior of the pure materials (see figure 7). For example, the storage modulus of EL 3162 is underestimated for f = 10 Hz, which means that the storage modulus of the DE transducer is also underestimated. Nevertheless, the tendency for the examined frequencies is well modeled and thus, the impact of the electrodes on the viscoelastic DE transducer behavior is sufficiently calculated. It should be mentioned that these models are very sensitive to uncertainties and can hardly be improved by adding further Maxwell elements.
4.2.4. Electromechanical testing.
In [22] the two electromechanical values, the electrical force  and electrical strain εe are introduced, both generated by the electrical field strength. Accordingly, these two characteristic values are measured for an electrical field strength of
  and a prestrain range of
  –50%. The voltage is reduced as a function of the prestrain to maintain a constant electrical field strength. In figure 14 the measured and calculated results for the electrical force and strain are compared on the left and the value changes according to sample S1 (sample with the lowest electrode thickness) and a prestrain of
  on the right.

Figure 14. Electromechanical testing results: (a) electrical force  depending on prestrain
  , (b) changes of electrical force compared to electrical force with sample S1 and prestrain
  , (c) electrically induced. Strain εe depending on prestrain
  and d) changes of electrical strain compared to electrical strain with sample S1 and prestrain
  .
.
Download figure:
Standard image High-resolution imageBoth, the measurement and the calculation do not indicate noticeable influence of the electrode thickness on the electrically generated force. Since the electrical field strength is kept constant at  , the electrical force decreases by increasing prestrain due to a reduction of the actuation area. The measured electrically generated force is about 15% lower than the calculated values, however the dependence of thickness ratio and prestrain are accurately modeled.
The electrically induced strain decreases as the electrode thickness increases as expected, and as the prestrain increases. Initially it rises to a maximum value and then it decreases. Although the absolute values are calculated slightly too high, model deviations when varying the electrode thickness are comparatively small. For both, the measured and calculated results, a shift of the maximum electrical strain to a lower prestrain can be observed by increasing the electrode thickness. An explanation for this behavior can be found in the nonlinear elasticity of the electrode material. As already discussed in section 2, EL 3162 is characterized with an inflection point in the stress–strain curve at about  (see figure 4), while the inflection point of EL 2030 is observed for
  . Consequently, the point of maximum strain of the DE transducer decreases with the increase of the electrode thickness resulting in a shift of the maximum achievable electrical strain to lower prestrain
  . In conclusion, it can be stated that the calculated values for the electrically generated strain and force are slightly too high, but the influence of the thickness ratio caused by the electrode thickness is well represented.
It was shown that explicit material models for the elastomer and the electrode (section 2) can be used to derive holistic models for multilayer DE transducers (section 3) with sufficient validity. Although the absolute values deviate slightly, the influence of the electrode properties on the overall behavior can be determined very well with the tranducer model. Two main reasons are hypothesized for the model inaccuracies. First, the calculation assumes material parameters that are identified for pressed pure materials (see section 2.2), but may differ from the material properties of the printed electrode layers and the thin elastomer film. Secondly, the clamps can influence the mechanical behavior by squeezing the sample resulting in a thickness increase.
5. Analyzing the electrode influence on the DE transducer behavior
Finally, this section discusses different effects of the electrode properties on the three operations actuation, sensing, and energy harvesting using the developed transducer model according to (36).
5.1. Actuator operation
DE actuators are suitable for several different applications. Exemplary, a multilayer stacked DE actuator with a square actuation area of  and an active area ratio of β = 0.8, is analyzed in this section. This is a typically investigated geometry in the field of valve applications [35]. To derive the corresponding model from (36) an out-of-plane actuation, a uniaxial deformation, and the Yeoh model for the electrode material and the neo-Hookean model for the elastomer material are applied. The corresponding model is presented in appendix
  , which is defined by
  , and the free strain εfree, where
  applies, are shown in figures 15(b) and (c) as a function of δ assuming constant electrical field strength
  . The calculation is based on quasi-static conditions, so the viscoelastic properties are neglected.

Figure 15. Influence of thickness ratio on DE actuator performance: (a) free strain εfree over electrical field E for three different thickness ratios δ, (b) blocking force  for an electrical field of
  with variation in the thickness ratio δ, and (c) free strain εfree for an electrical field of
  with variation in the thickness ratio δ.
Download figure:
Standard image High-resolution imageIncreasing the thickness ratio δ significantly reduces the blocking force and the free strain for out-of-plane actuation. A thickness ratio of δ = 0.1 already reduces the free strain from  to
to  and the blocking force from
  to
to  . In addition, figure 15(a) demonstrates the increase of rate-independent hysteresis for thicker electrode layers. To achieve maximum mechanical power, the electrode layer thickness should be as low as possible according to the mechanical properties. But, the lower limit also is restricted by the electrical properties and the manufacturing process. The developed model allows an optimization of the electrode material properties and thickness, including both the electrical and mechanical influence on the DE actuation behavior.
5.2. Sensing operation
Among others, exemplary sensing operations are measuring the expansion of battery cells [36], touch pads [37], or facial expression analysis [38]. DE-based sensing uses capacitance and resistance changes, e.g. by measuring current and voltage. Based on the capacitance changes the displacement and the force can be determined. As carried out in [39] force sensing requires a DE transducer model. In [39] the material parameters of the investigated physical model are identified for the transducer, thus, by changing the transducer's properties a new parameter identification is needed. The model presented in this paper allows a reduction of the necessary parameter identification for various investigated transducers.
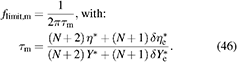
Self-sensing methods, see e.g. [40], enable the combination of actuating and sensing operations. Here, the high voltage signal for the actuating operation is superimposed by a high frequency sinusoidal signal for the sensing operation meanwhile current and voltage are measured. The lower limit of the superimposed frequency is given by the mechanical limiting frequency  to suppress mechanical actuation whereas the upper limit is set by the electrical limiting frequency
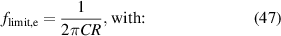
  depending on the electrode thickness. The influence of the electrode thickness and properties on these two frequency limits is discussed in the following. To calculate the mechanical limiting frequency
  the transducer model from (36) is simplified by reducing the material models to a linear spring and damper in parallel (Kelvin–Voigt element) for both the elastomer and electrode layers resulting in a linear ordinary differential equation presented in (45), whereby
  is assumed.
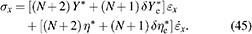
According to the material characterization of section 2 for high frequency f > 10 Hz and low strain range  the required parameter values can be derived with
  ,
,  ,
,  ,
,  .
.
Based on (45) the mechanical time constant τm is determined enabling the calculation of the mechanical limiting frequency  as given in (46).
The electrical limiting frequency  is calculated assuming that the electrical resistance and capacitance are in series. Under the condition of a constant electrical capacitance around a prestretch
  and a uniaxial deformation, the equations (47) and (48) are obtained [41].
To demonstrate the importance of the viscoelastic properties of the electrode layers for designing a self-sensing DE actuator, the mechanical and electrical limiting frequencies are calculated as an example for the following geometry:  ,
,  ,
,  ,
,  ,
,  and N = 8. Based on tables 1 and 3 the mechanical material properties are derived. The electrical properties are defined in the data sheets of EL 3162 [20] and EL 2030 [19]. We obtain the following values
  ,
,  ,
,  ,
,  ,
,  and
and  . The corresponding mechanical limiting frequency for a thickness ratio of δ = 0
  and for a variation of the thickness ratio
  , as well as the electrical limiting frequency
  are shown in figure 16.

Figure 16. Influence of thickness ratio on mechanical and electrical limiting frequency needed for self-sensing operations.
Download figure:
Standard image High-resolution imageThe mechanical limiting frequency  decreases with an increasing thickness ratio δ. In contrast, the electrical limiting frequency
  increases with an increasing thickness ratio. Thus, the suitable frequency and thickness ratio range increases by considering the electrode properties. Lower thickness ratio enables lower deformation force, whereas a reduced superimposed frequency results in lower power dissipation.
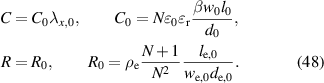
5.3. Generator operation
For the generator operation different energy cycles are possible. Wave energy and river flow are exemplary investigated energy sources [42]. This section discusses a simplified energy cycle with a linearly increasing force up to  and a constant electrical field
  during relaxation. The so called E-cycle with a normalized force and electrical field is demonstrated in figure 17(a). In addition to the electrical losses, the influence of electrode stiffening is investigated. Typically, DE generators are operated in the low-frequency range, and therefore, the viscous losses are neglected. But the mechanical losses due to the electrode's friction behavior are dominant in this context. To show the influence of the electrode thickness the lossless harvested energy
  and the electric losses
  caused by the electrode resistance
  are calculated per cycle, resulting in a lossy harvested energy
  :
:

Figure 17. Influence of the electrode layers on generation operation: (a) investigated energy changing cycle, (b) lossless harvested energy  and electric losses
  depending on the thickness ratio δ and (c) lossy harvested energy
  depending on the thickness ratio δ.
Download figure:
Standard image High-resolution image
As an example, a transducer with an equibiaxial deformation assumption, an in-plane actuation, and a geometry with  ,
,  ,
,  , and N = 8 is calculated. The strain is determined using the model in appendix
The capacitance C0, and the resistance R0 in (48) as well as the relative permittivity εr and the volume resistance ρe corresponds to the definitions from the previous sensing section.
In figure 17(b)  represents a loss-free energy gain under the assumption of ideally conducting electrodes and without the influence of mechanical electrode properties. When considering the influence of the mechanical properties of the electrode the harvested Energy
  (dashed line) decreases by increasing the thickness ratio. To maximize
  , the thickness ratio should be as small as possible. In contrast to this, the electrical losses
  in figure 17(b) decreases with increasing values of δ, thus the thickness ratio should be increased according to electrical losses
  . With this, an optimal thickness ratio can be determined by analyzing the generated energy
  as shown in figure 17(c) with the dashed curve. In our example an optimal thickness ratio is determined with δ = 0.18. As a result, the mechanical electrode properties are essential for optimizing the DE generator design.
6. Conclusion
In this paper we derive an analytical model that considers the material models for both the elastomer and electrode layers. Therefore, a material characterization was first performed analysing the pure materials EL 2030, used for the elastomer layers, and EL 3162, used for the electrode layers. Compared to EL 2030, EL 3162 exhibits significantly higher elastic and viscoelastic material behavior, as well as a rate-independent hysteresis due to the carbon black filler. Based on this parameterized material models, a general holistic model of a multilayer DE transducers is derived. Beyond that, DE transducers with different electrode thicknesses, and therefore different thickness ratios δ, were experimentally investigated and used for a validation of the overall model. The model predicts the influence of the electrode layers sufficiently accurate, although the absolute values of measurement and model are slightly different. Model inaccuracies can be ascribed primarily to the influence of the clamps used in the experiments and to different material properties between the characterized pressed materials and the thin elastomer films and printed electrode layers used in the investigated transducer. The valid model describes multilayer DE transducers with an arbitrary number of elastomer and electrode layers, taking into account different load cases and operating conditions. We have demonstrated the significant influence of the electrodes using representative applications for actuation, sensing, and energy harvesting. The study thus represents a helpful contribution to the optimization and design of multilayer DE transducers. In future, the influence of the manufacturing process on the material properties of the elastomer and electrode layers will also be taken into account. In addition, further investigations of the electromechanical behaviour are planned, which include excitations with different pre-stretching and variable electric field strength.
Acknowledgments
This contribution is accomplished within a project funded by the German Federal Ministry of Education and Research under Grant Number 13XP5124A. We acknowledge support by the Open Access Publication Fund of TU Berlin. We would like to thank Wacker Chemie AG for providing the investigated materials.
Data availability statement
The data cannot be made publicly available upon publication because the cost of preparing, depositing and hosting the data would be prohibitive within the terms of this research project. The data that support the findings of this study are available upon reasonable request from the authors.
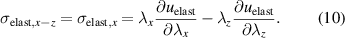
Appendix A: Transducer model with an in-plane actuation direction and a uniaxial deformation assumption
Assumptions:
- in-plane actuation in x-direction,
- uniaxial deformation with
 and ,
and , - Yeoh model for elastic material model of the electrode layers,
- Neo-Hookean model for elastic material model of the elastomer layers.


Transducer model:
Appendix B: Transducer model with an in-plane actuation direction and a planar deformation assumption
Assumptions:
- in-plane actuation in x-direction,
- planar deformation with , and ,
- Yeoh model for elastic material model of the electrode layers,
- Neo-Hookean model for elastic material model of the elastomer layers.


Transducer model:
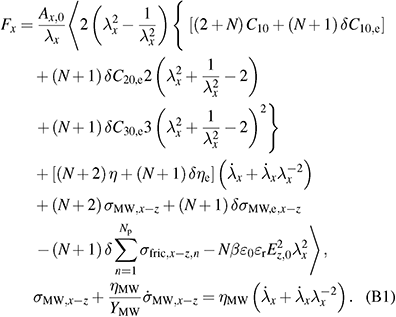
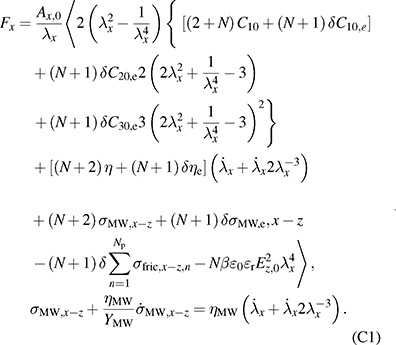
Appendix C: Transducer model with an in-plane actuation direction and an equibiaxial deformation assumption
Assumptions:
- in-plane actuation in x-direction,
- equibiaxial deformation with , and ,
- Yeoh model for elastic material model of the electrode layers,
- Neo-Hookean model for elastic material model of the elastomer layers.


Transducer model:
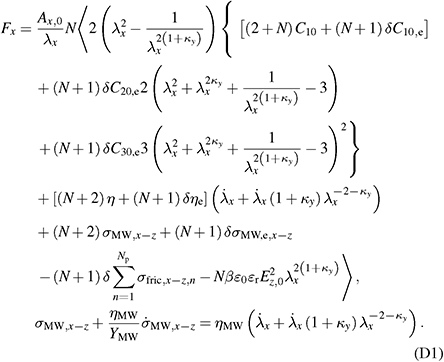
Appendix D: Transducer model with an in-plane actuation direction and a general deformation assumption
Assumptions:
- in-plane actuation in x-direction,
- general deformation assumption with , and ,
- Yeoh model for elastic material model of the electrode layers,
- Neo-Hookean model for elastic material model of the elastomer layers.


Transducer model:
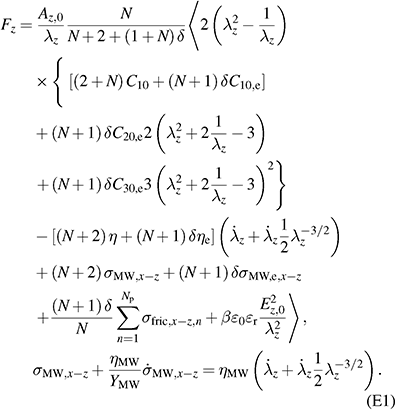
Appendix E: Transducer model with an out-of-plane actuation direction and an uniaxial deformation assumption
Assumptions:
- out-of-plane actuation in z-direction,
- uniaxial deformation with and ,
- Yeoh model for elastic material model of the electrode layers,
- Neo-Hookean model for elastic material model of the elastomer layers.


Transducer model: