Page MenuHomePhabricator

Study performance impact of disabling TCP selective acknowledgments
Closed, ResolvedPublic

Description

Yesterday we've disabled TCP SACKs [1] on the caches/bastions to mitigate a remote DoS in the TCP implementation in the Linux kernel [2].

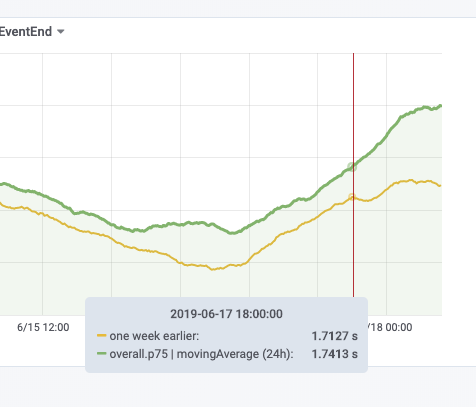
The caches were disabled between 17:30 and 18:00 UTC on Mon 17th and the remaining hosts were disabled starting 8:20 UTC on Tue 18th (with Puppet runs taking up to 30 minutes after the merge of the patch).

Once a fixed kernel is fully deployed we can consider whether to re-enable TCP SACKs. Various options:

  • If there's no visible performance impact, we can keep it disabled (reduces exploitable complexity)
  • If there's a performance regression, re-enable on the caches only
  • If there's a performance regression, re-enable fleet-wide if running a fixed Linux kernel (Puppet can apply this gradually as reboots happen)

Footnotes:
[1] https://en.wikipedia.org/wiki/Transmission_Control_Protocol#Selective_acknowledgments
[2] https://github.com/Netflix/security-bulletins/blob/master/advisories/third-party/2019-001.md

Event Timeline

loadEventEnd seems to have regressed around the time the change was deployed. In the week-over-week you can see that the curves seem to diverge past that point, increasing the week-over-week difference:

Capture d'écran 2019-06-18 11.42.03.png (407×476 px, 33 KB)

Ideally you want to re-enable this for half the fleet to verify, as daily/weekly traffic patterns add a lot of noise to the data. As long as a patched kernel is on the short horizon, I think we can wait for that before conducting such a test.

ema triaged this task as Medium priority.Jun 18 2019, 9:58 AM
ema added a project: Traffic.

As long as a patched kernel is on the short horizon, I think we can wait for that before conducting such a test.

Very short, the first cache reboots with patched kernel are planned for this EU afternoon.

loadEventEnd seems to have regressed around the time the change was deployed

I'm gonna acknowledge the alert in Icinga as we're aware of this and there's no immediate action to take.

Mentioned in SAL (#wikimedia-operations) [2019-06-19T12:20:48Z] <ema> cache nodes: resume rolling reboots for kernel and varnish upgrades T224694 T225998

Mentioned in SAL (#wikimedia-operations) [2019-06-19T16:01:26Z] <ema> cache nodes: stop rolling reboots for today, 47/80 done T224694 T225998

Mentioned in SAL (#wikimedia-operations) [2019-06-20T09:17:36Z] <ema> cache nodes: resume rolling reboots for kernel and varnish upgrades T224694 T225998 T226048

All cache nodes are now running Linux 4.9.168-1+deb9u3. Next week we can thus re-enable SACKs on part of the cache fleet and further evaluate performance implications.

loadEventEnd seems to have regressed around the time the change was deployed. In the week-over-week you can see that the curves seem to diverge past that point, increasing the week-over-week difference:

Capture d'écran 2019-06-18 11.42.03.png (407×476 px, 33 KB)

Indeed, from Navigation Timing dashboard, loadEventEnd shows a global increase of ~ 100 ms at the 75th percentile compared to last week. Starting around June 15th (2 days before this task was created), and still on-going today.

Screenshot 2019-06-23 at 14.30.51.png (650×2 px, 210 KB)

And, affects both desktop and mobile (link):

Screenshot 2019-06-23 at 14.32.04.png (650×2 px, 239 KB)
Screenshot 2019-06-23 at 14.32.11.png (646×2 px, 253 KB)

But, based on other nav timing metrics, this might not be network-related.

reponseStart
Screenshot 2019-06-23 at 14.36.41.png (648×2 px, 230 KB)

Did go up around the same date, but only by 10 milliseconds, and has since come back down, whereas the load time regression hasn't.

response
Screenshot 2019-06-23 at 14.37.42.png (654×2 px, 247 KB)

navtiming-response (responseStart to responseEnd), did not go up on the same day. Only several days later, and only by < 3 milliseconds, and has since come back down.

The domInteractive (until end of HTML download/parse, not sub resources or paint) metric and firstPaint metric show a similar pattern as the responseStart metric. They went up by a small amount (around 10 milliseconds) on the same day (June 14-15), but have since come back down.

The ones that remained up and correlate with loadEventEnd, are:

  • domComplete and loadEventStart (naturally, nearly identical to loadEventEnd).
  • mediaWikiLoadEnd (nav start to JS settle).
  • processing (responseEnd to domComplete).

This suggests it is either related to client-side rendering (amount of data or the speed at which it can be processed), or related to secondary requests (e.g. the HTML req might be fine, but CSS/JS/images are more affected by the networking issue).

Mentioned in SAL (#wikimedia-operations) [2019-06-24T10:28:23Z] <moritzm> re-enabling TCP SACKs on cp5001-cp5003 (half of Varnish/upload in eqsin) T225998

Mentioned in SAL (#wikimedia-operations) [2019-06-24T10:36:58Z] <moritzm> re-enabling TCP SACKs on cp5007-cp5009 (half of Varnish/text in eqsin) T225998

Mentioned in SAL (#wikimedia-operations) [2019-06-24T13:04:13Z] <moritzm> re-enabling TCP SACKs on cp1075-1082 (half of Varnish/text and Varnish/upload in eqiad) T225998

Mentioned in SAL (#wikimedia-operations) [2019-06-24T13:10:37Z] <moritzm> re-enabling TCP SACKs on cp2001,2002,2004-2008,2010,2011, 2014, 2017 (half of Varnish/text and Varnish/upload in codfw) T225998

Mentioned in SAL (#wikimedia-operations) [2019-06-24T13:19:03Z] <moritzm> re-enabling TCP SACKs on cp3040-cp3047, cp3049 (half of Varnish/text and Varnish/upload in esams) T225998

Mentioned in SAL (#wikimedia-operations) [2019-06-24T13:26:25Z] <moritzm> re-enabling TCP SACKs on cp4024-4029 (half of Varnish/text and Varnish/upload in ulsfo) T225998

Breakdown of servers and their config

eqsin:
Enabled: cp5001-cp5003, cp5007-cp5009
Disabled: cp5004-cp5006, cp5010-cp5012

ulsfo:
Enabled: cp4024-cp4029
Disabled: cp4021-cp4023, cp4030-cp4032

esams:
Enabled: cp3040-cp3047, cp3049
Disabled: cp3030, cp3032-cp3039

codfw:
Enabled: cp2001,cp2002,cp2004-cp2008,cp2010,cp2011,cp2014,cp2017
Disabled: cp2012,cp2013,cp2016,cp2018-cp2026

eqiad:
Enabled: cp1075-cp1082
Disabled: cp1083-cp1090

The results are in, looking at loadEventEnd since yesterday 14:00 GMT until now.

statusmedianp90p95sample size
SACK enabled128240796338.75335806
SACK disabled129142596783339182
difference0.7%4.2%6.5%

It's definitely worth re-enabling SACK everywhere, as the performance difference is significant, particularly for users with slower/less reliable internet connections.

The internal recvfrom field from EventLogging refers to the Varnish frontend that received the /beacon request (similar to the last hostname in the XCS response header). Afaik that does not correlate to the multiple requests that made up the page load as each of those requests are independently distributed by LVS afaik.

Looking at the critical non-image reqs (HTML, CSS, JS) for a page view, logged-out, I see resps from cp3042 and some from cp3030. And images from a separate cp hosts as well (text cluster vs upload cluster).

It does for text, when your IP gets hashed to a specific Varnish frontend, you get all "small" requests from it. I.e. anything below the size threshold to be stored in Varnish frontends.

Remember that x-cache headers are read from right to left. Trying this out right now with a clear cache and a clear local storage I get the following headers for all assets on the page:

Non-images

x-cache: cp1079 hit/1, cp3030 hit/1, cp3041 miss
x-cache: cp1087 hit/7, cp3041 hit/3, cp3041 hit/140
x-cache: cp1087 hit/7, cp3030 hit/6, cp3041 hit/3267
x-cache: cp1079 hit/9, cp3033 hit/2, cp3041 hit/5468
x-cache: cp1085 hit/5, cp3032 hit/3, cp3041 hit/4463
x-cache: cp1089 hit/1, cp3033 hit/3, cp3041 hit/1
x-cache: cp1083 hit/7, cp3030 hit/5, cp3041 hit/1494482 (image/icon served by MediaWiki)
x-cache: cp1081 hit/4, cp3041 hit/3, cp3041 hit/1458154 (image/icon served by MediaWiki)
x-cache: cp1075 hit/4, cp3030 hit/4, cp3041 hit/529456 (image/icon served by MediaWiki)
x-cache: cp1087 hit/1, cp3041 hit/2, cp3041 hit/675
x-cache: cp1085 hit/5, cp3040 hit/2, cp3041 hit/208723
x-cache: cp1083 hit/10, cp3042 hit/5, cp3041 hit/rOMWC29385090c63e (image/icon served by MediaWiki)
x-cache: cp1087 hit/1, cp3032 hit/1, cp3041 hit/2138
x-cache: cp1081 pass, cp3030 hit/3, cp3041 hit/47756
x-cache: cp1087 hit/9, cp3032 hit/3, cp3041 hit/29240

Images

x-cache: cp3036 hit, cp3044 hit/1308
x-cache: cp3046 hit, cp3044 hit/103289
x-cache: cp3043 hit, cp3044 hit/1
x-cache: cp3043 hit, cp3044 hit/474536

So it was cp3041 every time for me, for anything besides images.

Remember that x-cache headers are read from right to left.

More details here: https://wikitech.wikimedia.org/wiki/Varnish#X-Cache

Change 519193 had a related patch set uploaded (by Muehlenhoff; owner: Muehlenhoff):
[operations/puppet@production] Re-enable TCP selective acknowledgements on hosts running a fixed kernel

https://gerrit.wikimedia.org/r/519193

Change 519193 merged by Muehlenhoff:
[operations/puppet@production] Re-enable TCP selective acknowledgements on hosts running a fixed kernel

https://gerrit.wikimedia.org/r/519193

@Gilles: is there anything left to be done here? Other than blogging about the results that is. :-)

Nothing left to do here, I believe.

Yeah, I think we can close this one.