 Dongmei Feng
 Chenyang Yan*
- Institute of Business Administration, Liaoning Technical University, Fuxin, China
To effectively address climate change, it is necessary to quantify the carbon emissions in high energy-consuming regions, analyze driving factors, and explore effective pathways for achieving green development. Therefore, this paper takes Liaoning Province as research area, using extended Kaya identity and LMDI method to analyze the driving factors of carbon emissions from energy consumption in five major industries and the residential consumption sector from 2011 to 2020 in Liaoning Province. Furthermore, this paper uses the Tapio model to explore the decoupling relationship between carbon emissions and economic development. The results show that: 1) From 2011 to 2020, total carbon emissions from energy consumption in five major industries showed a trend of initially declining and then rising, while carbon emissions from the residential consumption sector exhibited an upward trend. 2) For carbon emissions from the industrial sector, economic output and industrial structure are the primary factors that promote and inhibit carbon emissions respectively. The inhibitory effects of energy structure and energy intensity are not significant. Population scale has a certain promoting effect on carbon emissions. For residential energy consumption carbon emissions, Household consumption expenditure, residential energy structure, and residential population scale are driving factors that promote the growth of carbon emissions, while residential energy intensity restrains the growth of carbon emissions. 3) From 2011 to 2018, carbon emissions from the industrial sector have been decoupled from economic output, and the decoupling state is dominated by weak decoupling. However, carbon emissions are once again correlated with economic development in 2019–2020. Carbon emissions from residential energy consumption have not yet decoupled from consumption expenditure, and its decoupling state is unstable and has no obvious change rule.
1 Introduction
Energy consumption is a basic condition for human economic activities. With the rapid development of the global economy, the scale of energy consumption has significantly increased, leading to an annual increase in CO2 (Zhou and Chen, 2023). This ultimately results in a further deterioration of global warming issues. As the world’s largest carbon emitter, China has experienced high growth in energy consumption over a long period. However, industrialization is still ongoing in China, which requires substantial energy consumption, especially from traditional fossil fuels, leading to increasing carbon emissions (Liu et al., 2023b). To achieve low-carbon development, the Chinese government aims to reach peak carbon emissions by 2030 and achieve carbon neutrality by 2060. With these ambitious goals, high-energy-consumption resource-based cities and old industrial bases face even more severe challenges.
Liaoning Province is an important old industrial base and a resource-based city agglomeration. During its development process, the industrial structure in Liaoning has been dominated by resource-based industries and heavy industry. This development model, characterized by high energy consumption in exchange for rapid economic development, hardly meets the low-carbon economy transformation requirements set by dual carbon goals. In recent years, Liaoning Province has faced sluggish economic growth and a lack of development sustainability. In 2023, Liaoning Province ranked 16th in China by GDP, with a below-average GDP growth rate over the past decade (excluding 2023). Compared to other industrial provinces with a high level of economic development, Liaoning faces more severe challenges in fulfilling the low-carbon economy goals while achieving other objectives such as industrial transformation and economic improvement. Without proper guidance, new carbon emission growth points could easily emerge. Therefore, it is necessary to quantify the carbon emissions in high energy-consuming regions, analyze driving factors, and explore effective pathways for achieving green development.
2 Literature review
2.1 Research on driving factors of carbon emissions
Currently, in the study of drivers of carbon emissions, researchers commonly adopt two methods: SDA and IDA. The results obtained through SDA are good, but the time span of the required data is longer, which results in limitations for practical applications (Dong et al., 2018; Wang et al., 2023). In practical applications, IDA is more feasible since the data needed for it is more easily accessible (Ye et al., 2019). In 2004, Ang (2004) proposed the LMDI decomposition method. Due to its simplicity, interpretability, wide applicability, and absence of residual decomposition, it has been extensively used in analyzing the carbon emissions driver decomposition model (Shang et al., 2016; Chen et al., 2022).
In national-level researches, Yang et al. (2020), Wang and Yan (2022) all analyzed the driving factors of carbon emissions from energy consumption in China. They found that economic activities and energy intensity are the primary driving factors promoting and inhibiting carbon emissions, respectively. It can effectively restrain the growth of carbon emissions from energy consumption by optimizing industrial structure, improving energy structure, and increasing the development of clean energy. Similar conclusions have been drawn in studies focused on developing countries (Chong et al., 2019; Alajmi, 2021). For developed countries, environmental pressures are comparatively small as economic development is not heavily dependent on energy consumption (Cai et al., 2018; Waheed et al., 2019).
With the continuous growth of the regional economy, there is an increasing amount of research being conducted at regional and provincial levels (Guo et al., 2016; Gu et al., 2019; Qing et al., 2021; Yang et al., 2021; Chen A. et al., 2023; Jiao et al., 2023). Due to the significant spatial heterogeneity in development models, the influence of various driving factors on changes in carbon emissions also varies by region (Zheng et al., 2019). Yu et al. (2021) found that energy efficiency is the primary factor causing significant differences in carbon emission intensity in the Beijing-Tianjin-Hebei region. Jiang et al. (2020) discovered that downstream areas of the Yangtze River Economic Belt have better energy structure and energy efficiency than the midstream and upstream areas, which results in better emission reduction benefits. Meanwhile, the midstream and upstream areas have greater carbon reduction potential in terms of industrial transformation and structural adjustment compared to the downstream areas. Huang and Matsumoto (2021) explored the impact of urbanization levels on carbon emissions in 30 provinces in China from the perspective of residential consumption. They found that provinces with lower levels of urbanization should focus on adjusting regional development methods, while in highly urbanized regions, promoting sustainable development is key to reducing carbon emissions.
Some scholars also focus on research at the industrial level. Li et al. (2022) analyzed the driving factors of carbon emissions from energy consumption in China’s iron and steel industry. It concluded that production capacity and energy efficiency are the main driving factors. Eliminating backward production capacity and upgrading technology are crucial for reducing carbon emissions. Zhou et al. (2023) discovered that carbon emissions in the construction industry increase with the growth of labor productivity, and green production technology is a key factor in restraining carbon emissions in the construction industry. Other industries, such as industry (Wen and Li, 2020), mining (Shao et al., 2016), logistics (Xu et al., 2022), and tourism (Xiong et al., 2022), have also been subjects of relevant studies.
2.2 Research on the decoupling relationship between carbon emissions and economic development
It is also noteworthy to analyze the decoupling of environmental pressures from economic development, as related research also involves different dimensions. Wu et al. (2018) compared the decoupling state in developed and developing countries. They found that developed countries exhibit relatively stable strong decoupling while developing countries show highly fluctuating and irregular weak decoupling. In studies focusing on various provinces in China, researchers found that the decoupling state has gradually improved, shifting from early expansive negative decoupling and expansive decoupling to weak decoupling and strong decoupling. It is noted that most provinces are currently in a weak decoupling state, while some developed provinces, such as Zhejiang, Hebei, Beijing, Jiangsu, and Shanghai, are in a strong decoupling state (Gao et al., 2021; Li et al., 2022; Pan et al., 2022). Meanwhile, some scholars also focus on research at the industrial level, including industry (Song et al., 2021), manufacturing (Lin and Teng, 2022; Liu et al., 2022), construction (Yang and Chen, 2022; Zhang et al., 2022), mining (Chen and Yan, 2022; Li et al., 2022), and transportation (Chen Q. et al., 2023).
In summary, research on the drivers of carbon emissions from energy consumption and the decoupling relationship with economic development is quite mature, but there are still some issues that warrant further investigation. The contribution of this paper to the existing research is mainly in the following two aspects. First, most literature focuses on the industrial sector, with less attention paid to the residential consumption sector. As living standards rise, the residential consumption sector has become the second largest energy-consuming sector after industry (Yu et al., 2023). In China, the direct and indirect CO₂ produced by the residential sector accounts for 40%–50% of total emissions. Globally, it accounts for about two-thirds of the total greenhouse gas emissions related to household energy activities (Xu et al., 2024). The increase in carbon emissions caused by the increase in residential energy consumption has become one of the important factors causing the growth of total carbon emissions in China and even the world, which cannot be ignored (Gao et al., 2023; Dong and Zhang, 2024). Therefore, this paper analyzes the impact of factors such as residential consumption expenditure and residential energy consumption intensity on carbon emissions from urban and rural residential energy consumption, respectively. And this paper explores the decoupling relationship between carbon emissions from residential energy consumption and consumption expenditure. Second, Currently, there are few studies specifically focusing on Liaoning Province, which is characterized by high energy consumption and faces certain development issues. This paper takes Liaoning Province, further enriches the existing research, and can provide some policy references for Liaoning Province and similar areas.
3 Methodology and data sources
3.1 Carbon emission calculation method
This paper calculates carbon emissions by referring to the total carbon emissions measurement method of provincial-level energy consumption activities proposed by IPCC. The calculation formula is shown in Eq. 1:
We define
3.2 Decomposition model
To comprehensively analyze the driving factors of carbon emissions from energy consumption in various industrial sectors and residential life, this paper extends the Kaya identity to the following formula:
In Equation 2,
Based on the additive decomposition method of the LMDI method, the change in carbon emissions in Liaoning Province over the time interval [0, t] can be decomposed into:
The definition of
Where
When calculating the carbon emissions from energy consumption in Liaoning province,
3.3 Decoupling model
This paper utilizes the Tapio decoupling model to study the decoupling relationship between carbon emissions from industrial energy consumption and economic development. The Tapio decoupling models are shown in Eqs 8, 9:
Where
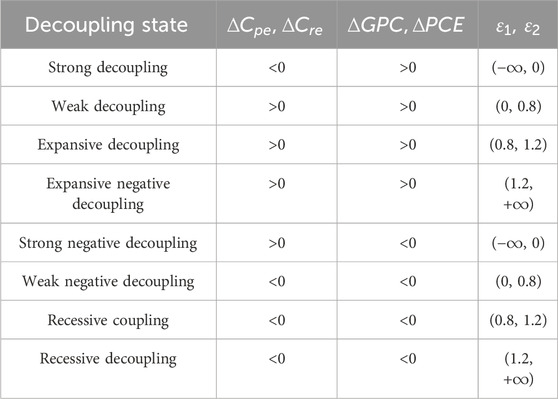
Table 1. The classification criteria for decoupling states.
3.4 Data sources
The energy consumption data, conversion coefficient of standard coal, and average lower calorific value come from the China Energy Statistical Yearbook (2011–2021). The necessary parameters for calculating carbon emission coefficients, including the carbon oxidation rate and the carbon content per unit calorific value come from the China Energy Statistical Yearbook and the Guidelines for Provincial Greenhouse Gas Inventory Compilation (Trial). The carbon emission factor for electricity is sourced from the average emission factor of the national power grid in 2022. The economic data and related social data are sourced from the Liaoning Statistical Yearbook.
4 Results
4.1 Analysis of carbon emission from energy consumption in Liaoning province
According to Figure 1A, from 2011 to 2020, the pattern of carbon emissions from five major industries in Liaoning Province can be segmented into two phases. In the first phase (2011–2016), carbon emissions decreased from 292.17 Mt to 272.35 Mt. In the second phase (2016–2020), carbon emissions increased annually, with a total increase of 41.35 Mt. From the perspective of carbon emissions in different industrial sectors, it can be observed that energy consumption carbon emissions in Liaoning Province mainly come from industry, accounting for approximately 72.5%. Carbon emissions from transportation are also relatively high, which accounts for about 18.3%. And carbon emissions of agriculture, construction, and service industry, as percentages of the total emissions are 2.6%, 0.6%, and 6%, respectively. Specifically, with the rapid growth of the service sector, including financial and technology industries, such as financial industry and technology industry, the consumption of high-carbon-emission energy has significantly increased, leading to a corresponding rise in carbon emissions.
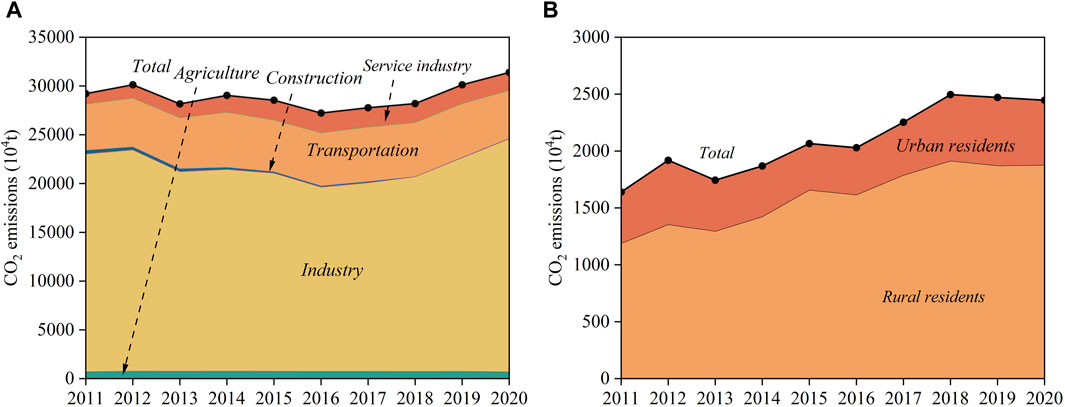
Figure 1. (A) Carbon emissions from different industries. (B) Carbon emissions from the residential consumption sector.
According to Figure 1B, carbon emissions from residential energy consumption show an overall increasing trend from 2011 to 2020, rising from 16.4 Mt to 24.46 Mt, with an average annual growth rate of 4.08%. During the period from 2011 to 2015, carbon emissions showed a stable upward trend, except for a slight decline in 2013. During the period from 2016 to 2020, carbon emissions initially increased rapidly, slowed down after 2018, and then stabilized. The changing trend of urban residents’ carbon emissions is consistent with the trend of changes in residential carbon emissions. Moreover, resident carbon emissions are mainly generated by urban residents, which can be attributed to the long-term high level of urbanization in Liaoning Province. In 2011, the urbanization rate of Liaoning Province had already reached 64%. The urbanization rate increased to 72% in 2020, surpassing the national average level of urbanization. The higher number of urban residents contributes to higher carbon emissions from urban areas. Carbon emissions from rural residents’ daily energy consumption increased from 4.5 Mt to 5.72 Mt from 2011 to 2020. According to the changing trend, carbon emissions from rural residential energy consumption can be divided into three stages. From 2011 to 2015 (except 2012), carbon emissions experienced a gradual decline in the other years, averaging an annual reduction rate of 1.92%. With an observation of a rapid increase in emissions from 2016 to 2018, the period from 2018 to 2019 then experienced a slight decline following a phase of steady growth.
4.2 Decomposition results of carbon emissions from energy consumption in Liaoning province
4.2.1 Analysis of driving factors for carbon emissions from energy consumption in five major industries
According to Equation 4, Carbon emissions from energy consumption in five major industries are decomposed into six effects (Table 2).
(1) Energy structure effect
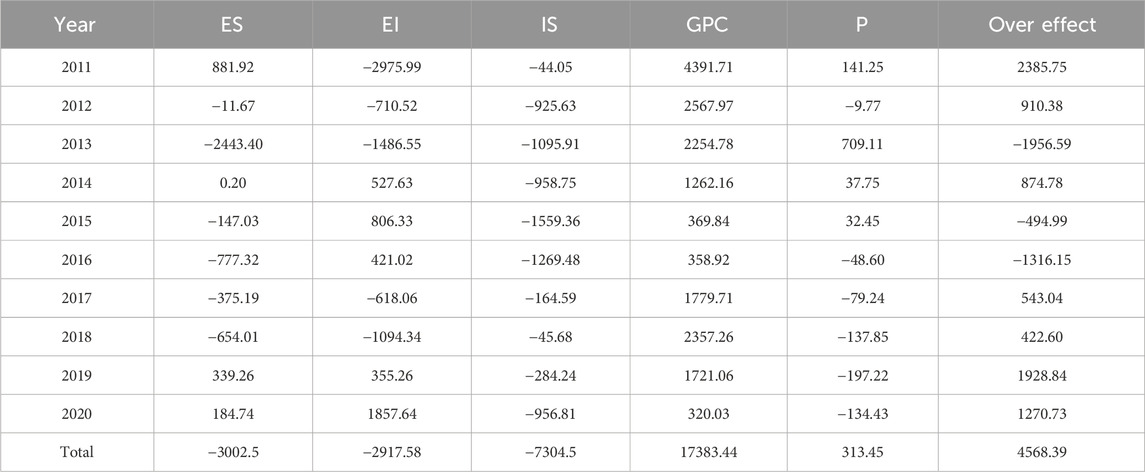
Table 2. Decomposition results of carbon emissions in the industry departments (unit: ten thousand tons).
According to Table 2, energy structure effect played a suppressing role in carbon emissions, with a cumulative reduction of 30.025 Mt from 2011 to 2020. According to Figure 2, the energy consumption of the industry departments has long been dominated by coal. This is primarily determined by two aspects: firstly, owing to the abundant natural resources of Liaoning Province, it possesses ample coal reserves. Secondly, the economic development of Liaoning Province has long relied on the secondary industry, especially the heavy industry, leading to a high dependence on coal consumption. From 2011 to 2020, the proportion of coal consumption decreased from 43.31% to 34%, and petroleum products consumption decreased from 28.16% to 23.01%. In contrast, share of relatively cleaner energy sources such as natural gas, electricity, and heat continued to rise, increasing from 3.39%, 14.28%, and 5.6%–4.31%, 15.83%, and 10%, respectively. It indicates that the energy consumption structure of the industry departments is moving towards a more low-carbon and clean direction. Nevertheless, the current energy structure of different sectors in Liaoning is still primarily dominated by coal, and economic development is also more dependent on energy consumption. In addition, in terms of energy use, the conditions for large-scale substitution of coal with high-quality and high-priced energy sources are not yet available. The optimization and upgrading of energy structure will not change significantly in the short term. The demand for coal in heavy chemical industries still exists, suggesting that it is unlikely to achieve substantial emission reductions by optimizing energy structure in the short term. However, it also means that energy structure adjustment has excellent potential to reduce emissions in the future. In the energy structure effect of different sectors (Figure 3), energy structure effect of industry plays a dominant role in carbon emissions. This result can be attributed to the fact that industry is the largest energy-consuming sector, with its energy consumption predominantly reliant on raw coal, coke, and various types of petroleum products. Agriculture, construction, transportation, and service industry all impose a certain inhibitory effect on carbon emissions.
(2) Energy intensity effect
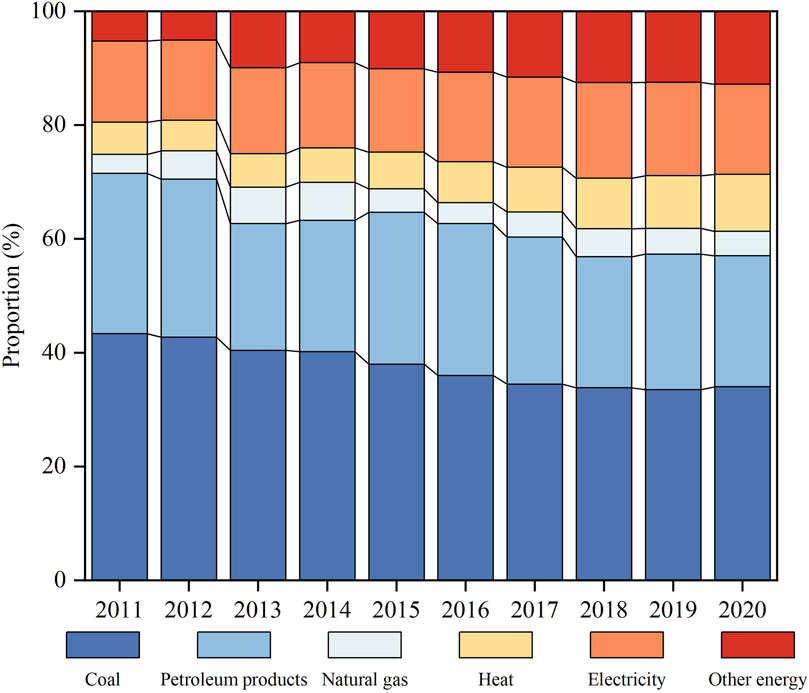
Figure 2. The energy consumption structure of the industry departments from 2011 to 2020.
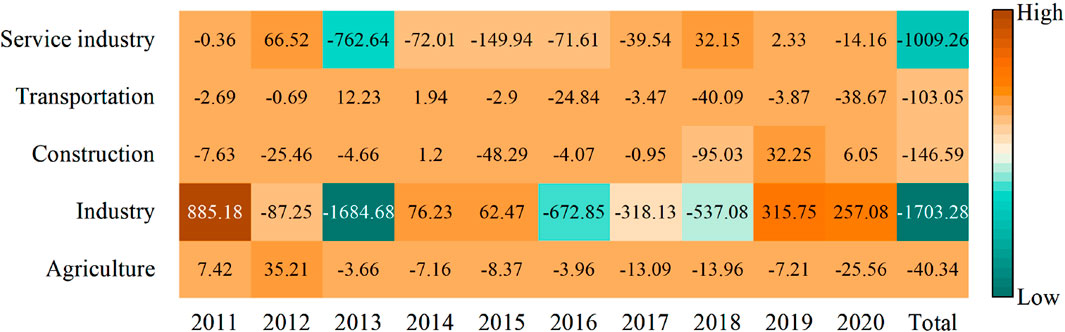
Figure 3. Energy structure effect of different sectors from 2011 to 2020 (unit: ten thousand tons).
Although energy intensity effect has an inhibitory effect on carbon emissions, the effect is weak and characterized by significant overall fluctuations. Analyzing in stages, the contribution values of energy consumption effects in Liaoning Province during the period of “12th Five-Year Plan” (2011–2015) and “13th Five-Year Plan" (2016–2020) are −38.391 Mt and 9.2152 Mt, respectively. It indicates that Liaoning Province achieved good results in improving energy utilization efficiency from 2011 to 2015. However, from 2015 to 2020 various industries showed a rebound in production capacity, which caused weak improvement in energy intensity. In the years 2018–2020, the growth rate of energy consumption exceeded the growth rate of GDP, and energy intensity effect played a promoting role in carbon emissions. Generally, the improvement effect of energy intensity is limited. In the early stages, improvements in energy intensity typically benefit from technological advancements and adjustments in industrial structure. However, with the gradual maturity of technology and the limitations of certain industries, subsequent improvements in energy intensity may become more difficult. Therefore, the positive impact of energy intensity effects on carbon emission reduction is limited. From the perspective of energy intensity effect of different industrial sectors (Figure 4), except for industry, the total contribution values of energy intensity effects for other sectors are all negative. For high-energy consuming industries, the operational management is extremely complex. It requires attention to production capacity while also considering the impact on the external environment. To some extent, it may cause problems such as inadequate organizational management capabilities and outdated production technologies, eventually resulting in low energy utilization efficiency (Wang et al., 2018). From 2005 to 2013, service industry has been restraining the growth of carbon emissions, with the largest cumulative emission reduction of 27.5772 Mt. Energy consumption intensity effects of agriculture, construction, and transportation also inhibit carbon emissions but to a relatively lesser extent.
(3) Industrial structure effect
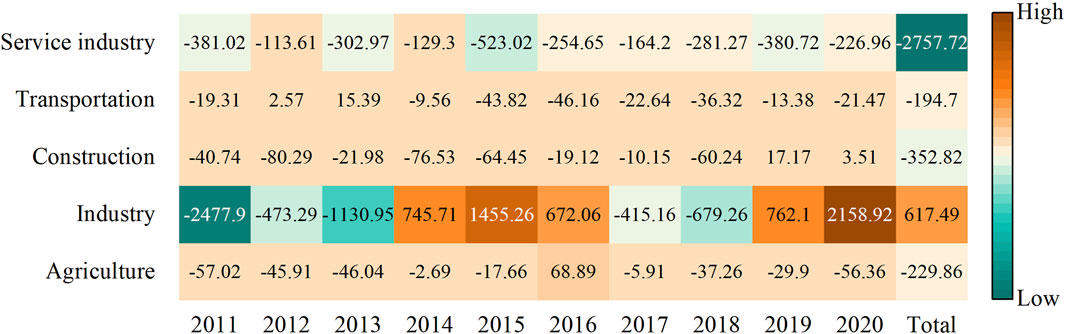
Figure 4. Energy intensity effect of different sectors from 2011 to 2020 (unit: ten thousand tons).
Industrial structure effect consistently has been playing a restraining role in carbon emissions from 2011 to 2020, cumulatively reducing emissions by 73.045 Mt, which is the most significant inhibiting factor. Combining the analysis of the proportion of different industries (Figure 5), since 2011, the share of the service industry in Liaoning Province has increased annually, rising from 36.9% to 52.8% in 2020, and becoming the economic pillar of Liaoning Province for the first time in 2014. Meanwhile, the proportion of the industrial sector decreased from 45.9% in 2011 to 31.6% in 2020. The transformation of the second industry to the third industry made the industrial structure effect on CO2 emissions significantly inhibitory. However, it is noteworthy that the current traditional economic pillar industries in Liaoning Province are still dominated by high-energy-consuming industries such as petrochemicals and metallurgy. The proportion of their gross product to the total industrial product is close to half. Due to the large size of the energy system and its overall low efficiency, the elimination of outdated production capacity and the optimization of the industrial structure are necessary. From the perspective of industrial structure effects in different sectors (Figure 6), the industrial sector has the largest inhibitory effect on carbon emissions, cumulatively reducing emissions by 76.95 Mt. Agriculture also plays a restraining role, while the construction, transportation, and service industry all contribute to an increase in carbon emissions.
(4) Economic output effect
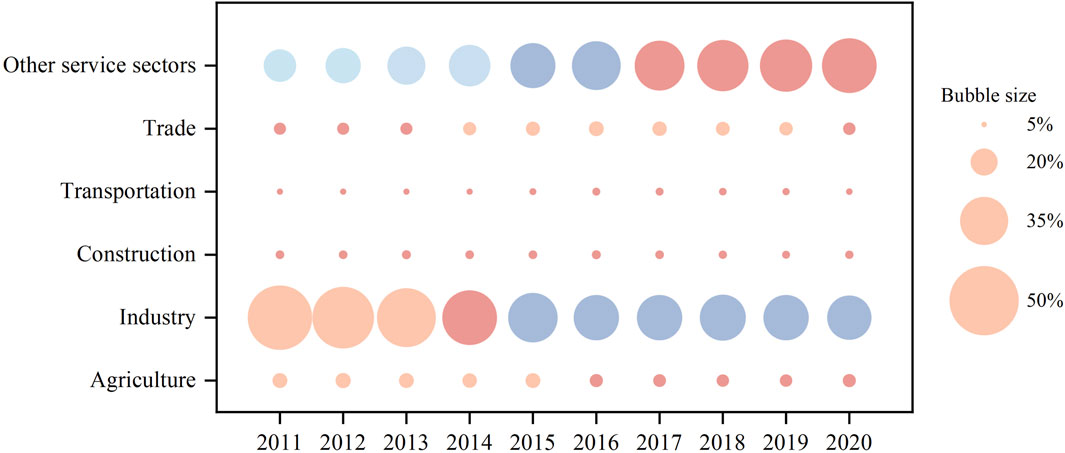
Figure 5. Industrial structure of Liaoning province from 2011 to 2020.
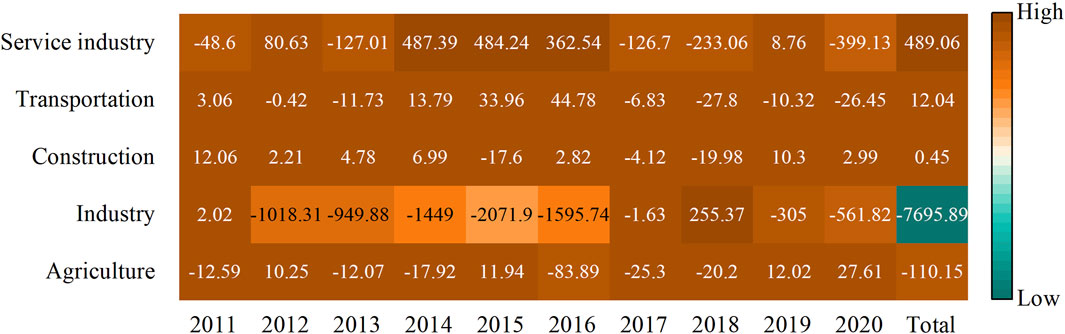
Figure 6. Industrial structure effect of different sectors from 2011 to 2020 (unit: ten thousand tons).
Economic output is the most significant factor leading to the increase in carbon emissions, cumulatively adding 1738.345 Mt. According to the Environmental Kuznets Curve, areas with low economic development levels tend to have lower levels of environmental pollution. However, as economic development progresses, the degree of environmental pollution will be more serious. When the economy reaches a certain level, it will hit an “inflection point”, after which, the environmental pollution level will stay to decrease as the economy continues to grow. Compared to other developed regions, the current economic development level of Liaoning Province is still relatively lagging, and it has not yet reached the " inflection point” in economic development. Consequently, the increase in carbon emissions is an inevitable outcome of Liaoning Province’s economic development. Furthermore, economic development in Liaoning will continue to promote carbon emissions for some time in the future. However, as Liaoning transitions from a focus on rapid economic growth to a focus on high-quality development, the increase in carbon emissions resulting from economic development is expected to be offset by the effects of other factors reducing carbon emissions.
(5) Population scale effect
As indicated by Table 2, from 2011 to 2015 (except for 2012), population scale effect increased carbon emissions by 9.108 million tons. However, from 2016 to 2020, it shifted to reduce carbon emissions, decreasing them by 5.9734 Mt. Throughout the study period, the population of Liaoning Province has consistently decreased, declining from 43.5785 Mt in 2011 to 42.6606 Mt in 2020. In general, the decrease in population size tends to hinder the increase of CO2 emissions, while Liaoning’s carbon emissions increased rather than decreased in the case of continuous population decline. This result could be explained to internal population movements within Liaoning Province, namely, changes in urban and rural population structures. In the early stages, with the continuous increase in urban population, the expansion of urban scale and infrastructure construction accelerated expansion. Alongside, the rapid urbanization process, industries, construction, and the tertiary sector also developed rapidly, leading to an expansion of energy demand and therefore higher carbon emissions. However, as urbanization progresses a certain level, the influence of population-sized on carbon emissions will exceed the impact of urbanization. In summary, the influence of population size on carbon emissions demonstrates a trend of initially promoting and subsequently inhibiting increases in carbon emissions.
4.2.2 Analysis of driving factors for carbon emissions from residential energy consumption
According to Equation 5, carbon emissions from energy consumption in the residential consumption sector are decomposed into four effects (Table 3).
(1) Residential energy structure Effect
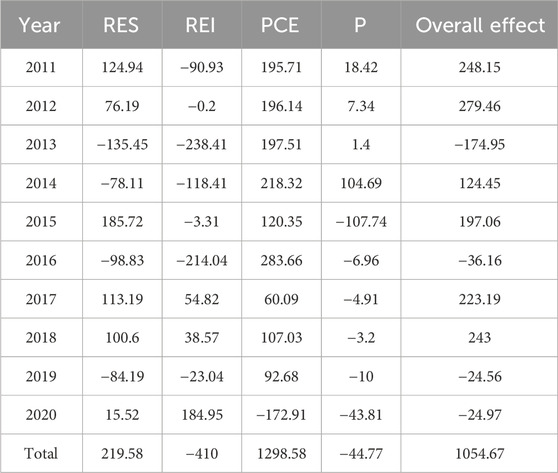
Table 3. Decomposition results of carbon emissions from residential energy consumption (unit: ten thousand tons).
As illustrated in Table 3, from 2011 to 2020, the energy structure effect of residents promoted carbon emissions, cumulatively increasing emissions by 2.1959 Mt cumulatively. The urban residents’ energy structure effect promoted an increase in carbon emissions, accumulating an increase of 2.98 Mt, while the energy structure effect of urban residents inhibited the increase of carbon emissions, accumulating a reduction of 0.7841 million tons. For urban residents (Figure 7A), the share of coal consumption has been consistently decreasing, dropping from 10.85% in 2011 to 2.8% in 2020. Meanwhile, the demand for relatively clean energy sources, like electricity, has increased, but the overall consumption percentage is still quite low. The consumption percentages for natural gas and electricity are 6.06% and 14.5%, respectively. At present, heat and petroleum products continue to be the primary components of urban residents’ energy consumption. However, it is well known that the generation of heat mainly comes from the burning of traditional fossil energy, which significantly increases the indirect carbon emissions of heat consumption. For rural residents (Figure 7B), coal and petroleum products are the main components of energy consumption. The share of coal consumption shows a trend of rising first and then falling, reaching a peak of around 41.28% in 2015 and decreasing to 33.41% by 2020. In contrast, the proportion of petroleum products initially decreases and then increases, reaching a minimum of around 20.22% in 2016 and rising to 26.67% by 2020. The consumption proportions electricity, heat are extremely small. Overall, the energy consumption structure effect of rural residents inhibits carbon emissions, but the effect is relatively small, and this inhibitory effect is mainly due to the “mutual growth and decline” of coal and various oil consumption.
(2) Residential energy intensity effect
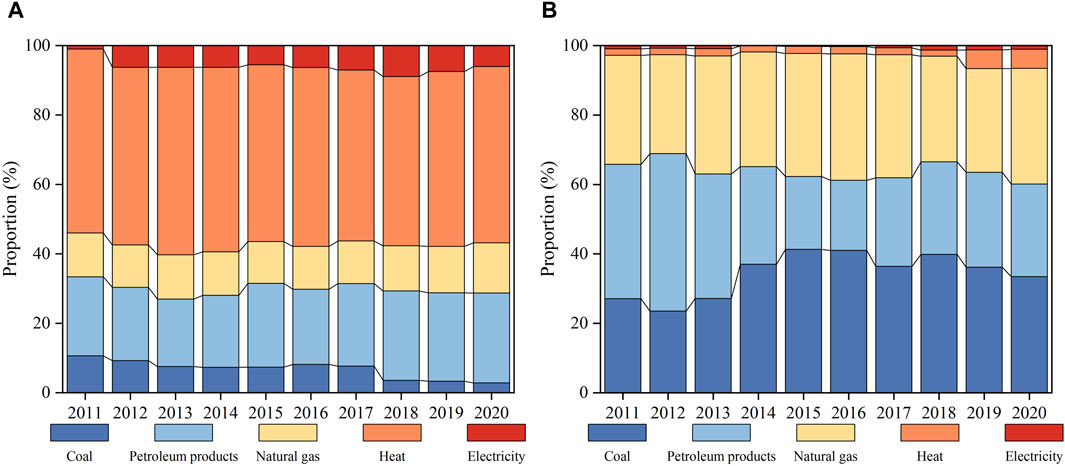
Figure 7. (A) Energy consumption structure of urban residents. (B) Energy consumption structure of rural residents.
Residential energy intensity effect represents the amount of energy consumed for one unit increase in residential consumption expenditure. It can be seen from Table 3 that residential energy intensity effect on carbon emissions played a restraining role from 2011 to 2020, with a cumulative reduction of 4.1 Mt. Urban residents’ energy intensity effect cumulatively reduced emissions by 3.67 Mt, while rural residents’ energy intensity effect cumulatively reduced emissions by 0.43 million tons. This indicates that urban and rural residents in Liaoning Province have more efficiently used energy by changing their lifestyles and consumption habits during the study period. Meanwhile, the reciprocal of residential energy intensity effect can be also understood as the price of consuming energy in daily life. Since 2012, Liaoning Province has implemented tiered pricing for certain residential energy sources, such as tiered electricity pricing. The aim is to enhance the impact of energy prices on energy consumption, establish a “pay more for more usage” tiered pricing mechanism, and decrease carbon emissions.
(3) Household consumption level effect
Household consumption level is the primary driving factor promoting the rise in carbon emissions. From 2011 to 2019, the contribution values of the household consumption level effect on carbon emissions were all positive, but in 2020, the contribution turned negative. During the study period, total emissions increased by 12.9858 million tons, with urban residents contributing 8.306 million tons, and rural resident contributing 4.6798 million tons. The improvement in consumption level will elevate living standards, which will further increase residents’ demand for energy equipment and contribute to a rise to carbon emissions. For instance, a higher proportion of the consumption of high-power household appliances can significantly contribute to a rise to residential electricity consumption. Additionally, the increased proportion of consumption in transportation products consumed can also lead to a higher consumption of oil fuels. With the improvement of the economic level in Liaoning Province, per capita consumption expenditure in urban and rural areas continues to grow. The ability of residents to purchase products such as private cars and high-powered household appliances has increased, which in turn generates more energy consumption and CO2 emissions. Therefore, it is essential to consider energy conservation and environmental protection while material life becomes increasingly abundant.
(4) Residents’ population scale effect
Residents’ population scale effect has an inhibitory role in carbon emissions from residential energy consumption, leading to a cumulative reduction of 0.4477 Mt. Urban residents’ population scale effect has been rose 1.26 Mt, while rural residents’ population scale effect has been decreased 1.7077 Mt. In the context of a continuous decline in population and an increasing urbanization rate in Liaoning Province, the rural population is decreasing year by year, leading to a corresponding decrease in energy consumption required for rural residents’ living, thereby resulting in a reduction in carbon emissions. As for the urban population, For the urban population, it increased annually from 2011 to 2015. However, from 2016 to 2020, the urban population declined every year except for 2020. The influence of the urban population on carbon emissions gradually shifts from a promoting effect to an inhibiting effect, which is almost consistent with the trend observed in the impact of population scale on carbon emissions from energy consumption in the industry departments, further proving that the increase in carbon emissions from energy consumption in the industry departments caused by the decrease in population may be due to urbanization.
4.3 Analysis of the decoupling effect
This paper measured the decoupling index between carbon emissions from energy consumption in five major industries and economic growth, as well as the decoupling index between carbon emissions from residential energy consumption and consumption expenditure in Liaoning province from 2011 to 2020. The results are shown in Table 4 and Table 5.
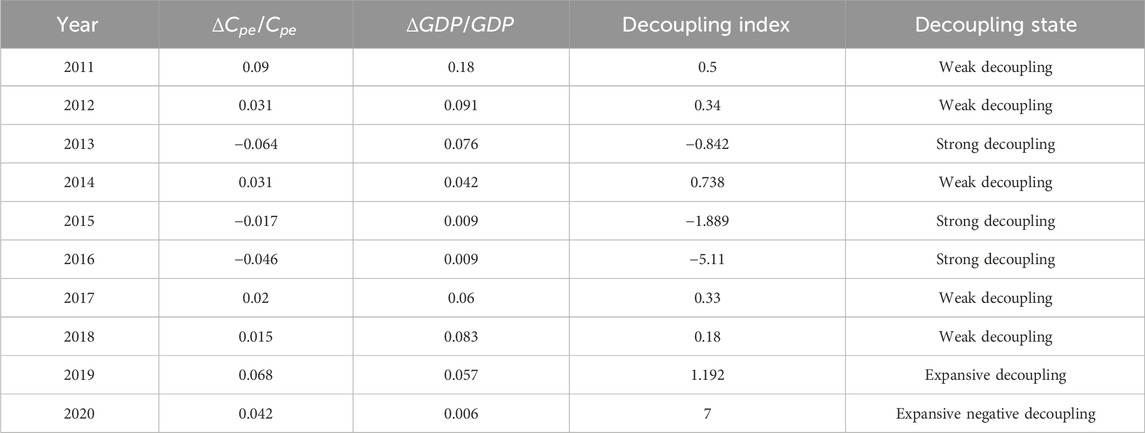
Table 4. Decoupling index of carbon emissions by sector.
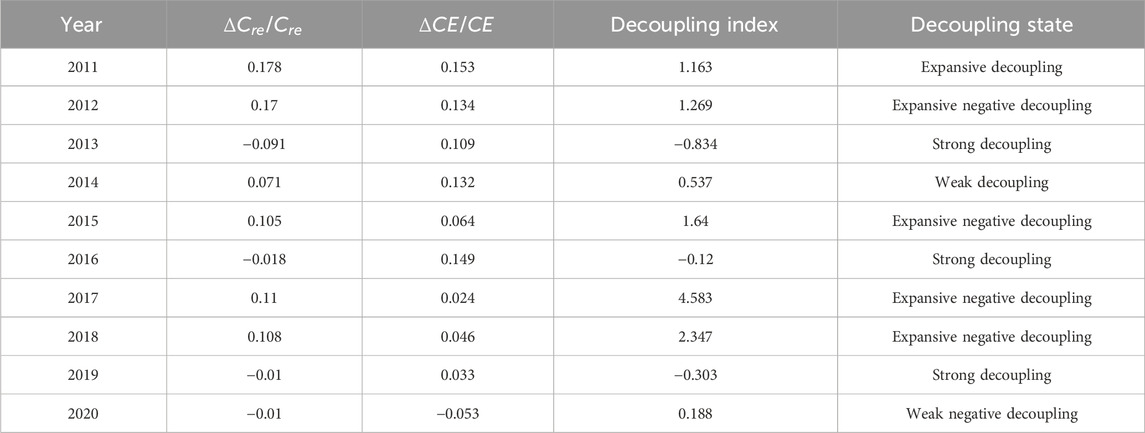
Table 5. Decoupling index of carbon emissions from the residential consumption sector.
4.3.1 Analysis of the decoupling index for carbon emissions by sector
According to Table 4, the decoupling status between carbon emissions from energy consumption in five major industries and its economic growth can be categorized into four types. From 2011 to 2015, carbon emissions achieved decoupling from economic development, with the decoupling status characterized by weak decoupling and strong decoupling. During this period, Liaoning province implemented a series of energy-saving and emission reduction policies, such as optimizing the energy consumption structure, and developing low-energy and low-emission industries. These measures gradually strengthened the decoupling effect, and achieved a shift from weak decoupling to strong decoupling. During the period of 2016–2020, the decoupling effect transitioned into expansive decoupling and expansive negative decoupling, indicating a gradual deterioration in the decoupling status. The continuous expansion of the industrial scale results in a sustained increase in energy consumption, and environmental pressure also increases accordingly. In 2019–2020, the carbon emissions growth rate surpassed the GDP growth rate, indicating that economic development came at the cost of increased carbon emissions. The renewed correlation between carbon emissions and economic development indicates that the decoupling achievements attained in the past are facing new challenges. This may stem from insufficient and stagnant technological innovation or the higher carbon emissions levels of emerging industries. Therefore, to promote the economy of Liaoning Province towards low-carbon development, it is imperative to further implement environmental protection policies, promote clean utilization of traditional energy sources.
4.3.2 Analysis of decoupling index for carbon emissions from the residential consumption sector
As shown in Table 5, the decoupling effects between carbon emissions from residential energy consumption and consumption expenditure can be classified into five types. Overall, decoupling analysis indicates that, except for 2020, the decoupling state was manifested as expansive decoupling or expansive negative decoupling in most years. It indicates that the decoupling between carbon emissions from residential energy consumption and consumption expenditure has not yet been realized. For urban and rural residents, when the consumption level is relatively low, the decoupling state is generally good. But as the consumption level increases, the decoupling state deteriorates. It may be attributed to the combined influence of multiple factors. Firstly, with the development of economy, the living standard of residents has also been improved. In this case, people may prefer a more comfortable lifestyle, which involves more high-carbon goods and services, such as high-energy transportation and high-energy electrical appliances. Secondly, the increase in consumption levels usually leads to changes in production and consumption patterns. For example, market demand for goods and services may significantly increase, resulting in more frequent product updates and shorter product life cycles. In this scenario, more energy will be invested in production, which results in a substantial increase in the indirect carbon emissions of various consumer products during the production and consumption processes. Therefore, to achieve the decoupling of carbon emissions and residential consumption expenditure, it is necessary to adopt a comprehensive strategy, including strengthening innovation in environmental protection technology, promoting the implementation of environmental policies, and enhancing societal awareness of environmental protection.
5 Conclusions and recommendations
5.1 Conclusions
The decomposition effect indicates that economic output is the key factor promoting carbon emission. Energy structure, energy intensity, and industrial structure inhibit the growth of carbon emissions, while population scale promotes carbon emissions. For residential energy consumption carbon emissions, household consumption expenditure is the primary factor causing the increase in carbon emissions. Residential energy structure effect and residential population scale effect have a promoting effect on carbon emissions from urban residents while having a restraining effect on carbon emissions from rural residents. Residential energy intensity effect has an inhibitory effect on carbon emissions for both urban and rural residents. For decoupling results, the decoupling relationship between carbon emissions in five major industries and economic growth shows a weak decoupling in most years. However, since 2019, the decoupling state has gradually deteriorated, transforming into expansive decoupling and expansive negative decoupling, with carbon emissions once again being associated with economic growth. Carbon emissions from residential energy consumption are not yet decoupled from consumption expenditure, and the decoupling status shows no apparent pattern of change.
From the perspective of research results, most conclusions are consistent with previous studies (Ma et al., 2019; Zhang et al., 2019). Meanwhile, we also find some conclusions that differ from previous studies. First, industrial structure effect is the foremost driving force for reducing CO2 emission, while the inhibitory effects of energy structure and energy intensity are not significant. At present, the contradiction between the industrial economy-dominated economic structure and industrial structure is pronounced, and the demand for coal and other fossil fuels exists objectively in various industries. Therefore, it is difficult to achieve substantial emission reductions by optimizing the energy structure in the short term. Energy intensity is largely influenced by technological levels and public policies, thus its inhibiting effect is limited. Second, the reduction in population scale does not necessarily inhibit the increase in carbon emissions, and the impact of population scale effect on carbon emissions is influenced by the level of urbanization. Due to the internal flow of urban and rural population and the rapid development of urbanization process, population scale effect first promoted the growth of carbon emissions and then turned into a restraining effect.
5.2 Recommendations
Based on the research findings, we propose the following recommendations.
1) The carbon emissions from energy consumption in Liaoning Province mainly come from industry, followed by the residential consumption sector and transportation. For the current situation, the Liaoning government should promote the low-carbon transformation of key industries. For example, accelerating the low-carbon process innovation and digital transformation in industrial areas and developing energy-efficient and low-carbon transportation vehicles in transportation industry. 2) The adjustment of energy structure and the improvement of energy intensity are the focus of future energy-saving and emission reduction policies in Liaoning Province. Therefore, the government should focus on advancing renewable energy and strengthen the research and development of clean energy substitution technologies. 3) Encouraging residents to engage in green consumption, save energy, and purchase environmentally friendly products. Meanwhile, the Liaoning government should actively develop ecological agriculture and circular economy in rural areas.
5.3 Limitations and further perspectives
The present study is subject to several limitations that require further research in the future. First, this paper focuses only on Liaoning Province and does not consider the spatial heterogeneity of different regional development models and economic levels within the province. Future research should analyze the influencing factors of carbon emissions at the city scale and discuss potential clustering or other effects of carbon emissions among different cities. Second, this paper only analyzes the direct carbon emissions of residential energy consumption. Future research should analyze indirect emissions and their influencing factors.
Data availability statement
The original contributions presented in the study are included in the article/Supplementary Material, further inquiries can be directed to the corresponding author.
Author contributions
DF: Conceptualization, Writing–review and editing. CY: Methodology, Writing–original draft.
Funding
The author(s) declare that financial support was received for the research, authorship, and/or publication of this article. This research was supported by the key project of the Ministry of Science and Technology of China (2017YFC1503102).
Conflict of interest
The authors declare that the research was conducted in the absence of any commercial or financial relationships that could be construed as a potential conflict of interest.
Publisher’s note
All claims expressed in this article are solely those of the authors and do not necessarily represent those of their affiliated organizations, or those of the publisher, the editors and the reviewers. Any product that may be evaluated in this article, or claim that may be made by its manufacturer, is not guaranteed or endorsed by the publisher.
References
Alajmi, R. G. (2021). Factors that impact greenhouse gas emissions in Saudi Arabia: decomposition analysis using LMDI. Energy Policy 156, 112454. doi:10.1016/j.enpol.2021.112454
Ang, B. W. (2004). Decomposition analysis for policymaking in energy:. Energy Policy 32, 1131–1139. doi:10.1016/s0301-4215(03)00076-4
Cai, Y., Sam, C. Y., and Chang, T. (2018). Nexus between clean energy consumption, economic growth and CO2 emissions. J. Clean. Prod. 182, 1001–1011. doi:10.1016/j.jclepro.2018.02.035
Chen, A., Han, X., and Jiang, G. (2023a). Decomposition and scenario analysis of factors influencing carbon emissions: a case study of Jiangsu province, China. Sustainability 15 (8), 6718. doi:10.3390/su15086718
Chen, H., Qi, S., and Tan, X. (2022). Decomposition and prediction of China’s carbon emission intensity towards carbon neutrality: from perspectives of national, regional and sectoral level. Sci. Total Environ. 825, 153839. doi:10.1016/j.scitotenv.2022.153839
Chen, Q., Wang, Q., Zhou, D., and Wang, H. (2023b). Drivers and evolution of low-carbon development in China’s transportation industry: an integrated analytical approach. Energy 262, 125614. doi:10.1016/j.energy.2022.125614
Chen, W., and Yan, S. (2022). The decoupling relationship between CO2 emissions and economic growth in the Chinese mining industry under the context of carbon neutrality. J. Clean. Prod. 379 (1), 134692. doi:10.1016/j.jclepro.2022.134692
Chong, C., Tan, W., Ting, Z., Liu, P., Ma, L., Li, Z., et al. (2019). The driving factors of energy-related CO2 emission growth in Malaysia: the LMDI decomposition method based on energy allocation analysis. Renew. Sustain. Energy Rev. 115, 109356. doi:10.1016/j.rser.2019.109356
Dong, F., Yu, B., Hadachin, T., Dai, Y., Wang, Y., Zhang, S., et al. (2018). Drivers of carbon emission intensity change in China. Resour. Conserv. Recycl. 129, 187–201. doi:10.1016/j.resconrec.2017.10.035
Dong, Z., and Zhang, C. (2024). Measurement, regional differences and influencing factors of urban residential carbon emissions in China. Ecol. Econ. 40 (01), 13–21.
Gao, C., Ge, H., Lu, Y., Wang, W., and Hang, Y. (2021). Decoupling of provincial energy-related CO2 emissions from economic growth in China and its convergence from 1995 to 2017. J. Clean. Prod. 297, 126627. doi:10.1016/j.jclepro.2021.126627
Gao, Y., Wang, A., Bei, L., Yang, W., and Lu, T. (2023). Analysis of influencing factors of direct carbon emission of Chinese residents. Energy Res. Manag. 15 (4), 40–45+51. doi:10.16056/j.2096-7705.2023.04.007
Gu, S., Fu, B., Thriveni, T., Fujita, T., and Ahn, J. W. (2019). Coupled LMDI and system dynamics model for estimating urban CO2 emission mitigation potential in Shanghai, China. J. Clean. Prod. 240, 118034. doi:10.1016/j.jclepro.2019.118034
Guo, B., Geng, Y., Dong, H., and Liu, Y. (2016). Energy-related greenhouse gas emission features in China’s energy supply region: the case of Xinjiang. Renew. Sustain Energy Rev. 54, 15–24. doi:10.1016/j.rser.2015.09.092
Huang, Y., and Matsumoto, K. (2021). Drivers of the change in carbon dioxide emissions under the progress of urbanization in 30 provinces in China: a decomposition analysis. J. Clean. Prod. 322, 129000. doi:10.1016/j.jclepro.2021.129000
Jiang, H., Geng, Y., Tian, X., Zhang, X., Chen, W., and Gao, Z. (2020). Uncovering CO2 emission drivers under regional industrial transfer in China’s Yangtze River Economic Belt: a multi-layer LMDI decomposition analysis. Front. Energy 15 (2), 292–307. doi:10.1007/s11708-020-0706-z
Jiao, L., Yang, R., Chen, B., and Zhang, Y. (2023). Variation, Determinants and prediction of carbon emissions in Guizhou, a new economic growth pole in southwest China. J. Clean. Prod. 417, 138049. doi:10.1016/j.jclepro.2023.138049
Li, J., Huang, G., Li, Y., Liu, Y., and Zheng, B. (2022). Decoupling degrees of China’s economic growth from three-perspective carbon emissions. J. Clean. Prod. 368, 133209. doi:10.1016/j.jclepro.2022.133209
Li, W., Zhang, S., and Lu, C. (2022). Research on the driving factors and carbon emission reduction pathways of China’s iron and steel industry under the vision of carbon neutrality. J. Clean. Prod. 361, 132237. doi:10.1016/J.JCLEPRO.2022.132237
Lin, B., and Teng, Y. (2022). Decoupling of economic and carbon emission linkages: evidence from manufacturing industry chains. J. Environ. Manage. 322, 116081. doi:10.1016/j.jenvman.2022.116081
Liu, J., Yang, Q., Ou, S., and Liu, J. (2022). Factor decomposition and the decoupling effect of carbon emissions in China’s manufacturing high-emission subsectors. Energy 248, 123568. doi:10.1016/j.energy.2022.123568
Liu, Z., Gao, J., He, L., Han, S., Ren, Y., Jing, Y., et al. (2023b). The interaction between economic growth, energy consumption and carbon dioxide emissions in China: an empirical analysis based on panel VAR. Chongqing Soc. Sci. 14 (9), 111–124. doi:10.1186/s40104-023-00903-7
Ma, X., Wang, C., Dong, B., Gu, G., Chen, R., Li, Y., et al. (2019). Carbon emissions from energy consumption in China: its measurement and driving factors. Sci. Total Environ. 648, 1411–1420. doi:10.1016/j.scitotenv.2018.08.183
Pan, X., Guo, S., Xu, H., Tian, M., Pan, X., and Chu, J. (2022). China’s carbon intensity factor decomposition and carbon emission decoupling analysis. Energy 239, 122175. doi:10.1016/j.energy.2021.122175
Qing, G., Luo, Y., Huang, W., Wang, W., Yue, Z., Wang, J., et al. (2021). Driving factors of energy consumption in the developed regions of developing countries: a case of Zhejiang province, China. Atmosphere 12 (9), 1196. doi:10.3390/atmos12091196
Shang, Y., Lu, S., Shang, L., Li, X., Wei, Y., Lei, X., et al. (2016). Decomposition methods for analyzing changes of industrial water use. J. Hydrol. Amst. Neth. 543, 808–817. doi:10.1016/j.jhydrol.2016.10.053
Shao, S., Liu, J., Geng, Y., Miao, Z., and Yang, Y. (2016). Uncovering driving factors of carbon emissions from China’s mining sector. Appl. Energy 166, 220–238. doi:10.1016/j.apenergy.2016.01.047
Song, X., Jia, J., Hu, W., and Ju, M. (2021). Provincial contributions analysis of the slowdown in the growth of China’s industrial CO2 emissions in the "new normal. Pol. J. Environ. Stud. 30 (3), 2737–2753. doi:10.15244/pjoes/129689
Waheed, R., Sarwar, S., and Chen, W. (2019). The survey of economic growth, energy consumption and carbon emission. Energy Rep. 5, 1103–1115. doi:10.1016/j.egyr.2019.07.006
Wang, J., Hu, M., and Rodrigues, J. F. D. (2018). An empirical spatiotemporal decomposition analysis of carbon intensity in China’s industrial sector. J. Clean. Prod. 195, 133–144. doi:10.1016/j.jclepro.2018.05.185
Wang, X., and Yan, L. (2022). Driving factors and decoupling analysis of fossil fuel related-carbon dioxide emissions in China. Fuel 314, 122869. doi:10.1016/j.fuel.2021.122869
Wang, Y., Mo, S., Zhang, C., Zhi, J., and Li, C. (2023). Decomposition of drivers and identification of decoupling states for the evolution of carbon emissions from energy consumption in China. Sci. Pollut. Res. 30, 75629–75654. doi:10.1007/s11356-023-27745-0
Wen, L., and Li, Z. (2020). Provincial-level industrial CO2 emission drivers and emission reduction strategies in China: combining two-layer LMDI method with spectral clustering. Sci. TotaEnviron 700, 134374. doi:10.1016/j.scitotenv.2019.134374
Wu, X., Xu, C., Liu, C., Ma, T., Xu, J., and Zhang, C. (2022). Carbon emission of China’s power industry: driving factors and emission reduction path. Environ. Sci. Pollut. Res. 29 (52), 78345–78360. doi:10.1007/S11356-022-21297-5
Wu, Y., Zhu, Q., and Zhu, B. (2018). Decoupling analysis of world economic growth and CO2 emissions: a study comparing developed and developing countries. J. Clean. Prod. 190, 94–103. doi:10.1016/j.jclepro.2018.04.139
Xiong, G., Deng, J., and Ding, B. (2022). Characteristics, decoupling effect and driving factors of regional tourism’s carbon emissions in China. Environ. Sci. Pollut. Res. 29 (31), 47082–47093. doi:10.1007/s11356-022-19054-9
Xu, G., Zhao, T., and Wang, R. (2022). Decomposition and decoupling analysis of factors affecting carbon emissions in China’s regional logistics industry. Sustainability 14 (10), 6061. doi:10.3390/su14106061
Xu, J., Yang, X., and Li, R. (2024). The spatial and temporal heterogeneity of carbon emission and its driving forces in urban households. China Environ. Sci. 4 (3), 1732–1742. doi:10.19674/j.cnki.issn1000-6923.2024.0070
Yang, H., Lu, Z., Shi, X., Muhammad, S., and Cao, Y. (2021). How well has economic strategy changed CO2 emissions? Evidence from China’s largest emission province. Sci. Total Environ. 774, 146575. doi:10.1016/j.scitotenv.2021.146575
Yang, J., Cai, W., Ma, M., Li, L., Liu, C., Ma, X., et al. (2020). Driving forces of China’s CO2 emissions from energy consumption based on Kaya-LMDI methods. Sci. Total Environ. 711, 134569. doi:10.1016/j.scitotenv.2019.134569
Yang, S., and Chen, W. (2022). Analysis of the decoupling state and driving forces of China’s construction industry under the carbon neutrality target. Environ. Sci. Pollut. Res. 29 (52), 78457–78471. doi:10.1007/s11356-022-21266-y
Ye, H., Wang, Q., Zhou, D., and Lu, Z. (2019). Factors influencing the progress in decoupling economic growth from carbon dioxide emissions in China’s manufacturing industry. Resour. Conserv. Recycl. 146, 77–88. doi:10.1016/j.resconrec.2019.03.034
Yu, Q., Jia, J., Zhu, C., and Peng, H. (2023). Temporal and spatial transition characteristics and influencing factors of carbon emissions from direct energy consumption of Chinese residents. Res. Environ. Sci. doi:10.13198/j.issn.1001-6929.2024.04.06
Yu, X., Liang, Z., Fan, J., Zhang, J., Luo, Y., and Zhu, X. (2021). Spatial decomposition of city-level CO2 emission changes in Beijing-Tianjin-Hebei. J. Clean. Prod. 296, 126613. doi:10.1016/j.jclepro.2021.126613
Zhang, C., Su, B., Zhou, K., and Yang, S. (2019). Decomposition analysis of China’s CO2 emissions (2000–2016) and scenario analysis of its carbon intensity targets in 2020 and 2030. Sci. Total Environ. 668, 432–442. doi:10.1016/j.scitotenv.2019.02.406
Zhang, P., Hu, J., Zhao, K., Chen, H., Zhao, S., and Li, W. (2022). Dynamics and decoupling analysis of carbon emissions from construction industry in China. Buildings 12 (3), 257. doi:10.3390/buildings12030257
Zheng, J., Mi, Z., Coffman, D., Milcheva, S., Shan, Y., Guan, D., et al. (2019). Regional development and carbon emissions in China. Energy Econ. 81, 25–36. doi:10.1016/j.eneco.2019.03.003
Zhou, C., and Chen, X. (2023). Forecasting China’s energy consumption and carbon emission based on multiple decomposition strategy. Energy Strategy Rev. 49, 101160. doi:10.1016/j.esr.2023.1011606/J.ESR.2023.101160
Keywords: carbon emissions, LMDI, energy consumption, driving factors, high energy-consuming regions, Liaoning province
Citation: Feng D and Yan C (2024) Driving factors and decoupling analysis of carbon emissions from energy consumption in high energy-consuming regions: a case study of Liaoning province. Front. Environ. Sci. 12:1406754. doi: 10.3389/fenvs.2024.1406754
Received: 25 March 2024; Accepted: 17 June 2024;
Published: 05 July 2024.
Edited by:
Zhangqi Zhong, Guangdong University of Foreign Studies, ChinaReviewed by:
Lu Yang, Guangdong University of Foreign Studies, ChinaJincai Zhao, Henan Normal University, China
Copyright © 2024 Feng and Yan. This is an open-access article distributed under the terms of the Creative Commons Attribution License (CC BY). The use, distribution or reproduction in other forums is permitted, provided the original author(s) and the copyright owner(s) are credited and that the original publication in this journal is cited, in accordance with accepted academic practice. No use, distribution or reproduction is permitted which does not comply with these terms.
*Correspondence: Chenyang Yan, [email protected]