2. Materials and Methods
2.1. Volunteers
A total of 96 volunteers participated in the lumbar and hip-joint stiffness measurement. Participants consisted of 52 males and 44 females; their age ranged from 20 to 60 years old. The mean and standard deviation of height was 1.67 ± 0.08 m, weight was 63.4 ± 11.6 kg, age was 36.0 ± 13.3, and BMI was 22.8 ± 3.5. These volunteers were recruited as healthy Japanese adults who did not have lower-back pain. Volunteers signed a consent form of their own volition after receiving an explanation of the measurements before the experiment. Data were not used for any purpose other than the study described to the volunteers, and data were recorded anonymously so that they could not be linked to individual volunteers. All experiments were conducted during the daytime and took approximately 3 h per person.
In the pelvic alignment measurements, participants included a total of 24 adults (20 males and 4 females) in standing posture and 25 adults (20 males and 5 females in their 20s and 60s) in forward bending. The number of volunteers in the standing position is small because volunteers with unclear imaging of the hip bone, which is necessary for alignment measurement, were excluded. These volunteers were part of the 96 volunteers who participated in the measurement of joint stiffness and who consented to exposure by radiography. The mean and standard deviation of height was 1.70 ± 0.05 m, weight was 66.9 ± 10.3 kg, age was 39.5 ± 13.5, and BMI was 23.4 ± 3.1. Pelvic alignment measurements were also taken during the daytime and took approximately 30 min per person.
The experiments in this study were approved by the institutional review board (Ethics Review Committee concerning Engineering Research with Human Subjects in the Graduate School of Information Science and Technology, Hokkaido University, No. 352).
2.2. Estimation of Joint Stiffness
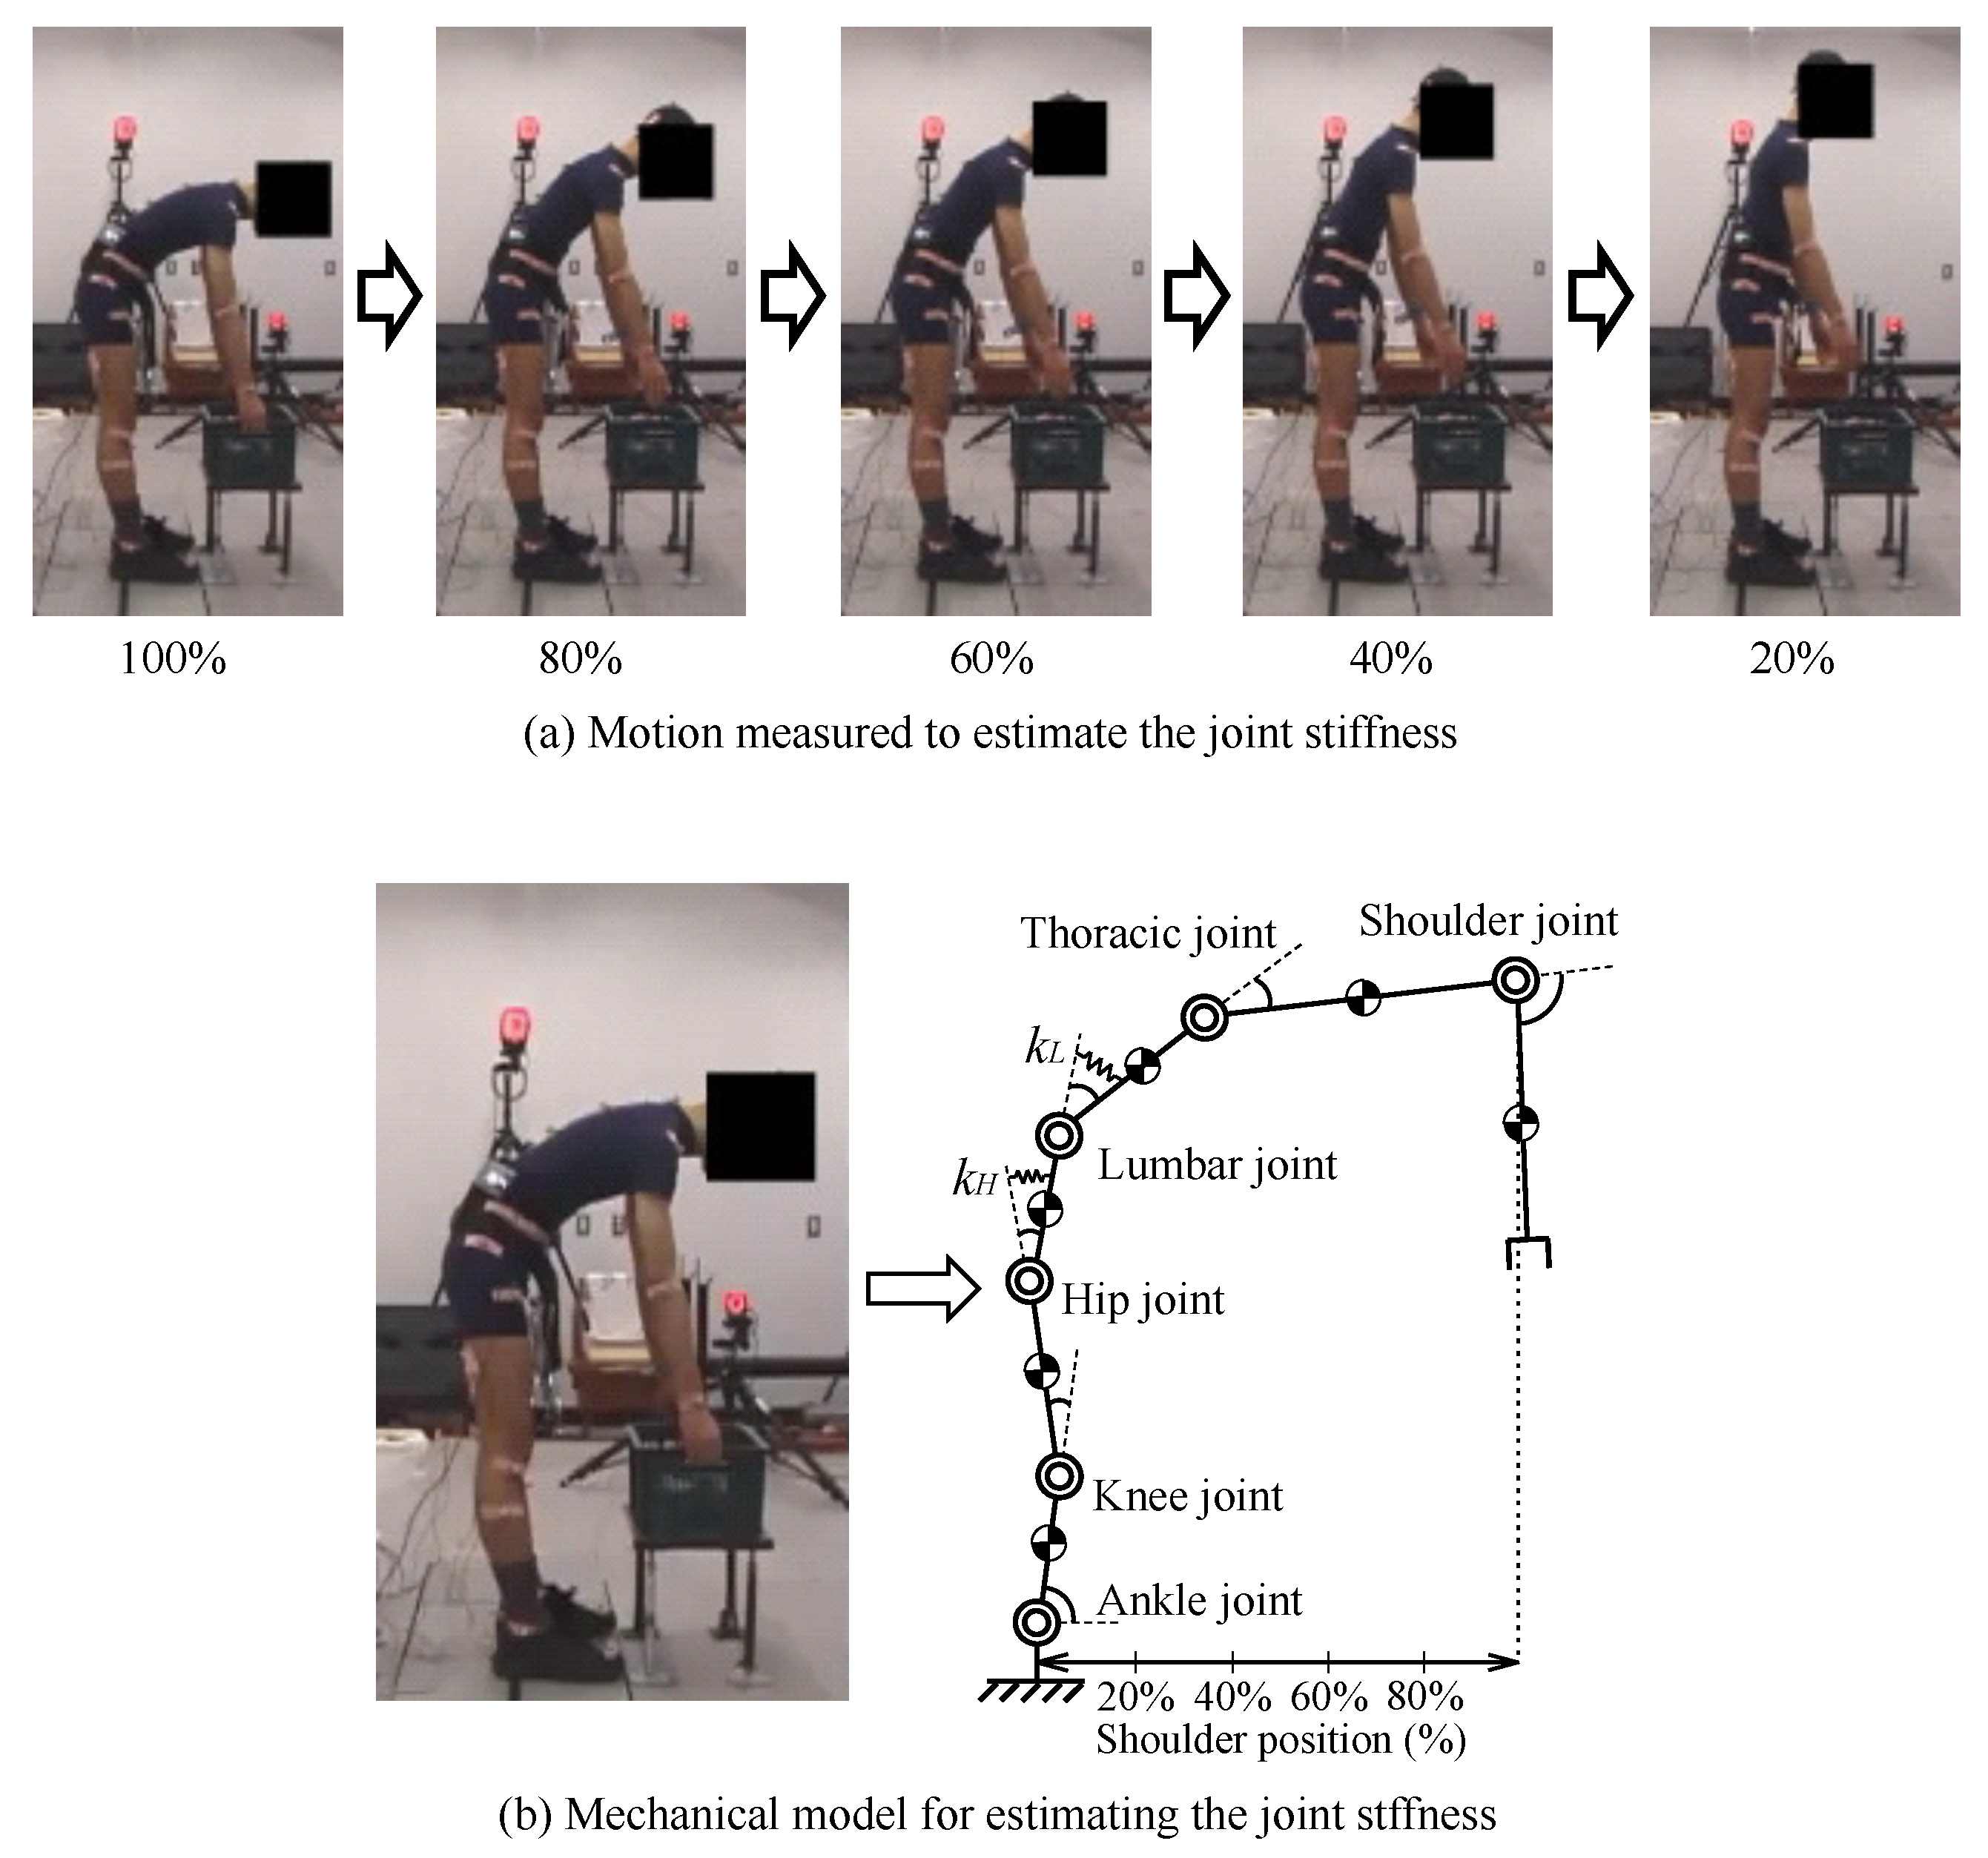
The estimation of joint stiffness was based on motion analysis using a motion-capture system (MAC3D System, Motion Analysis Corp., 6085 State Farm Drive Suite 100, Rohnert Park, CA 94928, USA). The motion to be measured was the extension of the upper body from the forward bending posture to the upright posture, as shown in
Figure 4a. During this motion, the volunteer did not hold any load at hand. The initial forward bending posture of the target motion was made so that the tilt angle on the body surface near the 12th thoracic vertebra was 45 degrees. Before the experiment, each volunteer performed a 45 degree forward bending posture and recorded the position of their hand. During measurement, a table was placed at the recorded height, and the initial posture of the motion was defined by the volunteer touching the table. Volunteers were instructed not to bend the knee joint during the movement, which allowed all volunteers to perform a constant movement, regardless of leg length. The target motion was measured 10 times in each of the conditions of not wearing the pelvic belt and wearing the pelvic belt and applying a tightening force. In the pelvic-belt-wearing condition, the belt tension was set at 80 N. The belt tension was adjusted by Active Corset [
9,
10]. It is known that the assistance effect of the pelvic belt saturates at a tension of 50 N [
23,
24], but it was expected that some volunteers with greater body weight or height would require a higher tightening force. Therefore, in order to provide sufficient assistance to all volunteers, the belt tension was set at 80 N, the upper limit of the Active Corset’s output. The width of the belt was 50 mm, and the position of the belt was below the superior anterior iliac spine and above the greater trochanter.
Figure 4b of the mechanical model that represented the motion of the body on the sagittal plane is used to estimate the stiffness values
y
of the lumbar and hip joints. The joint stiffness values
y
are obtained from the motion equation (Equation (
1)) of the mechanical model. The subscript
x in Equation (
1) represents each joint and takes either
H (hip joint) or
L (lumbar joint). Additionally,
denotes the flexion angle of joint
x, whereas
pertains to the elastic equilibrium point of joint
x. The joint angle
was measured directly from the motion capture, and the angular velocity
and angular acceleration
were obtained by time differentiating the joint angle.
The suffix
i represents the time series index of the measured data, and
s represents the measured data point. Equation (
1) consists of an inertial term
, a centrifugal/Coriolis force term
, a gravity term
, an elastic term
, and a muscle exertion torque term
. All these terms can be subsequently calculated, except for the muscle exertion torque
directly from the joint angle
, angular velocity
, and angular acceleration
.
The muscle exertion torque
was eliminated using Equation (
2). This is because the latency of the spinal reflex of the erector spinae muscles for postural maintenance was at least 30 ms. The reason for Equation (
2) is that there was no change in muscle activity of the lower-back between three consecutive samples. WATANABE [
25] measured the latent time for the spinal reflex of erector spinae muscles by using electromyogram and reported that the latency was 70–90 ms in most cases, with a minimum of 30 ms. Thus, for at least 30 ms, the spinal reflex caused by the posture change during the measured motion does not change the back muscle torque. Furthermore, the change in joint angle during 30 ms was minimal, with an average of 0.008 rad for the hip joint and 0.007 rad for the lumbar joint among 96 volunteers who participated in the measurement. The change in posture during this period was minute, and the change in muscle torque was expected to be sufficiently small for Equation (
2) to hold.
The measurement period of motion capture was 10 ms, and there was no change in muscle exertion torque between the three samples (30 ms). Therefore, Equation (
3) can be obtained by taking the difference between
y
in Equation (
1) and applying Equation (
2). In Equation (
3), all terms on the right side can be calculated directly; thus, the stiffness values of the lumbar and hip joints can be obtained by the regression analysis using the least squares method [
10].
The lumbar joint has non-linear elastic characteristics so that the process of the target motion was divided into several sections, and joint stiffness was calculated for each section. To divide target motion, a scale called shoulder position was introduced. Shoulder position expresses the degree of forward bending of the upper body and is calculated as the horizontal distance from the base of the model to the midpoint of both shoulders. Shoulder position reaches 0% at the standing posture during the extension of the model joint and 100% with forward bending at
, which is the initial posture of the target motion (
Figure 4b). The lumbar (
) and hip (
) joint stiffness was calculated in four sections, in which the shoulder position values were 20–40%, 40–60%, 60–80%, 80–100%.
Additionally, this study calculates the joint stiffness ratio
R using Equation (
4). We have assessed that the pelvic belt increases the lumbar joint stiffness relative to the hip joint stiffness by evaluating the increase in joint stiffness ratio
R [
10].
The joint stiffness values estimated in this study include the stiffness values of any tissue acting as an elastic element in Equation (
1). This includes resistance due to joint friction, the effect of trunk stiffness caused by increased intra-abdominal pressure from contraction of the rectus and transversus abdominis muscles, and the elasticity of the back muscle groups and lumbar intervertebral ligaments. Among these, the resistance due to joint friction was expected to change by correcting the alignment by the tightening force, and to affect the stiffness value of the lumbar joint
.
2.3. Measurement of Pelvic Alignment
This section describes the method used to measure pelvic alignment, which is the input information of the model. X-ray images have generally been used for the measurement of pelvic alignment features [
4,
26,
27,
28,
29,
30,
31,
32]; therefore, our study also used this methodology accordingly.
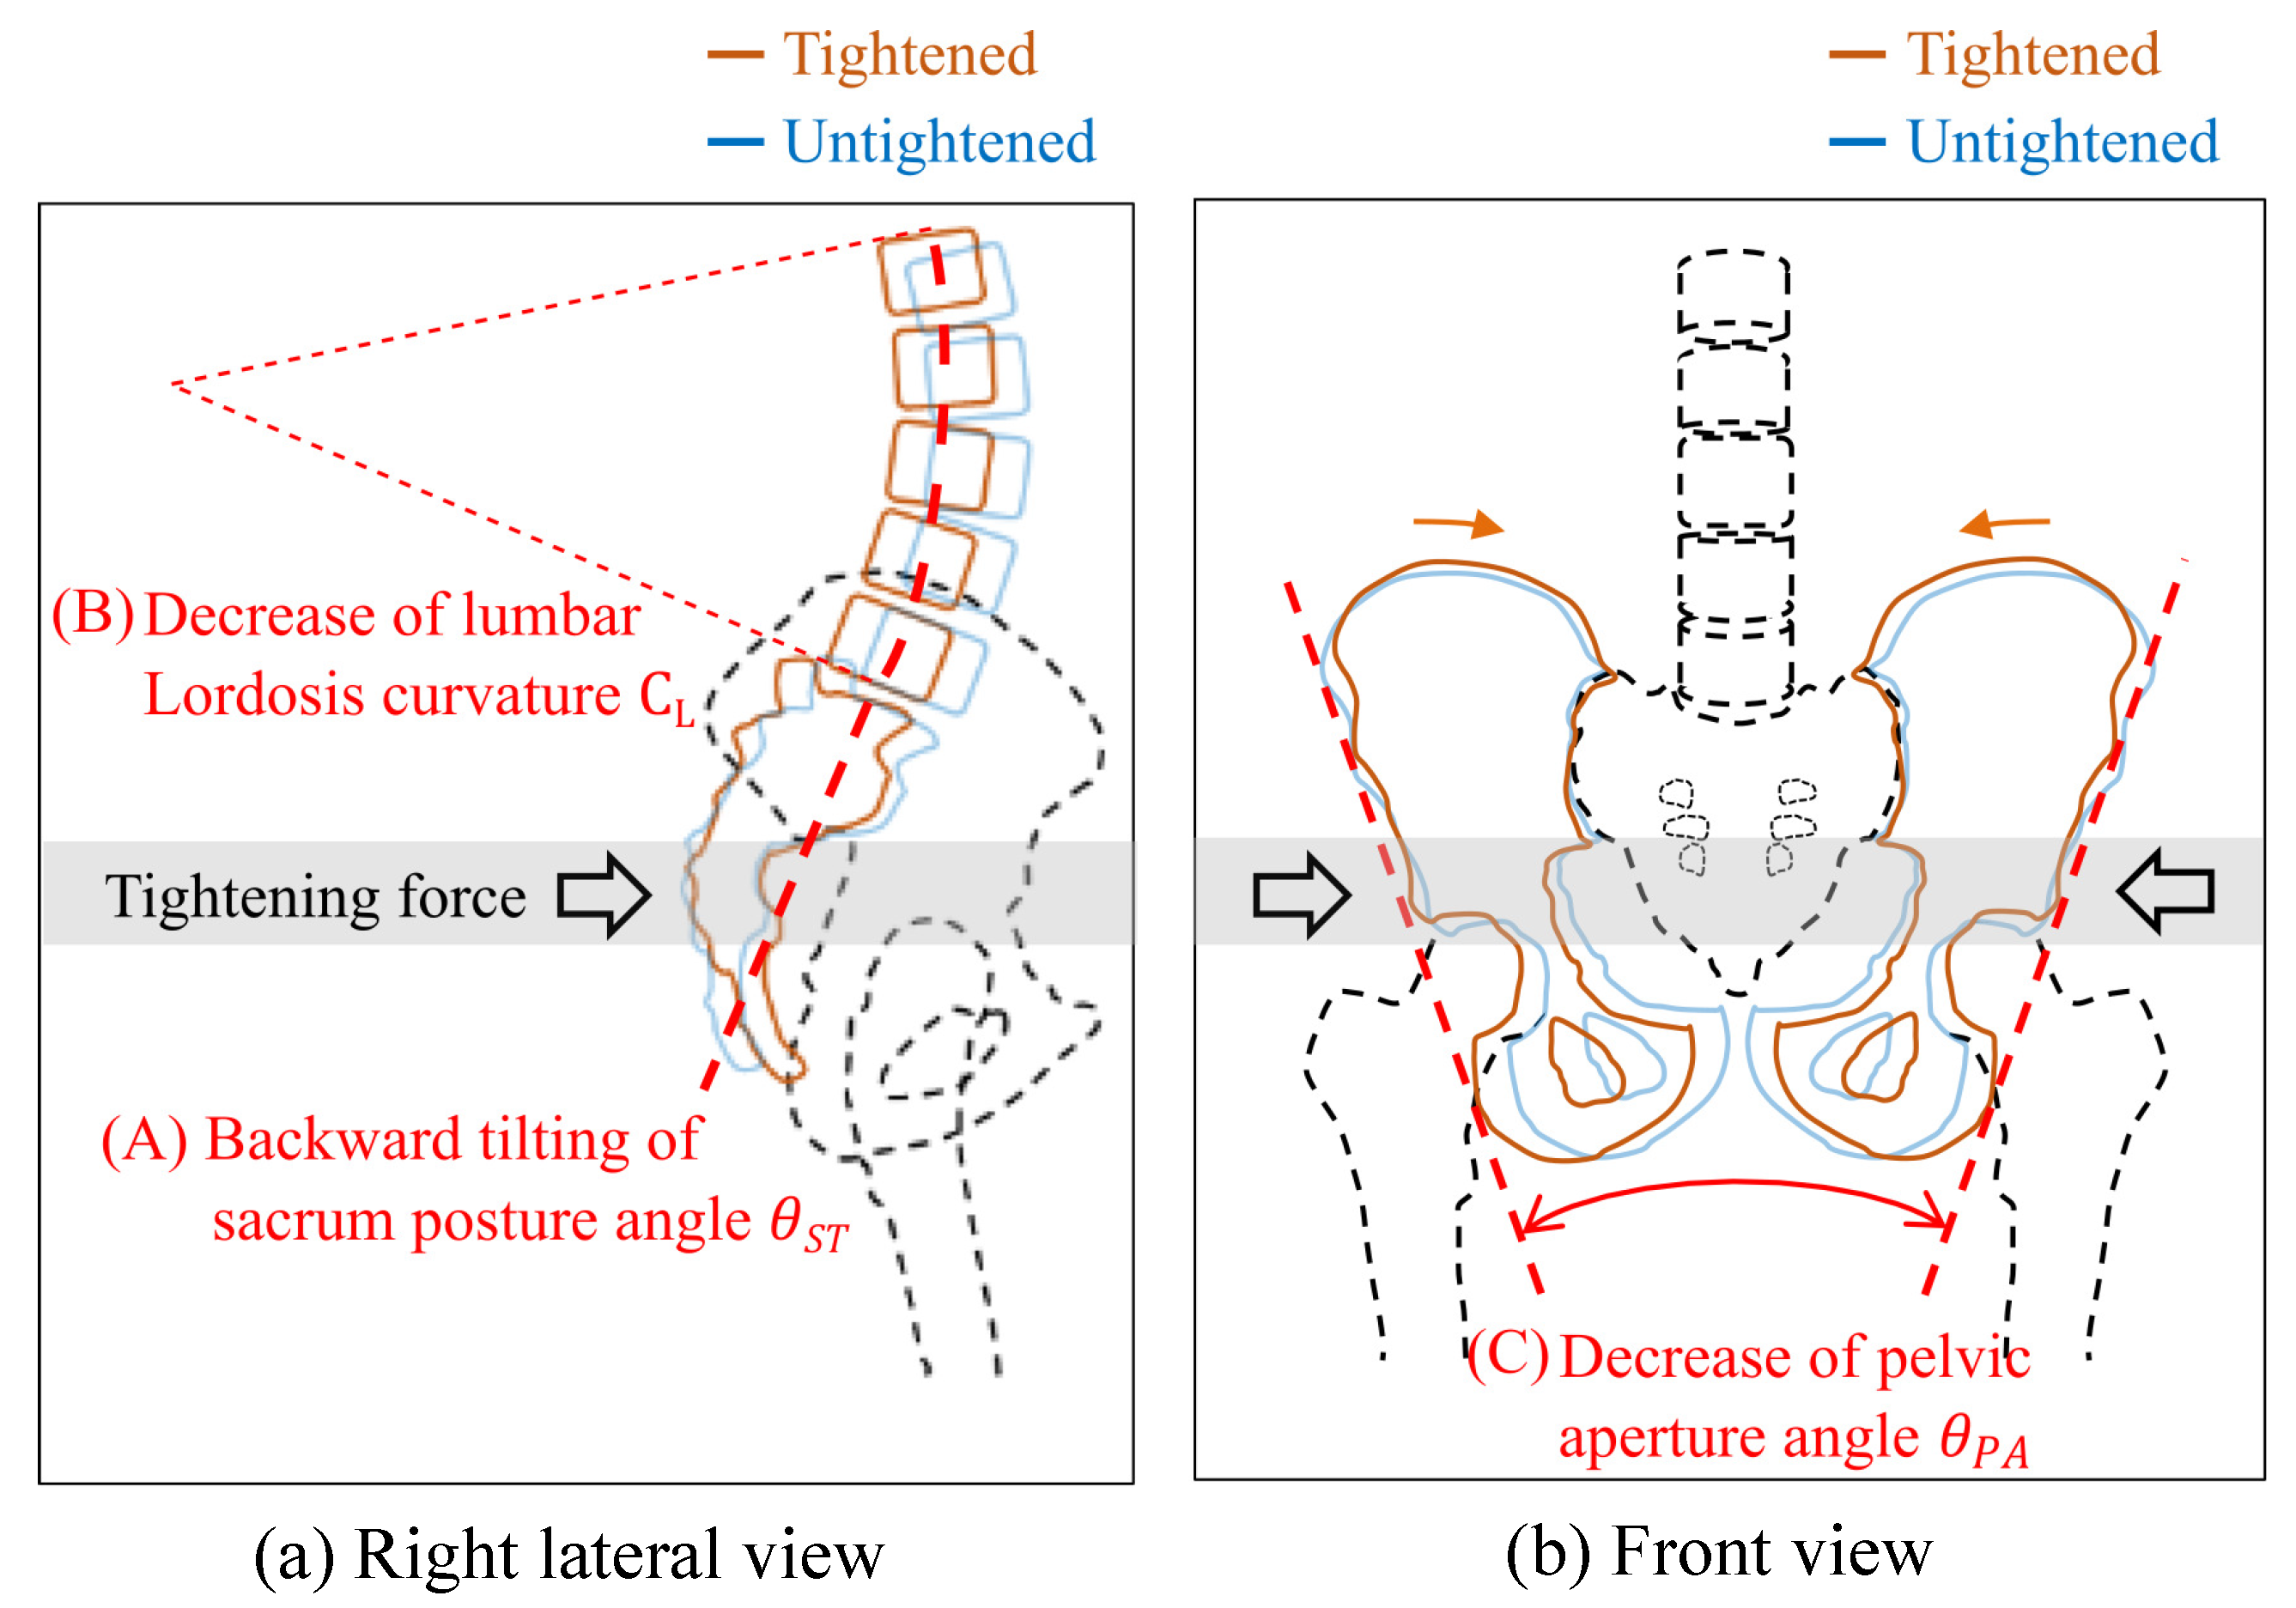
This study measured the following alignment information, which is known to be changed by tightening forces [
17,
18]:
- (A)
Posture angle of the sacrum relative to the pelvis
(
Figure 2a);
- (B)
Curvature of the lumbar lordosis
(
Figure 2a);
- (C)
Pelvic aperture angle
(
Figure 2b).
Regarding posture angle (A), when the pelvis is tightened, the tightening force acts on the bones from the belt in the front–back direction of the body, as shown in
Figure 2a. The force acts on the lower part of the sacrum and tilts the sacrum backward with respect to the pelvis, with the lumbar joint as the axis of rotation [
17].
Next, in term of the curvature (B), the study expects that the alignment of the vertebral bodies connected to the top of the sacrum changes due to the tilting of the sacrum. The lumbar spine curves toward the front of the body. However, when the sacrum tilts backward, lumbar spine lordosis is alleviated.
For aperture angle (C), on the coronal plane, the tightening force acts on the hipbone in the horizontal direction (
Figure 2b). The force deforms the pelvis in a direction that reduces the distance between the left and right superior anterior iliac spines [
17,
18].
To measure the posture angle (A), an image of the sagittal plane taken from the left lateral side of the human body is used (
Figure 5a,b). This measurement was performed for each of the standing and forward bending postures. To obtain the relative posture angle of the sacrum with respect to the pelvis, the inclination angles of the sacrum and pelvis are measured. A line that connects the superior anterior iliac spine and pubic symphysis is drawn to measure the pelvic inclination angle (
). To measure the sacral inclination angle (
), another line that connects the central part of the sacrum and sacral cornu is drawn. Based on
y
, the posture angle of the sacrum relative to the pelvis
is calculated using Equation (
5).
To obtain the curvature (B), images of the standing and forward bending postures taken from the sagittal plane were used as for the posture angle (A) measurement. Each of the five lumbar vertebrae is complemented by a quadrangle to determine the position of the barycenter (
Figure 5a,b). The curvature of lumbar lordosis
is calculated as the inverse of the curvature radius
r of the arc approximated from five barycenter points.
The alignment feature of aperture angle (C) was measured only during standing because the pelvis cannot be imaged from the front of the human body during forward bending (
Figure 5c). To evaluate the opening in the upper part of the pelvis, the pelvic aperture angle is measured. A line connecting the superior anterior iliac spine and the lower end of the ischium is drawn on the left and right hipbones. The angle between the two lines is considered the pelvic aperture angle (
).
where,
: sacrum tilt angle relative to the pelvis without tightening;
: sacrum tilt angle relative to the pelvis with tightening;
: curvature of the lumbar spine without tightening;
: curvature of the lumbar spine with tightening;
: pelvic aperture without tightening;
: pelvic aperture with tightening.
Equations (
6)–(
8) are used to determine the variation of each alignment feature
,
,
. The belt tension of pelvic tightening was 80N.
4. Discussion
This study hypothesized that posterior tilting of the sacral (increase in
) increases in lumbar joint stiffness.Therefore, parameter
was expected to obtain a positive value. Similarly, the lumbar lordosis curvature was expected to decrease with the increase in lumbar joint stiffness, and
should obtain a negative value. In the forward bending position, lumbar joint stiffness increased with the changes in alignment, as expected.
Table 2 shows that the sacral posture angle mainly included changes in stiffness for lumbar bending. However, in the standing position, no significant correlation was observed, and
obtained a negative value. We assume that this result is due to the backward tilting of the sacrum to the limit of motion range in the standing position. Thus, the study considered that joint stiffness increased because the tightening force applied to the pelvis and sacrum generated stress, which increased the frictional resistance of the joint surface.Nevertheless, the alignment remained the same because of the limit of the motion range of the sacroiliac joint.
Next, we discuss modeling errors due to the use of pelvic alignment information measured by X-ray images as input. The proposed method showed a significant relationship between the change in lumbar joint stiffness and the sacral tilt angle relative to the pelvis (PI angle)
in the forward bending posture.
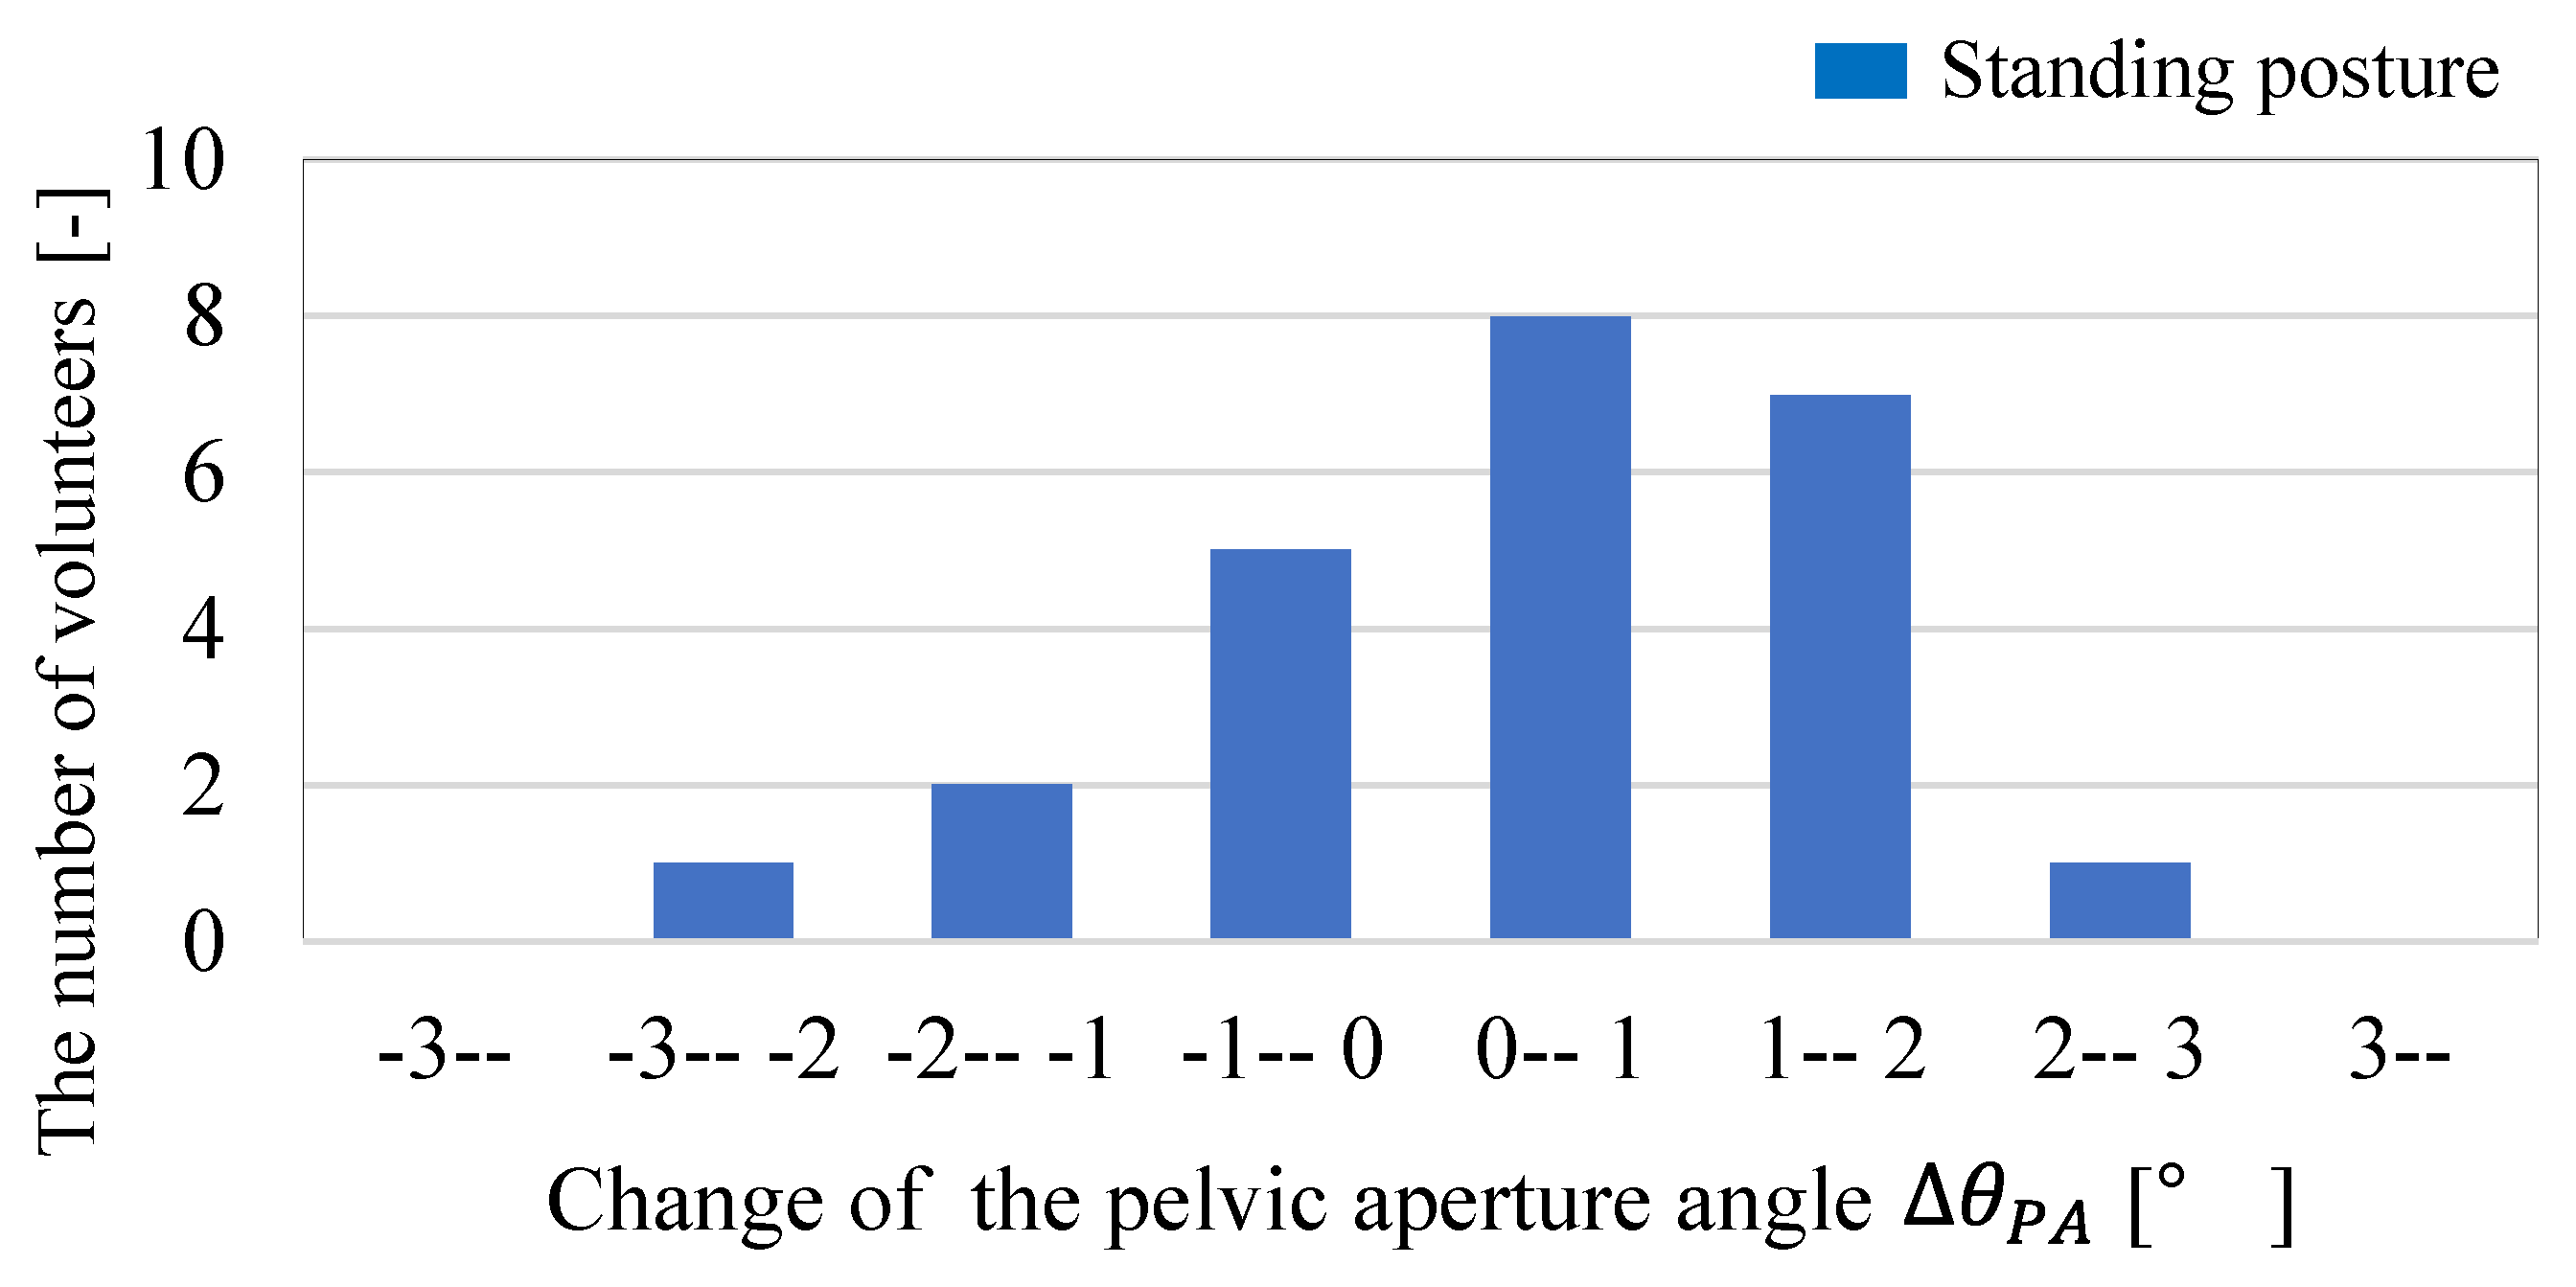
Figure 7 shows that most of the volunteers are within three degrees of the change in
, which raises concerns about the influence of measurement error on the model output. This point is discussed based on the measurement accuracy of X-ray images. Czubak-Wrzosek et al. [
33] measured the PI angle (
) using X-ray images, and stated that the intraclass correlation coefficient (ICC), which represents intraobserver reproducibility, is at least 0.99 and the standard error of measurement (SEM) does not exceed 0.8 degrees. This means that the measurement error of
, the amount of change in
due to pelvic tightening, is at most 1.62 degrees. From
Table 3 in the manuscript, the coefficient
on
is 12.49, so the estimation error of the model output, the change in lumbar joint stiffness,
is less than 20.2 Nm/rad. The distribution of stiffness value change
ranges from −117.4 Nm/rad to 105.7 Nm/rad for the volunteers in this study, and the proposed method is a model with a possibility of 9.1% estimation error for this range.
Czubak-Wrzosek et al. [
33] obtained the standard error of the measurements from 93 measurements, so the standard deviation
is 0.17. Based on this, we have verified the procedures (a) through (c) below to confirm that the measurement error does not affect the conclusions of this study:
- (a)
Input 93 randomly sampled simulated data y instead of y to the model and obtain as output;
- (b)
Add random noise to within 3 (=0.51) to obtain ;
- (c)
Multiple regression analysis with y y .
y are simulated data randomly sampled from within the maximum (3.76 degrees) and minimum (−2.79 degrees) values of and maximum () and minimum () values of , respectively. Even when random noise equivalent to the measurement error was added to , it was found that had a significant correlation with stiffness change in the forward bending posture. The influence of measurement error in pelvic alignment is sufficiently small.
The data used to develop the proposed model consisted of 25 Japanese adults, including 20 males and 5 females. Male height ranged from 1.615 to 1.811 m and weight from 54.3 to 93.9 kg, while female height ranged from 1.503 to 1.649 m and weight from 53.2 to 68.6 kg. According to the 2018 National Health and Nutrition Survey [
34] by the Japanese Ministry of Health, Labour and Welfare, the mean and standard deviation of height and weight of Japanese males were 1.680 ± 0.071 m and 67.3 ± 11.1 kg, respectively, while those of females were 1.544 ± 0.070 m and 55.9 ± 9.3 kg. Assuming that the distributions of height and weight follow a Gaussian distribution, 78.7% of Japanese males and 65.4% of Japanese females for height and 87.1% of males and 34.6% of females for weight are in the range where the volunteers who participated in this experiment are distributed, and are covered by the proposed model. We will need to examine the general applicability of this model to other groups in the future. However, the development of the proposed model is a challenge to explain the process by which pelvic belt tightening force changes joint stiffness from a biomechanical perspective, which has not been clarified previously. This is expected to be useful for future clinical practice and for studying the effectiveness of pelvic belts.
The practical contribution of the developed model is expected to be the preliminary diagnosis of the assisting effect of pelvic belts in clinical practice. The developed model provides outputs on the degree of change in lumbar joint stiffness when changes in pelvic alignment are input. In other words, by inputting alignment changes, the model can estimate the degree of assisting effect required through pelvic tightening. The individual differences were observed regarding the reduction of lumbar burden by pelvic tightening [
2,
9,
14]. From the viewpoint of preventing blood-flow obstruction due to excessive tightening force [
15], or muscle atrophy due to prolonged use of the belt [
16], the use of pelvic belt should be avoided by those who do not obtain the lumbar burden reduction. Therefore, an advanced diagnosis of assistance effect is required. The preliminary estimation of the expected effect of wearing a pelvic belt is used to determine whether to use a pelvic belt in the treatment of lower-back pain.
In the present study, X-ray images were used to measure the pelvic alignment features. However, if such input information can be obtained by a simple measurement using a non-invasive method, then determining the applicability of pelvic tightening is possible through a preliminary examination before prescribing orthosis. The alignment features to be measured are the curvature of the lumbar lordosis and sacral posture angle relative to the pelvis, which were the input of the model. Tsuchiya [
35] estimated lumbosacral alignment based on a musculoskeletal model using a bending sensor and nine-axis IMUs attached to the lumbar and upper body. Based on this method, the curvature of the lumbar lordosis can be measured from the body surface. In addition, the posture angle of the sacrum relative to the pelvis can be estimated based on the position of the barycenter of the upper body. Roussouly et al. [
19] demonstrated that the upper-body posture from the seventh cervical vertebra to the fifth lumbar vertebra is dependent on the PI and SS angles. The inclination angle of the upper body appears as a change in the position of the body CoG. In our subsequent study, we will aim to estimate the sacral posture angle from the lumbar posture measured with IMU and CoG measured using a floor reaction force meter.
5. Conclusions
The study found that pelvic tightening increases the lumbar joint stiffness relative to the hip joint. The results demonstrated that the following alignment features largely contributed to the change in lumbar joint stiffness:
Moreover, the study determined the regression coefficient of the two variables to the change in lumbar joint stiffness. A model that represents the change in lumbar joint stiffness during forward bending was developed, thus achieving the goal of this research. However, during standing, no significant relationship was observed between the changes in alignment and stiffness. These results confirm hypothesis (2), “Increased lumbar joint stiffness due to changes in alignment,” which is one of the unexplained hypotheses of the lumbar burden reduction hypothesis described in the introduction. This study found a tendency for stiffness to change under the influence of pelvic alignment, although it cannot directly prove the increase in frictional resistance of the sacroiliac joint surface due to changes in the posture of the sacrum. Future work should include FEM analysis of the stress increase and frictional resistance changes on the joint surfaces to verify our overall hypothesis.
The method proposed in this study enables quantitative estimation of the stiffness change caused by the pelvic belt. The proposed method can interpolate stiffness changes for 78.7% of male and 65.4% of female healthy Japanese adults based on the height distribution, and for 87.1% of male and 34.6% of female adults based on the weight distribution. However, its applicability to non-Japanese adults, those with lower-back pain, hip joint dysfunction, and children has not been confirmed, and further research is needed. By applying this method, the effectiveness of the pelvic belt can be determined without the long trial period that was necessary to determine the effectiveness of the pelvic belt. However, this method requires radiography, and there are obstacles to its practical use in small hospital facilities. Therefore, for the next task, we propose a method of estimating pelvic alignment by simple measurement from outside the body.


