The scattering behaviour of materials varies in different parts of the infrared spectrum, and this partly depends on whether the surface of the analysed material is smooth relative to the wavelength of incident radiation (leading to specular reflection, also called surface scattering) or rough (leading to volume scattering plus surface scattering). For rough surfaces, Vincent and Hunt [
25] defined specular reflectance as
RS and volume reflectance as
RV. The total reflectance
RT can be expressed as the sum of
RS and
RV, where both components are dependent on (1) the angle of incidence of radiation with respect to the macroscopic surface normal (
j), (2) the angle of observation with respect to the macroscopic surface normal (
q), (3) the packing fraction (
f), (4) the intrinsic index of refraction of the particulate medium (
n), (5) the intrinsic absorption coefficient of the particulate medium (
α), (6) the scattering coefficient of the particulate medium (
s) and (7) the average grain size (
d) [
25]. In the case of currently commercially available field and drill core hyperspectral sensing instruments,
j and
q can be considered invariant and, therefore, as constant. Estimation of parameters
f,
n,
α,
s and
d is inherently difficult at the common spatial resolution of field and drill core line profilometers, as, in most cases, a mineral assemblage must be assumed. Therefore, for this contribution, we assume that the intensity of an absorption band is correlated with the amount of the respective vibrational mode [
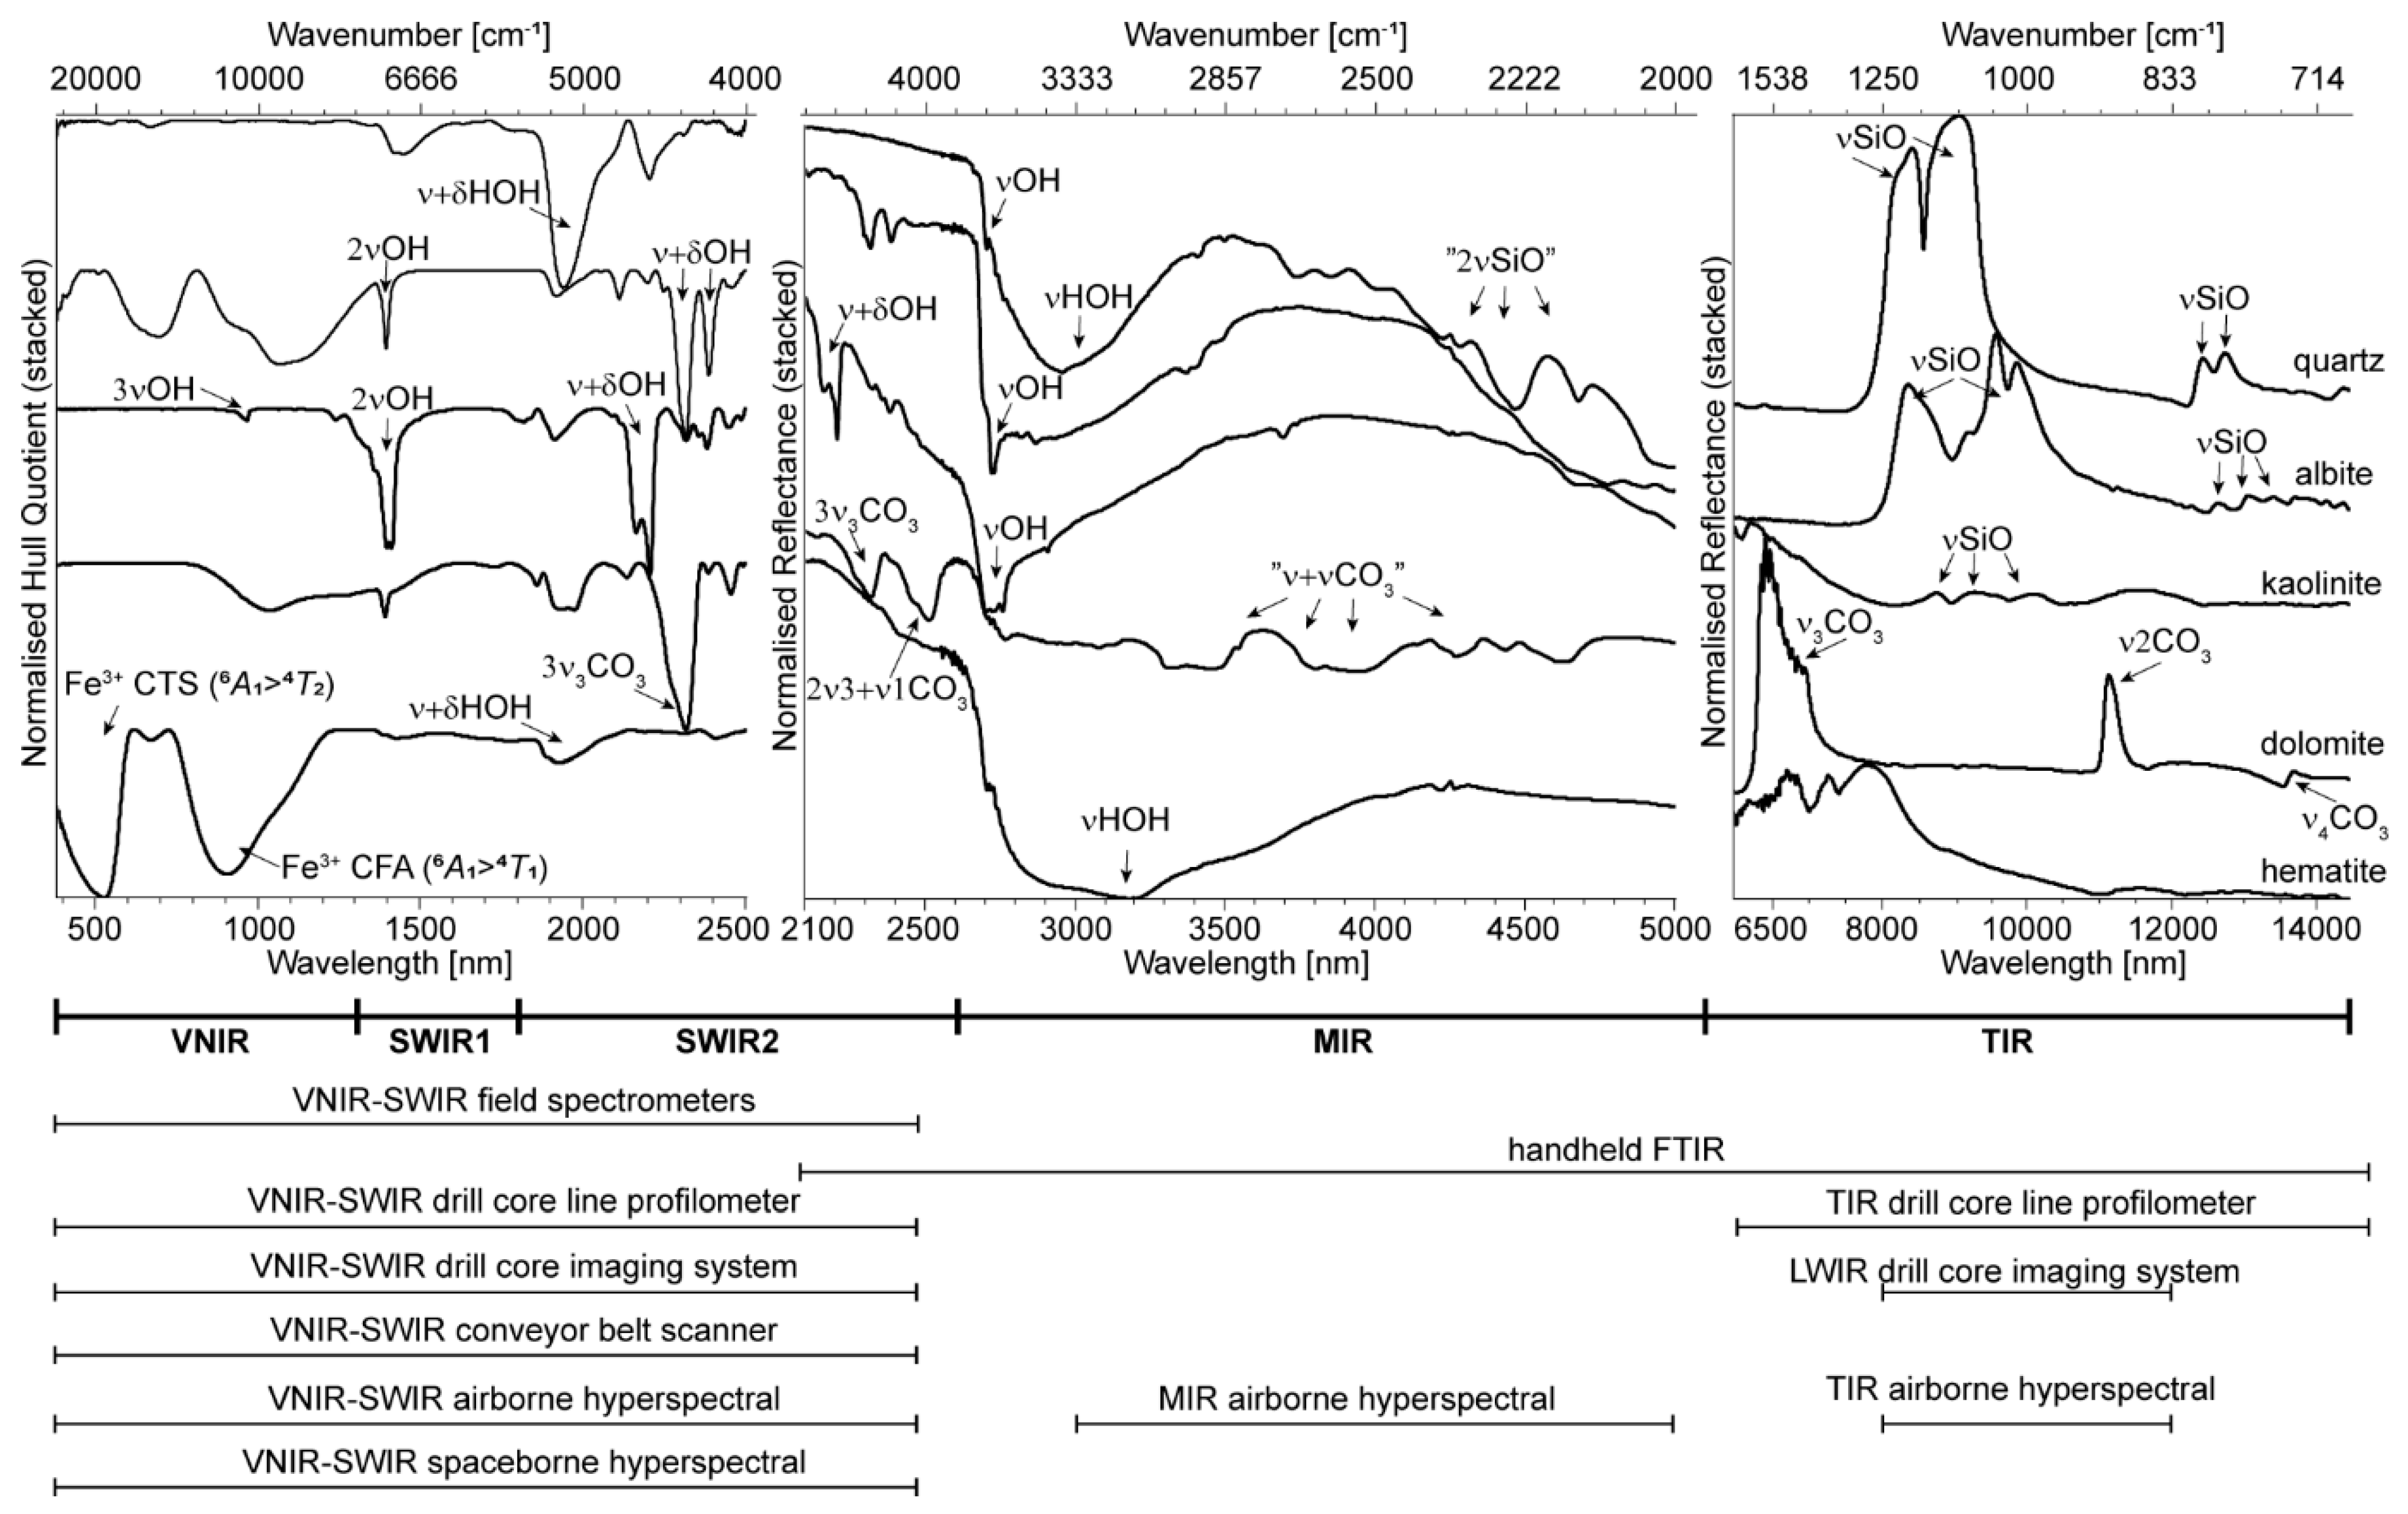
1]. However, it should be noted that this correlation is not necessarily linear, as it is dependent on all the above variables. In reflectance spectra, the SWIR 1, SWIR 2 and MIR wavelength ranges are dominated by volume scattering processes, whereas surface scattering dominates in the TIR. Absorption bands in reflectance spectra are displayed as troughs if the respective mineral acts as a volume scatterer (e.g., in the SWIR in
Figure 1). Reflectance peaks can be observed if the respective mineral is a surface scatterer (e.g., in the TIR in
Figure 1).
RS increases with the strength of the vibrational mode and when the extinction coefficient
k is significantly larger than the refractive index
n. Depending on their grain size, different minerals can have different scattering behaviours in the same wavelength range [
25,
26]. For example, a layer of clinging fines of kaolinite on quartz can result in absorption troughs superimposed on the expected strong quartz-related reststrahlen bands in the 9000-nm wavelength range, as volume scattering applies to the fine-grained kaolinite, whereas surface scattering applies to the underlying coarse-grained quartz.
2.1. SWIR 1 Functional Groups (1300 to 1850 nm)
The first overtones of fundamental stretching vibrations of hydroxyl groups (2νOH) in hydroxyl-bearing minerals are the predominant absorption features occurring in the 1300 to 1850 nm wavelength region (
Table 1). All hydroxylated silicates and sulphates exhibit these absorptions. For example, in sheet silicates (e.g., kaolin group, white mica, talc, smectite, chlorite), 2νOH is mostly located between 1390 and 1445 nm. Kustov et al. [
27] demonstrated in a study of zeolites that hydroxyl-related overtones can be more sensitive to the hydroxyl environment (i.e., the type of cations bonded to the OH group) than their fundamental stretching vibrations in the MIR wavelength range.
Overtones of fundamental vibrations should be located at double the frequency of the fundamental. However, due to the anharmonic character of vibrations, overtones of fundamental vibrations are located at a lower frequency (i.e., longer wavelength) than double the frequency of the fundamental vibration. The difference is described by the square of the anharmonicity constant
C, which is around 171 cm
−1 in the case of sheet silicates [
28]. The wavelength position of the strongest absorption band depends on the cation bonded to the infrared-active OH group. This means that the wavelength position of the fundamental OH vibration (νOH) and its overtone (2νOH) increases with the electronegativity of the cation bonded to OH [
29]. As a result, for example, Mg- or Al-rich sheet silicates absorb at shorter wavelengths when compared to Fe- or Ni-rich sheet silicates. The sheet silicate prehnite exhibits strong absorption at around 1477 nm, which is due to its comparably high content of ferric iron [
30] and is therefore positioned at distinctly longer wavelengths when compared to other sheet silicates. On the other hand, Li-OH absorptions, which indicate the presence of Li-bearing hydroxylated silicates such as lepidolite, are positioned at comparably short wavelengths around 1390 nm [
28,
31].
The epidote series comprises a solid solution series ranging from clinozoisite (Ca
2Al
3Si
3O
12(OH)) to pistasite (Ca
2Fe
3+Al
2Si
3O
12(OH)) as the two endmembers of the AlFe
3+−1 solid solution. Each OH group in epidote is bonded to two M sites, which are occupied by varying amounts of Al and Fe
3+. Hydroxylated sorosilicates of the epidote series are characterised by absorptions in the 1545 to 1563 nm wavelength range, which are also due to 2νOH. These absorption features can be readily separated from hydroxyl-related overtones in other minerals and do not overlap with atmospheric absorptions in the 1400-nm wavelength range, which pose a challenge in optical Earth observation data [
32]. Roache et al. [
33] used the wavelength position of 2νOH to track the AlFe
−1 exchange vector in epidote series minerals in the context of Archean gold deposits in the Eastern Yilgarn Craton of Australia, separating the shorter-wavelength epidote (Fe-rich) from the longer-wavelength clinozoisite (Al-rich). It is noted that the latter hydroxyl-related absorptions do overlap with combinations of NH
4-related fundamental stretching vibrations ν
1 + ν
3NH
4, which occur, for example, in the ammonium-bearing feldspar buddingtonite [
34].
Hydroxylated sulphates also display several absorptions in the SWIR 1 wavelength range. For example, alunite and jarosite are both characterised by strong absorption at around 1470 nm, which can be assigned to an overtone of the OH-related stretching fundamental or a combination band of the OH-related stretching fundamental and a first overtone of a H
2O-related bending vibration (2δH
2O) [
35]. In the case of alunite, Bishop and Murad (2005) [
35] described that a shift in the 1470-nm absorption feature to longer wavelengths is correlated with the increasing NaK
−1 exchange vector. The relative amount of Na and K in alunites is correlated with the temperature of formation [
36], and the wavelength position of the 1470 nm absorption was used by [
37] to vector towards the intrusive centre of porphyry Cu-Au deposits. Sulphates display additional absorption features centred at 1750 nm, 1763 nm and 1849 nm for which wavelength positions are less susceptible to compositional changes but still are useful indicators of the presence of the respective sulphate species (
Table 1) [
35]. In drill core hyperspectral data, other surficial sulphates, such as epsomite, melanterite, goslarite and copiapite, are frequently observed in pyritic weathered zones and on the surfaces of oxidised samples and cores, especially in humid conditions.
The relative intensity of absorption features in the SWIR 1 wavelength region, which is related to vibrational modes, can be impacted by the presence of transition metals that cause strong electronic absorption features in the VNIR wavelength range (e.g., ferric and/or ferrous iron in iron oxides or carbonates). The reader is referred to Burns [
14] for an overview of the respective absorption features related to transition metals. Additional electronic features can result from REE contained within, for example, phosphates, carbonates and silicates [
38,
39,
40].
Table 1.
SWIR 1-active vibrational modes commonly observed in rock-forming and alteration minerals, their wavelength positions (in nm) as well as the titles of scripts for extracting the relative intensity and wavelength position of the respective absorption features.
Table 1.
SWIR 1-active vibrational modes commonly observed in rock-forming and alteration minerals, their wavelength positions (in nm) as well as the titles of scripts for extracting the relative intensity and wavelength position of the respective absorption features.
| Mineral Group | Mineral Species (Examples) | Assignment of Absorption | Lower Limit (nm) | Upper Limit (nm) | Literature | Intensity Script | Wavelength Script |
|---|
| sheet silicate | kaolinite | 2νMnOH | 1392 to 1415 | [41] | 1400D | 1400W |
| sheet silicate | muscovite | 1406 to 1415 | [31] |
| sheet silicate | lepidolite | 1387 to 1425 | [31] |
| sheet silicate | talc | 1392 to 1412 | [28] |
| sheet silicate | smectites | 1394 to 1445 | [28,42] |
| sheet silicate | palygorskite | 1386 to 1443 | [43] |
| sheet silicate | chlorite | 1391 to 1415 | [44] |
| double chain silicate | calcic amphibole | 1392 to 1413 | [45] |
| sulphate | jarosite | 2νMnOH, ν + 2δH2O | 1471 | [35] | 1480D | 1480W |
| sulphate | alunite | 2νMnOH, ν + 2δH2O | 1473 (K-rich) | 1491 (Na-rich) | [35] |
| sheet silicate | prehnite | 2νM2OH | 1476 (Fe-rich) | 1478 (Mg-rich) | [32] |
| sorosilicate | epidote, clinozoisite, pistasite | 2νM2OH | 1545 (Fe-rich) | 1563 (Al-rich) | [30,32,33] | 1550D | 1550W |
| NH4 | alunite, montmorillonite, buddingtonite, white mica | ν1 + ν3NH4 | 1520 to 1560 | [34] |
| sulphate | gypsum | ν + δOH/H2O and rotational fundamentals or δS-O overtones | 1751 | [46] | 1760D | - |
| sulphate | alunite | ν + 2δMnOH | 1762 (Na-rich) | 1764 (K-rich) | [35,37] | 1760W |
| sulphate | jarosite | ν + 2δMnOH | 1849 | [35] | 1850D | - |
2.2. SWIR 2 Functional Groups (1850 to 2600 nm)
The two main origins of mineral-related absorption features in the SWIR 2 wavelength region (between 2000 and 2600 nm) are a) combinations (ν + δOH) of hydroxyl-related fundamental stretching (νOH) and bending vibrations (δOH), and b) combinations (e.g., 2ν
3 + ν
1 CO
3;
Table 2) or overtones (e.g., 3ν
3CO
3;
Table 2) of carbonate-related fundamental stretching vibrations. Notwithstanding, combinations and overtones of other infrared functional groups can also occur in the SWIR 2. For instance, NH
4-bearing minerals, such as buddingtonite, display a diagnostic absorption feature between 2020 and 2120 nm (
Table 2) [
34]. The respective fundamental vibrations are located in the TIR (described in the Section on TIR Functional Groups). Felzer et al. [
47] postulated that the depth of the 2120-nm absorption is linearly related to the concentration of NH4 in buddingtonite from Cuprite, Nevada, highlighting the potential for quantitative reflectance spectroscopy after calibration with results obtained from geochemical analysis.
Di- and tri-octahedral sheet silicates represent a major group of rock-forming minerals that show diagnostic absorption features in the SWIR 2. Sheet silicates can be separated into five major groups, based on their layer structure:
di-octahedral 1:1 phyllosilicate (“7 Å phase”): e.g., kaolinite;
tri-octahedral 2:1 phyllosilicate (“9 Å phase”): e.g., talc;
di-octahedral 2:1 phyllosilicate (“10 Å phase”): e.g., muscovite, phengite, celadonite;
tri-octahedral 2:1 phyllosilicate (“10 Å phase”): e.g., biotite;
tri-octahedral 2:1:1 phyllosilicate (“14 Å phase”): e.g., chlorite.
This separation is partially adopted from Meunier (2005) [
52], who summarises four principal layer types of phyllosilicates according to the 1/1, 2/1 and 2/1/1 patterns and the basal spacings (i.e., 7 Å, 9 Å, 10 Å, 14 Å). Meunier (2005) [
52] extended the four principal layer types by considering the number of octahedral sites filled in the respective phyllosilicates, which carries important information about the contained infrared functional groups. The resulting five different layer types and the multiple combinations of the respective types in interlayered sheet silicates can lead to a large variety of absorption bands in the SWIR 1 and 2. Only the combination bands related to the main functional groups of the di- and tri-octahedral phyllosilicates in the SWIR 2 are discussed here.
Kaolin group minerals, as the main representatives of the dioctahedral “7 Å phases”, show a characteristic doublet consisting of a major feature fixed at around 2209 nm associated with a secondary feature at around 2160 nm (
Table 2) [
41]. This doublet can be decomposed into four absorption bands, with the three short-wavelength bands (2159 nm, 2169 nm, 2194 nm) related to stretching vibration of the outer hydroxyl groups (ν + δAl
2OH
i, i.e., hydroxyl groups bond to the tetrahedral layer) and the major long-wavelength band (2209 nm) related to stretching vibration of the inner hydroxyl group (ν + δAl
2OH
o) [
41]. Changes in the shape of this characteristic doublet are related to changes in the structure and crystallinity of the kaolin group mineral [
53]. Kaolin can also display a weak to medium absorption feature at 2238 nm related to ν + δ (AlFe
3+)
2OH, where its intensity increases with increasing ferric iron content [
54]. Other combination bands in kaolin group minerals are located at around 2330 nm and 2380 nm, overlapping with the absorption features of carbonates, amphiboles and talc.
Di-octahedral 2:1 sheet silicates (“10 Å phase”) comprise the large group of white micas (e.g., paragonite, muscovite, phengite, celadonite) as well as Al-bearing smectites (e.g., montmorillonite). The dominant absorption feature of these AlOH-bearing sheet silicates at around 2200 nm is due to ν + δAl
2OH (
Table 2). The octahedral Al can be exchanged with Fe
2+ or Mg, and the related charge imbalance is compensated by exchange of the tetrahedral Al with Si. Changes in the Tschermak exchange vector (Al
VIAl
IV(Fe,Mg)
VI−1Si
IV−1) are reflected in shifts in this absorption feature [
3,
55,
56,
57], which shifts to longer wavelengths with increasing replacement of Al
VI by divalent cations (
Figure 3). It should be noted that interlayer cations in mica (
Figure 3) have no influence on the position of the combination features [
58]. Therefore, the separation of Na micas (e.g., paragonite) from Na-void micas (e.g., muscovite) by means of SWIR 2 reflectance spectra is not possible. Smectites show the same shift in the major absorption at around 2200 nm [
55], with beidellite representing the Al-rich smectites and montmorillonite representing the Al-poor smectites. However, smectites and mica-like minerals of the same octahedral composition show a different location of the OH absorption bands, located at shorter wavelengths (ca. 2200 nm) for smectites and longer wavelengths (ca. 2220 nm) for illite [
53,
58]. In sheet silicates that incorporate significant amounts of F, such as lepidolite, the 2200-nm absorption feature shifts to longer wavelengths and shallows as OH is replaced by F [
31]. A second diagnostic absorption feature of white micas is located at 2350 nm (
Figure 3), which is absent in smectites and can therefore be used to differentiate the two mineral groups. This absorption feature becomes more prominent with increasing content of Fe
2+ or Mg. A third diagnostic absorption feature of white mica occurs near 2450 nm, which is, due to low signal-to-noise ratio, difficult to identify in reflectance spectra acquired using commercially available VNIR-SWIR spectrometers (example spectrometers given in
Figure 1).
Di-octahedral 2:1 sheet silicates such as muscovite have, in contrast to the tri-octahedral 2:1 phyllosilicates (e.g., biotite), a vacant third cation site. Both tri-octahedral 2:1 sheet silicates (“10 Å phase”) and tri-octahedral 2:1:1 sheet silicates (“14 Å phase”), such as chlorites, show characteristic absorption features at around 2250 nm and 2340 nm (
Table 2). In chlorites, the ν + δ(Mg,Fe
2+)
2OH (interlayer OH related vibrations = brucite-layer) shifts from around 2248 nm to 2261 nm [
50,
59] from the clinochlore to the chamosite endmember, respectively. Moreover, the ν + δ(Mg, Fe
2+)
3OH (inner OH of 2:1 talc layer) at around 2350 nm can shift according to the MgFe
−1 exchange vector. In practice, it is observed that shifts in the 2248–2261 nm wavelength range (brucite layer) are larger and less conflicted by other minerals than the +/− 2350-nm talc layer [
57].
Talc belongs to the group of tri-octahedral 2:1 sheet silicates (“9 Å phase”). The general composition of talc can be expressed as Si
4O
10M
3(OH)
2 with a Mg-only occupation of the M-sites in the talc sensu stricto endmember and replacement of Mg by Fe
2+ in minnesotaite [
60]. In pure talc, a characteristic doublet can be observed in the 2320-nm wavelength region (
Table 2) that comprises the combination of the stretching in the MIR at 2720 nm [
28] with the bending fundamentals in the TIR at 15,384 nm and at 14,492 nm, respectively. The two resulting absorption bands are located at 2300 and 2279 nm, respectively, overlapping with the Mg-rich endmembers of the actinolite and hornblende series, due to their structural similarity. Additionally, the third major absorption band of talc, located at around 2380 nm (ν + δ(M)
3OH), overlaps with Mg-rich amphiboles such as tremolite. To separate talc from these amphiboles, a weak triple absorption feature (at 2077 nm, 2127 nm and 2172 nm) characteristic of talc can be used.
Major SWIR absorption features of amphiboles occur in the 2320-nm and 2380-nm wavelength regions, overlapping with di- and tri-octahedral phyllosilicates containing Fe
3+, as well as talc and kaolinite (
Table 2). The general formula of calcic amphibole is A(M4)
2(M1)
2(M3)
1(M2)
2(T1)
4(T2)
4O
22(OH)
2, with the major cations occupying the respective sites being: A = Na, K; M4 = Ca, Mn, Li; M1 = Mg, Fe
2+; M2 = Fe
3+, Al, Ti; M3 = Mg, Fe
2+; T1 and T2 = Si, Al, Ti (oxidation state only given for iron for clarity). In calcic amphiboles of the actinolite and hornblende series, the main absorption feature at 2320 nm can be decomposed into eight absorption bands, which are due to combinations of hydroxyl stretching fundamentals ranging from 2723 nm (νMg
3OH) to 2759 nm (νFe
2+3OH), with two major fundamental bending vibrations located at 14,492 nm (690 cm
−1) and 15,384 nm (650 cm
−1) [
45]. A doublet around 2320 nm can be observed in Mg-rich endmembers of the actinolite series (i.e., tremolite), whereas actinolite of an intermediate Mg# (Mg/(Mg + Fe)) shows a broad feature in the same wavelength range. The second main absorption feature of amphiboles in the SWIR 2 is located at around 2380 nm, which is possibly related to the combination of the main hydroxyl stretching fundamentals with a bending vibration at 19,047 nm (525 cm
−1). The location of these two major absorption features is mainly related to the relative abundance of Mg and Fe
2+ occupying the M1 and M3 sites, as these are the only cation sites connected to the OH group responsible for the respective absorption bands [
45]. The M2 and M4 sites, as well as the 12-fold coordinated A position, do not have an impact on the location of the major absorption feature that could be measured with field or drill core hyperspectral reflectance spectrometers. Therefore, detectable differences between the actinolite series and the hornblende series cannot be expected. Only the Mg# (or replacement of Mg or Fe
2+ by other cations on the M1 and M3 sites) results in a clear shift or different shape of the main absorption features of amphiboles in the 2280 to 2420 nm wavelength range. Preliminary, unpublished studies on cummingtonite and riebeckite suggest the possibility of separating the actinolite and hornblende series from Fe-Mn-Mg amphiboles and alkali amphiboles, respectively.
Strong absorption features of hydroxylated sorosilicates of the epidote group in the SWIR 2 are located at around 2250 nm and 2340 nm, respectively (
Table 2) [
30,
32]. As with all hydroxylated mineral groups, absorption features of epidote in the SWIR 2 represent combinations of fundamental stretching and bending vibrations located in the TIR. Importantly, both SWIR 2 absorption features significantly overlap with commonly co-occurring mineral groups, such as chlorite [
61] and biotite. However, in epidote, the relative intensity of the 2350-nm absorption feature is much stronger than the relative intensity of the absorption in the 2250-nm wavelength region, when compared to chlorite. In addition, the wavelength position of the absorption feature in the 2250-nm wavelength region is at distinctly longer wavelengths when compared to the “longest-wavelength chlorite” (i.e., 2267 nm in epidote versus 2263 nm in chlorite). The longer-wavelength position is due to the fact that, in epidote, Al and Fe
3+ are bonded to OH, whereas in chlorite, Mg and Fe
2+ are the main cations bonded to OH.
Hydroxylated cyclosilicates of the tourmaline series display major absorption at around 2174 nm, 2204 nm, 2256 nm, 2302 nm and 2390 nm (
Table 2) [
49]. Due to the large compositional variations of the tourmaline group, the relative intensity and wavelength position of these absorptions can differ considerably between different tourmaline mineral species. Bierwirth [
62] reported a distinct correlation between the absorption feature at 2359 nm, which shifted to 2375 nm as the MgO wt.% decreased from 11% to 0%. Importantly, this wavelength shift can be detected in hyperspectral remote sensing imagery and be used for exploring for base and precious metal ore deposits [
62].
Another major mineral group that contains hydroxyl groups and subsequently displays major absorption features in the SWIR 2 comprises hydroxyl-bearing sulphates. Alunite is characterised by a broad absorption feature at around 2160 nm [
35], which overlaps with absorptions arising from kaolin and pyrophyllite. Jarosite shows strong hydroxyl-related combination bands at ~2212 nm and 2263 nm [
35], which overlap with the absorption features of di-octahedral and tri-octahedral sheet silicates, respectively. Gypsum shows strong absorption features at around 2170 nm, 2220 nm, 2280 nm and 2430 nm [
46]. In the transition zone between the SWIR 2 and MIR wavelength ranges, sulphates display medium to strong S-O-related overtones (e.g., jarosite: 2503 nm, 2606 nm, 2623 nm; alunite: 2517 nm) [
35].
Carbonates show several diagnostic absorption features in the SWIR 2, which all show changes in location and shape, mainly depending on the amount of Mg, Fe and Mn replacing Ca. A composition space of major carbonate minerals is shown in
Figure 4. The main diagnostic absorption feature in the SWIR 2 wavelength range that is accessible with commercially available field spectrometers (3ν
3CO
3; for summary, see [
19]) is located between 2300 nm and 2340 nm and shows a characteristic left-hand asymmetry (
Figure 1). This asymmetry points to a secondary, less intense absorption band located on the short-wavelength limb of the same feature, probably centred in the 2230–2275 nm wavelength region. With increasing amounts of Mg and Fe, the 3ν
3CO
3 shifts to shorter wavelengths (
Figure 4) [
19]. The 3ν
3CO
3 feature and its secondary associated feature can be mimicked, for example, by a mineral mixture comprising materials featuring ν + δ[Al,Fe
3+]/[Mg,Fe
2+]
2OH (e.g., di- and trioctahedral phyllosilicates) and ν + δ [Mg,Fe
2+]
3OH (e.g., amphiboles). A second, equally diagnostic absorption feature for carbonates is located beyond the SWIR 2 wavelength range accessible with commercially available field spectrometers but can be detected by means of laboratory and handheld FTIR spectrometers. This carbonate-related absorption can be assigned to 2ν
3+1CO
3 [
19] and shifts from 2541 nm in calcite to 2505 nm in Mg-rich carbonates, synchronously with 3ν
3CO
3. Two more diagnostic absorption features in calcite are located at around 1990 nm (medium intensity) and 1870 nm (weak intensity), respectively. These two absorption features always appear as pairs in carbonates and, though decreasing in intensity with increasing Mg or Fe content, they also display a shift to shorter wavelengths with increasing replacement of Ca by Mg and Fe. Due to their overlap with the major OH/H
2O feature at around 1900 nm, these features can be obliterated but are found to be very useful when the true nature of a left-hand absorption feature in the 2340-nm region is questionable.
2.3. MIR Functional Groups (2600 to 5500 nm)
The MIR wavelength range comprises the fundamental stretching vibrations of O-H bonds (νOH), which occur in hydroxylated mineral groups, such as di- and tri-octahedral sheet silicates (e.g., micas, smectites, kaolin group, chlorite), amphiboles, tourmalines and metal oxides/hydroxides (e.g., gibbsite, goethite). Many absorption bands are possible between 2667 and 5000 nm [
23,
65], although, in most natural samples, νOH is located in between 2675 and 2890 nm (
Table 3). A notable exception is hydroxyl-bearing iron oxides, which absorb between 3113 and 3131 nm [
66]. The number and wavelength position of hydroxyl-related stretching fundamentals depend on the bond length and the hydrogen bonding that occurs in the respective OH group, which in turn is controlled by its location in the crystal structure and the respective cation environment of the hydroxyl group. For example, kaolin group minerals exhibit four hydroxyl-related stretching environments, three of which are assigned to the outer OH group (ν + δOH
o in
Figure 5) and one to the inner OH group (ν + δOH
i in
Figure 5) [
41]. In the case of amphiboles of the actinolite series, four major absorption bands can be observed [
67]. The wavelength position of these absorption bands is mainly controlled by the Mg/(Mg + Fe). All three cation sites bonded to the hydroxyl group producing the shortest-wavelength absorption band (2723 nm) are occupied by Mg. Cation site occupation for the other three absorption bands at 2733 nm, 2744 nm and 2759 nm is MgMgFe, MgFeFe and FeFeFe, respectively.
O-H stretching vibrations of water molecules (nH-O-H) produce comparatively broad absorption features (i.e., characterised by a large FWHM), which are located between 2732 and 3571 nm [
23,
65,
74]. The water-related broad absorption is typically the strongest absorption feature in the MIR and often overlaps significantly with other hydroxyl groups (νOH;
Table 3). Therefore, a high abundance of molecular water will impact significantly on the ability to resolve the other hydroxyl-related stretching vibrations characteristic of a wide range of minerals. Al-smectites, such as montmorillonite, can incorporate different interlayer cations, impacting on the wavelength position of nH-O-H. With increasing polarising power (charge/radius) of the interlayer cation (i.e., K
+, Na
+, Ca
2+, Mg
2+), the wavelength position of nH-O-H increases from 2946 nm to 2987 nm [
73].
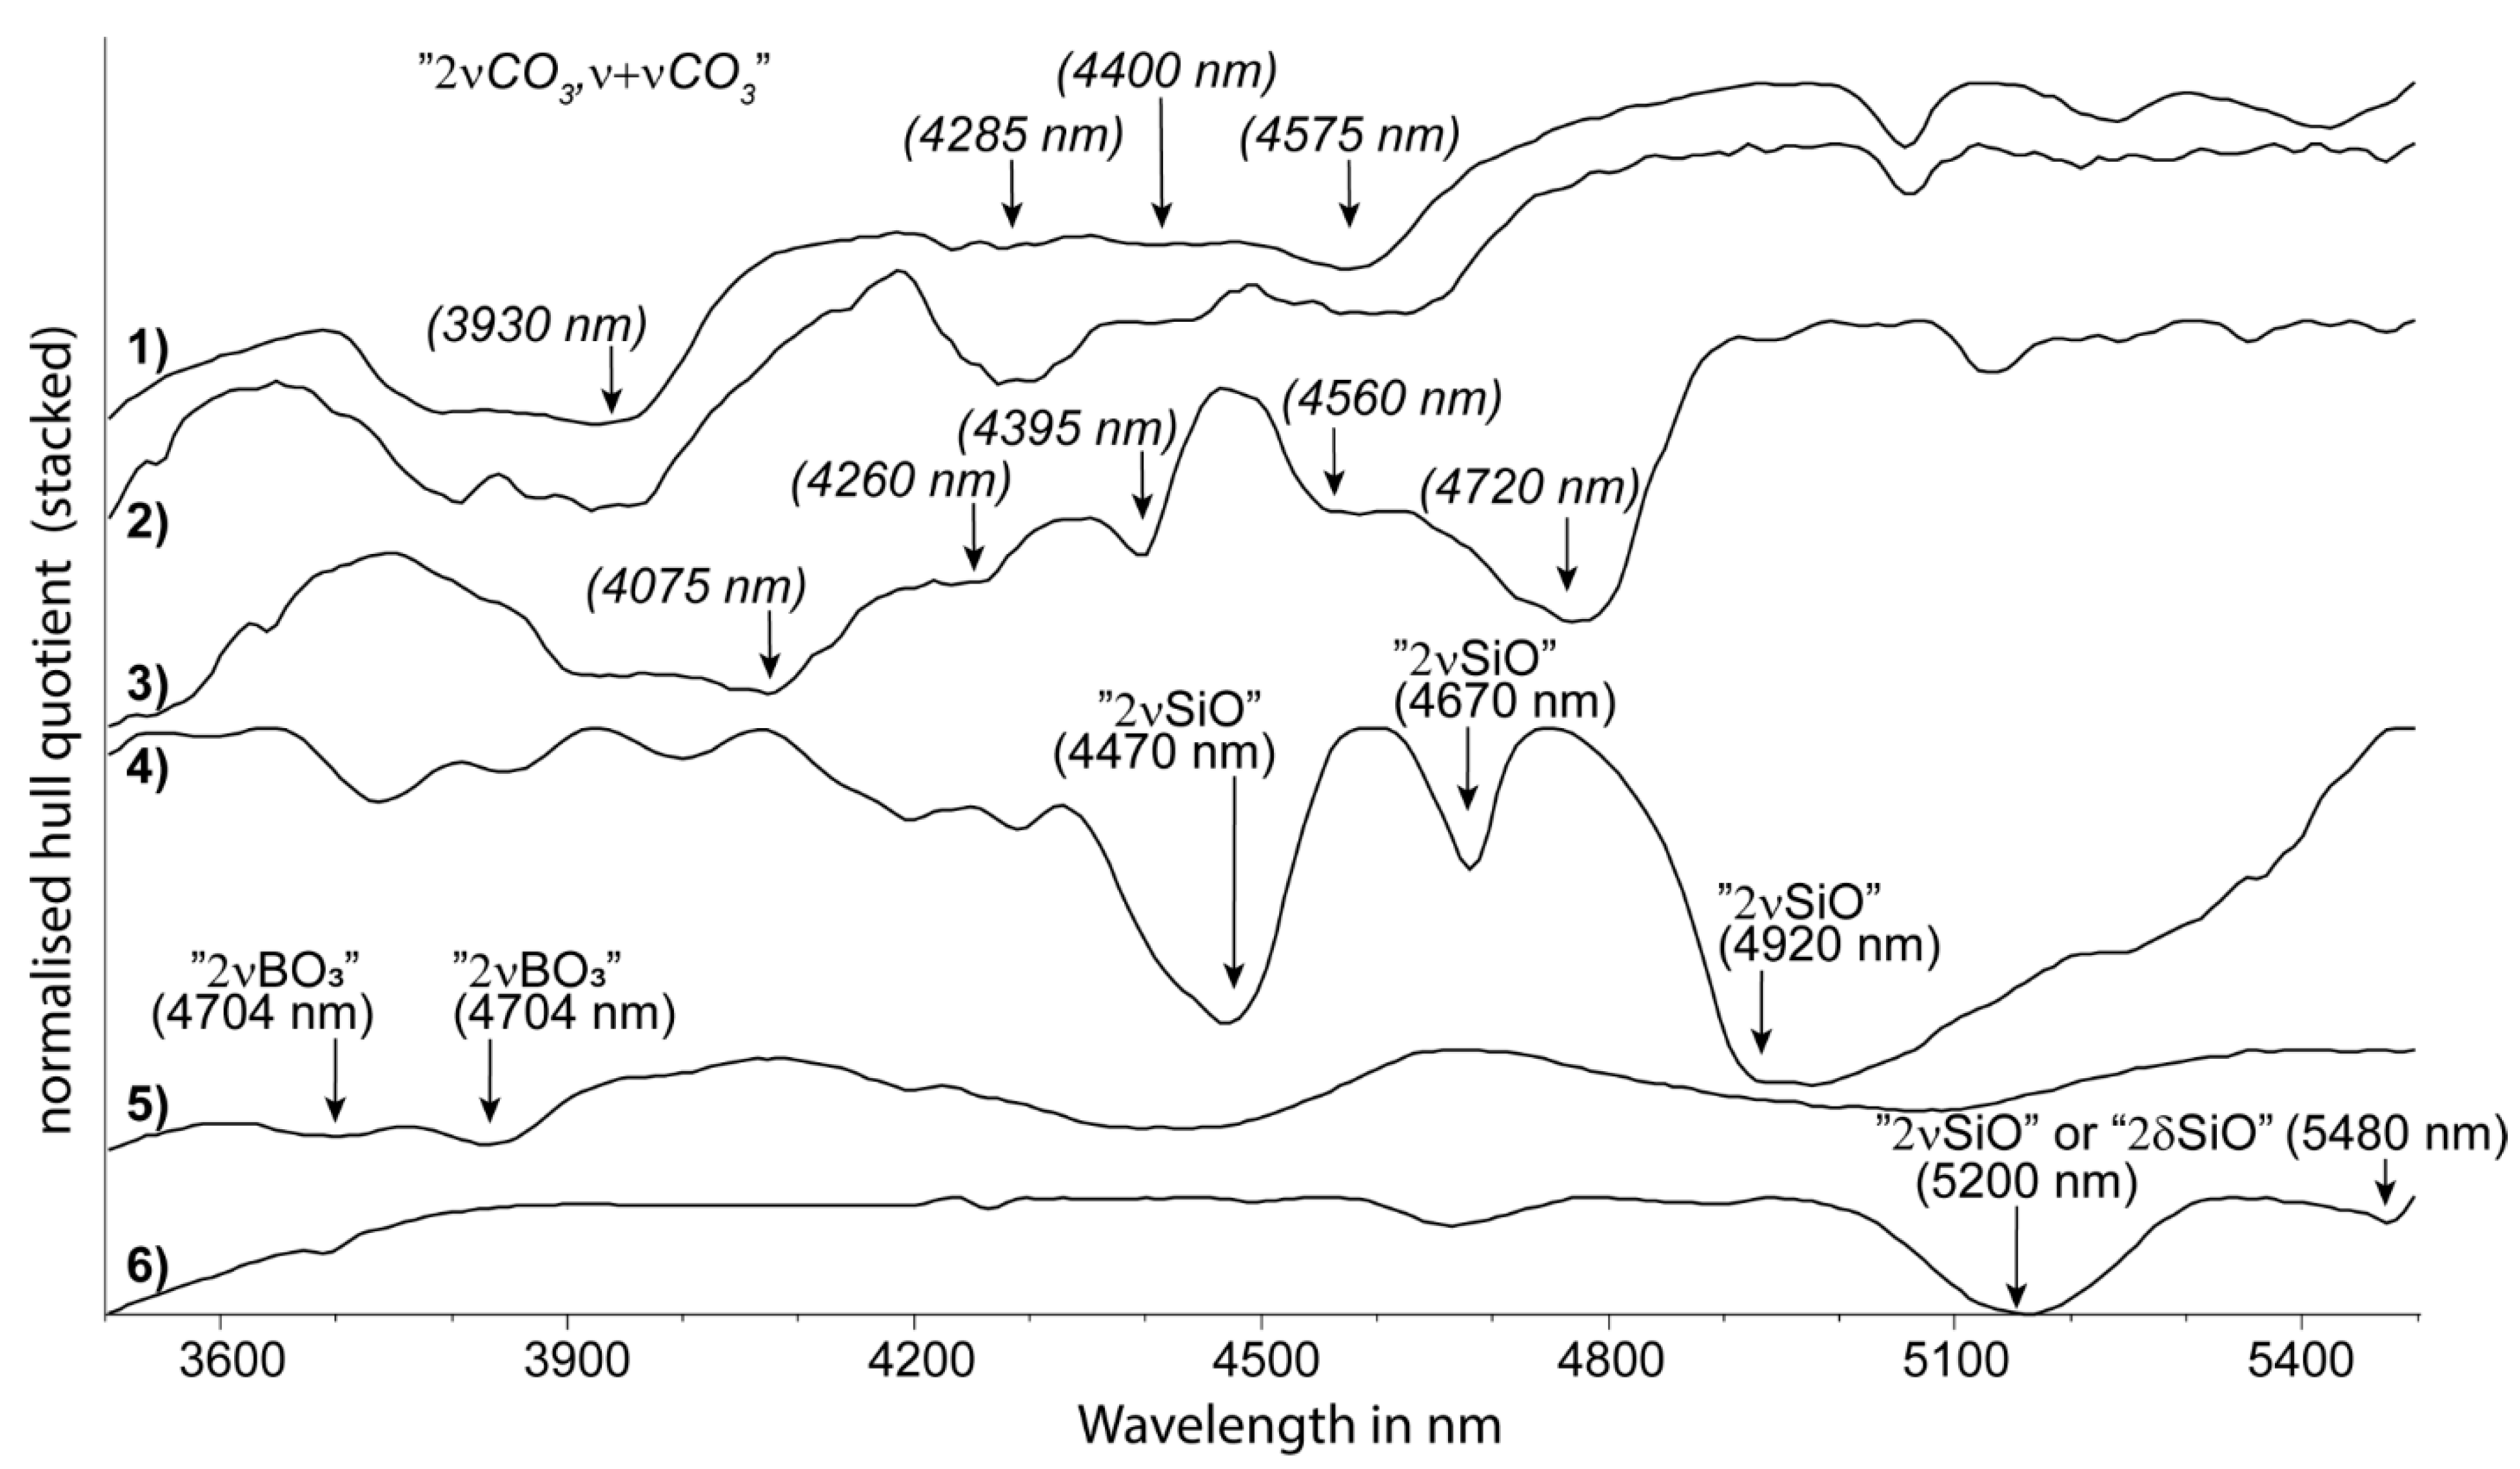
Borosilicates, such as tourmaline, exhibit absorptions at around 3704 nm and 3811 nm (
Table 3;
Figure 6), which have not yet been described in detail in the literature and are tentatively assigned to overtones of the fundamental B-O stretching vibrations (νBO
3). These are in addition to the well-known hydroxyl-related stretching fundamentals of tourmaline in the 2675 nm to 2890 nm wavelength region [
49,
72].
Carbonates are another group of minerals that have absorption bands in the MIR region that are not necessarily attributed to the OH functional group. When carbonates occur in mixtures with di-/tri-octahedral sheet silicates, etc., their recognition and compositional information in the SWIR 2 wavelength region can be easily compromised. Importantly, however, this is less so in the MIR. Several distinct absorption features in the 3300 to 4800 nm wavelength region (
Figure 1) can be observed in the MIR reflectance spectra of carbonates, such as ankerite, calcite, dolomite, magnesite, siderite and witherite. Carbonate-related absorption features are tentatively assigned to the first overtone (2νCO
3) or combinations (ν + νCO
3) of the various CO
3-related stretching fundamentals described by [
76,
77]. The wavelength position of the major overtone at around 3960 nm correlates with compositional changes in the carbonates (
Figure 6). A further benefit of this MIR region for detecting carbonates is that it is less sensitive to very fine grain size effects (clinging fines, etc.) that can distort carbonate peaks in the TIR (described later).
Reflectance spectra between 4000 and 6000 nm are located at the transition from the volume-scattering-dominated wavelength range to the surface-scattering-dominated wavelength range and are heavily impacted by grain size variations [
26]. Overtones and combination bands of fundamental absorptions located in the TIR can be expected in this wavelength range, but related publications are scarce. Yitagescu et al. [
78] reported the MIR wavelength positions of diagnostic absorption features of montmorillonite (~5100 nm, ~5400 nm), illite (~4670 nm, 5560 nm) and kaolinite (~5200 nm, ~5500 nm). Bishop and Murad [
35] described strong absorption features in sulphates (e.g., jarosite) at around 4960 and 5099 nm, which they attributed to 2ν
3(SO
4)
2− and 2δ(OH).
Igisu et al. [
75] reported four absorption features in the 4000 to 6000 nm wavelength range of transmission spectra as “Si-O bonds”. Based on comparison with the fundamental Si-O stretching vibrations (νSi-O), absorptions at 4470 nm, 4670 nm and 4920 nm (
Figure 6) are assigned to first overtones (2νSiO) of the primary quartz reststrahlen bands in the TIR. Kaolin group minerals show three strong absorptions at 5200 nm, 5480 nm and 6100 nm (
Figure 6), which could represent, like quartz, the first overtones of the fundamental Si-O stretching vibrations or first overtones of hydroxyl-related bending fundamentals (δOH). Farmer (1974) [
8] assigned the strong absorption centred at around 6100 nm to overlapping vibrations of structural hydroxyl groups and water molecules. Carbonates display several absorptions in the same wavelength range, which show considerable wavelength shifts depending on the carbonate composition, such as the major absorption at around 4560 nm in magnesite shifting to 4720 nm in witherite (
Figure 6). Phosphates are characterised by absorptions at 4805 nm and 4995 nm, which are tentatively assigned to 2ν
3PO
4.
2.4. TIR Functional Groups (5500 to 15,000 nm)
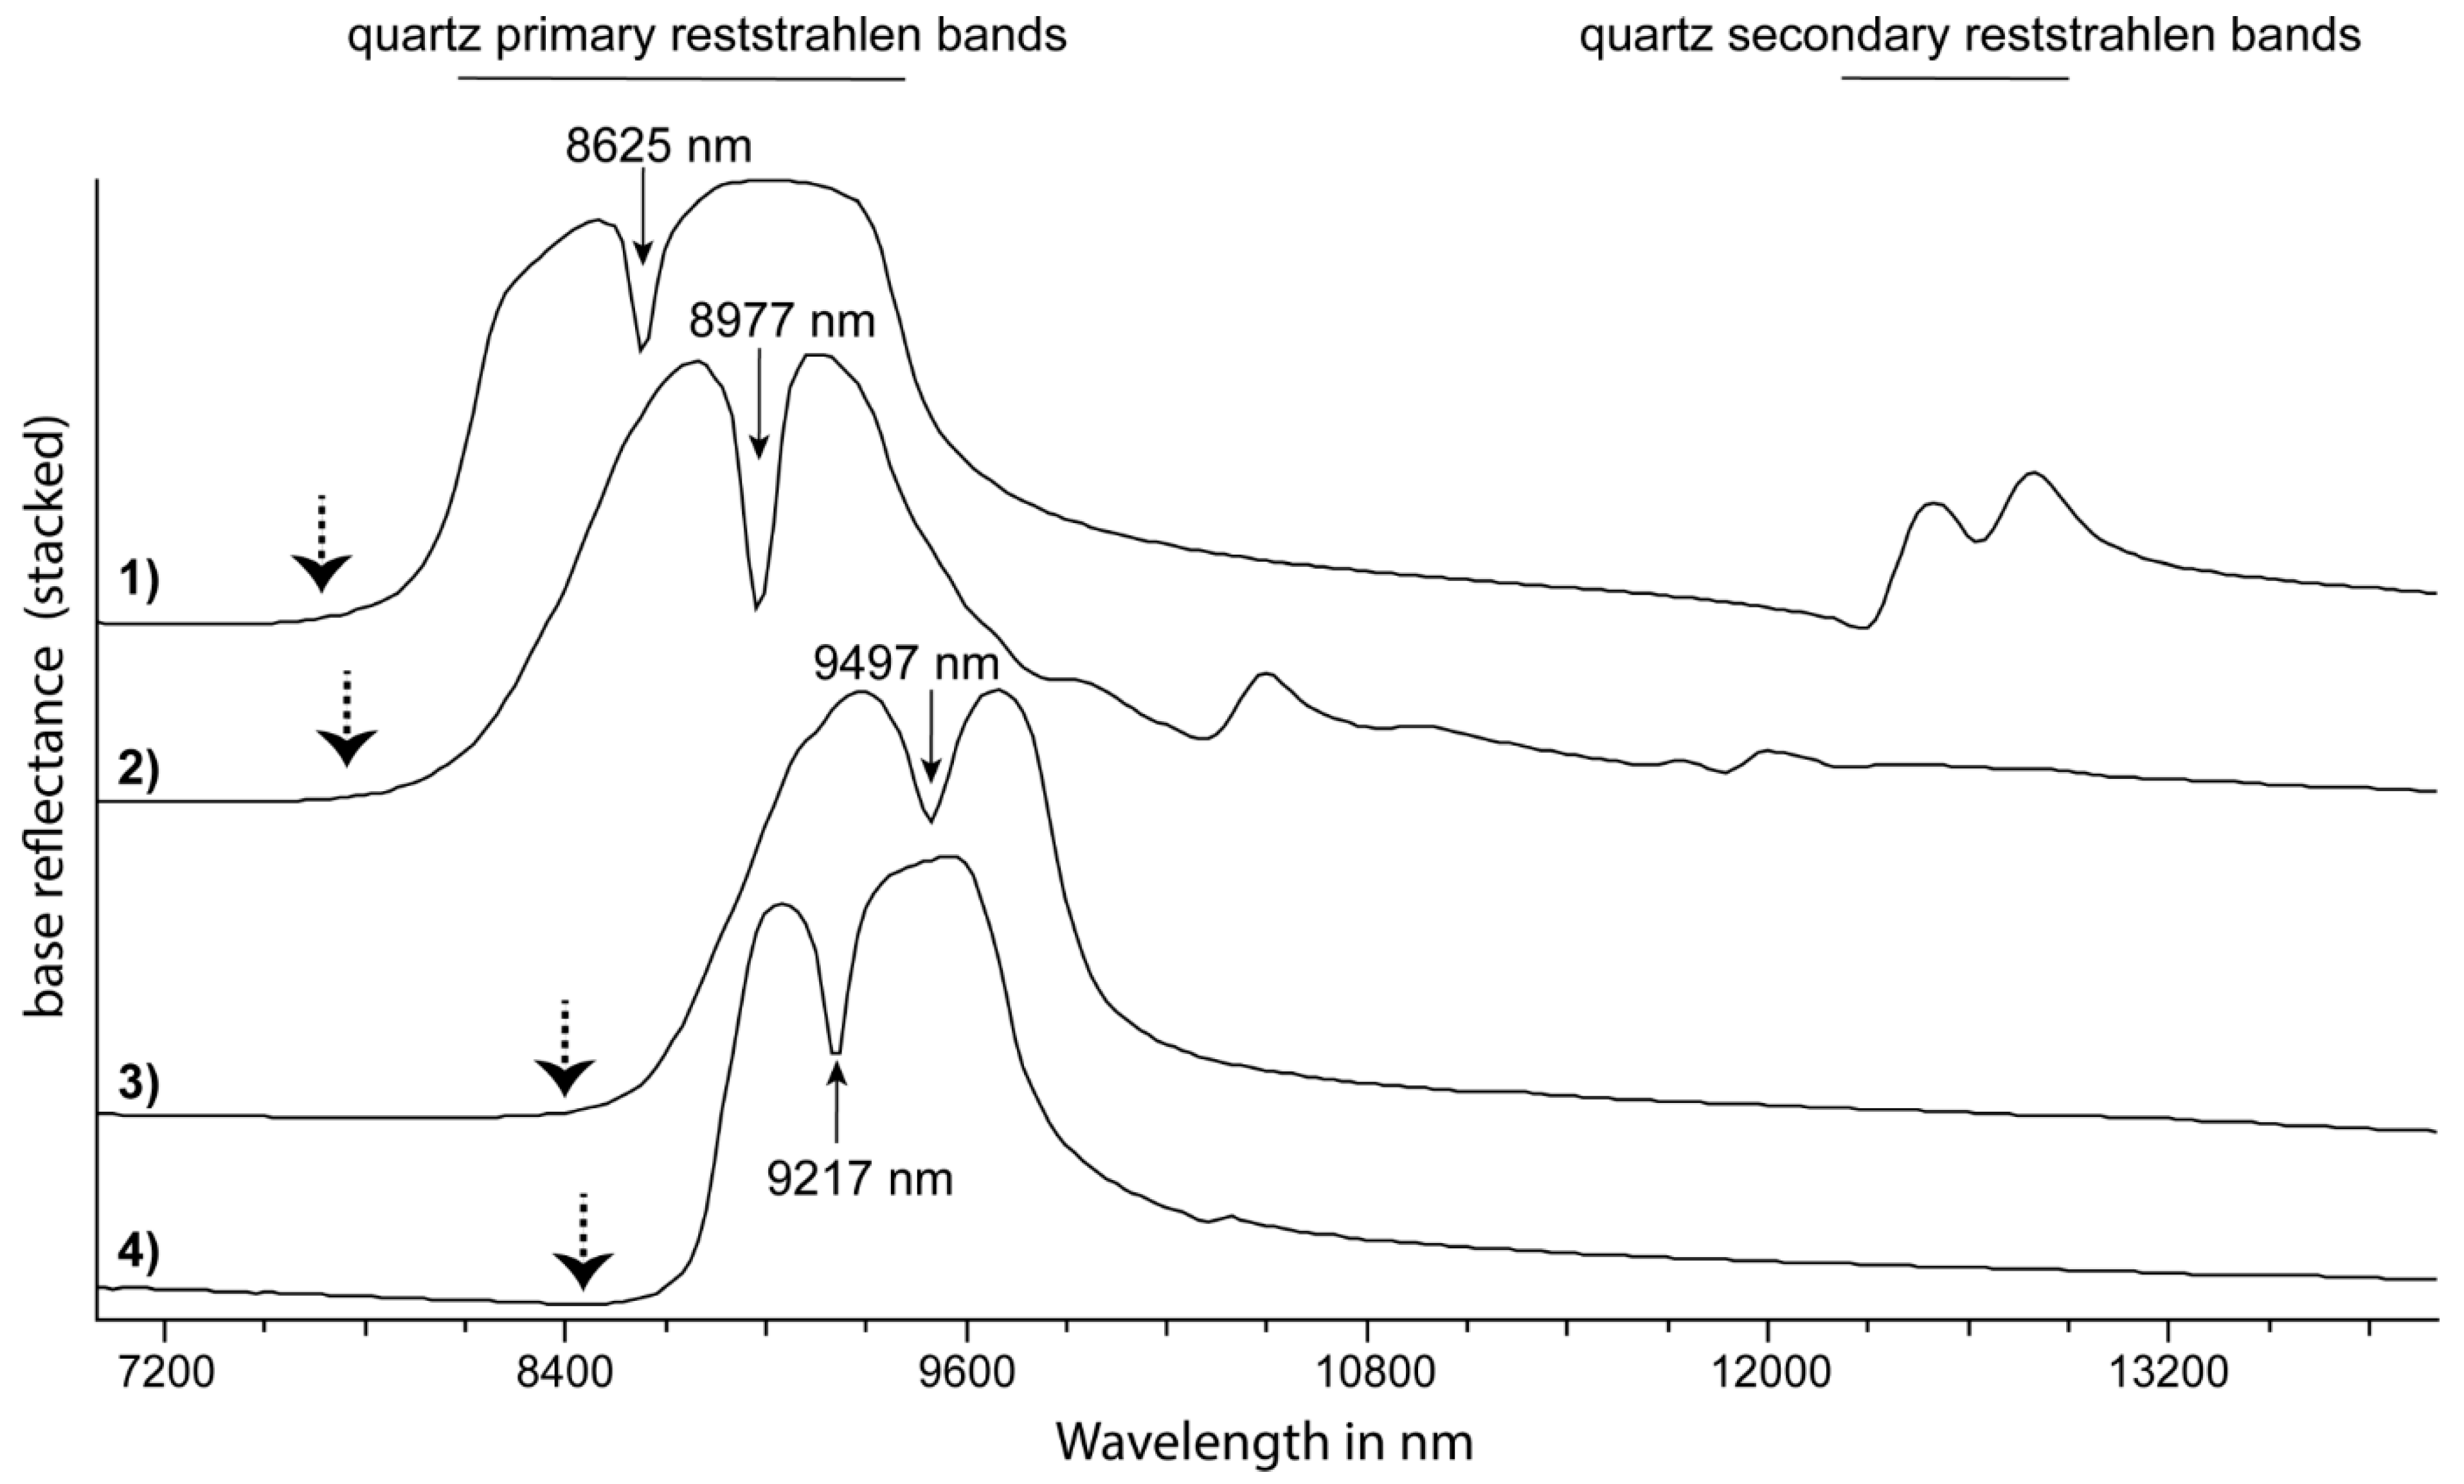
The TIR wavelength region between 5500 and 15,000 nm comprises the largest range of infrared active functional groups. In contrast to the SWIR and MIR wavelength regions in which the volume component of reflection (RV) prevails, specular reflection (RS) is the dominant type of reflection that occurs in a large part of the TIR wavelength range. This section briefly summarises the Si-O-related vibrational modes of common minerals, followed by a description of other important TIR-active anion (e.g., BO33−, CO32−, SO42−, PO43−) and hydroxyl-related vibrations. In addition, other features that are not directly due to vibrational modes of minerals but evident in TIR reflectance spectra are discussed. The impact of grain size and porosity on reflectance spectra is discussed further below in a separate section.
The fundamental stretching vibrations of silicates (νSiO; e.g., [
7]) give rise to the most intense features that can be observed in the TIR wavelength region in reflectance spectra (
Table 4). The strongest group of reflection peaks (also called reststrahlen bands, [
79]) can produce a relatively “simple”, M-shaped signature in the reflectance spectra of less physicochemically complex silicates, such as quartz. These primary reststrahlen bands of quartz are located at 8150 nm, 8600 nm and 9330 nm (
Figure 7; [
80]). A corresponding group of less intense fundamental stretching vibrations (i.e., secondary reststrahlen bands) of quartz are located at around 12,550 nm (
Figure 7; [
80]). However, silicates such as feldspars comprise a wide range of possible chemical compositions (i.e., K versus Na versus Ca; c.f. [
81]), structural variations (monoclinic versus triclinic) or polymorphs (i.e., feldspars with a “high” structural state and disordered Al:Si distribution versus feldspars of “low” structural state and ordered Al:Si distribution). These silicates display a wide range of “shapes” in reflectance spectral signatures, characterised by different relative intensities of the reflectance peaks. As the ratio of Si to O decreases (such as from quartz to feldspars to sheet silicates to chain silicates to orthosilicates), the wavelength position of the reststrahlen band shifts to longer wavelengths [
82,
83]. This systematic change has led to the development of the felsic–mafic index, which is frequently used to map different rock types in planetary spectroscopy [
84] and drill core reflectance spectra [
20].
Tourmaline-series minerals (e.g., elbaite, dravite, schorl) contain additional diagnostic features in the 7300 to 8000 nm wavelength range, which are attributed to the borate stretching vibration (νBO) and are located between the major reststrahlen bands of carbonates and quartz at around 6500 nm and 8250 nm, respectively. The peak caused by the B-O bond occurs in a range devoid of any other significant absorption features of rock-forming or alteration minerals, which makes it ideal for detecting tourmaline. Features at around 7391 nm and 7968 nm in schorl are related to the asymmetric stretching fundamental of B-O (ν
asBO
3; [
87]). The major feature at ~7968 nm shows a significant wavelength shift across a range of tourmaline species sampled from different locations (schorl type 1: 7968 nm; schorl type 2: 8097 nm; rubellite: 7782 nm; dravite: 7622 nm; elbaite type 1: 7874 nm; elbaite type 2: 7692 nm; [
87] and references therein).
Carbonate minerals show strong features at around 6500 nm, 11,300 nm and 14,000 nm (
Table 1; e.g., [
7]), which can be assigned to the ν
2 out-of-plane bend, ν
3 asymmetric stretch and ν
4 in-plane bend of the CO
3 anion [
101]. The wavelength position of each of these absorption features depends on the cation bonded to the CO
3 anion [
7]. Green and Schodlok [
76] used the wavelength position of the feature at around 11,300 nm and a trough to the shorter-wavelength side of the 14,000-nm feature to identify the chemical composition of carbonates in drill core hyperspectral reflectance spectra.
Sulphate anions produce a distinct set of features in the TIR, which can be assigned to ν
3SO
4, ν
4SO
4 and ν
1SO
4 [
35,
88,
89]. Three or more features in major sulphates including alunite, anhydrite, barite, gypsum and jarosite are attributed to ν
3SO
4, the majority of which are located between 8400 nm and 9000 nm (
Table 4). The vibrational mode ν
1SO
4 of these minerals is located between 9700 nm and 10,200 nm. Anhydrite shows a characteristic feature at 14,780 nm (ν
4SO
4; [
89]). Bishop and Murad [
35] described a significant wavelength shift in some of the ν
3SO
4 features between sodic and potassic alunite or sodic and potassic jarosite (up to 140 nm and up to 76 nm, respectively). It should be noted that while alunite, jarosite and gypsum can be recognised in the SWIR 1 and SWIR 2 regions, only the TIR region permits the recognition of anhydrite and barite.
Apatite, the most commonly occurring phosphate, is characterised by major features at 9160 nm and 9620 nm [
94] that are both due to the asymmetric stretching of PO
4 (ν
asPO
4;
Table 1). TIR-active vibrational modes of other phosphates, including monazite and xenotime, are described in Clavier et al. [
95]. The PO
43− anion is readily substituted by AsO
43− and VO
43− and the respective absorption features are summarised in Adler (1964) [
94], who also described the shift in the major TIR features to longer wavelengths with occupation of X in XO
43− by P
5+, As
5+ and V
5+ (i.e., with increasing mass and ionic radius of the respective element).
Hydroxyl-related fundamental bending vibrations (δOH), which occur in all hydroxylated minerals, can occur over a large wavelength range between 8000 and 20,000 nm [
23] and are, for this reason, not included in
Table 4. A summary of the wavelength positions of δOH in clay minerals can be found in Madejová and Komadel [
98] and for sulphates in Bishop and Murad [
35]. Often, band assignments of hydroxyl bending fundamentals are discussed controversially in the literature, mainly due to overlaps with Si-O valence vibrations (e.g., for sorosilicates, see [
102]).
In addition to the diagnostic absorption features of the various mineral groups discussed above, other “features” can be used to infer minerals from TIR reflectance spectra. One of these is the Christiansen frequency, which was defined as “the frequency of maximum transmission in air of a powder film of given thickness and particle size distribution” [
103] and corresponds in TIR reflectance spectra to the reflectance minimum at the short-wavelength side of the primary reststrahlen peaks (
Figure 7). Corresponding with the type of silicate and wavelength position of the respective primary reststrahlen bands, the Christiansen frequency shifts can be used in the same way as the earlier described felsic–mafic index to identify different igneous rock types [
84] and mineral groups [
93] and even estimate the SiO2 wt. % [
104].
In the case of fine-grained samples, a broad transparency peak occurs and the wavelength position shifts with the changing mineral composition [
84]. The transparency peak of reflectance spectra acquired from fine-grained quartz is located at around 11,000 nm [
103].
Selected anisotropic minerals, such as quartz, talc and apatite, display an additional characteristic feature in reflectance spectra that separates the primary reststrahlen bands into two regions, producing an “M-shaped” spectral signature. In the transmission spectra of quartz, Spitzer and Kleinmann (1961) [
80] attributed this minimum to the close proximity of “a sharp weak resonance … to a strong resonance at longer wavelength so as to fall within the high reflectivity band of the latter”. In the case of quartz, the absorption band of weak resonance is located at 8598 nm (resonance strength of 4πρ = 0.01, with ρ = oscillator strength) and the absorption band of strong resonance is located at 9328 nm (resonance strength of 4pr = 0.67) (
Figure 7). In drill core reflectance spectra, Cudahy et al. [
85] used the depth of this feature relative to the height of the neighbouring features (i.e., primary reststrahlen bands) to infer the relative abundance of quartz. The same feature can be observed in other anisotropic minerals (
Figure 7) and is labelled Resonance Strength Contrast (RSC) in this study.
Figure 7.
TIR reflectance spectra of (from top to bottom) quartz (1), pyrophyllite (2), talc (3) and apatite (4). Highlighted are the wavelength positions of respective Resonance Strength Contrast (RSC) features in nm as well as the wavelength range of the primary and secondary reststrahlen bands of quartz (the latter indicated by horizontal lines at the top of the figure). The wavelength position of the Christiansen minimum in each of the reflectance spectra is indicated by a dotted arrow. Reflectance spectra are sourced from the CSIRO’s The Spectral Geologist (TSG
TM) software TIR spectral reference library [
93].


 ,
, 


