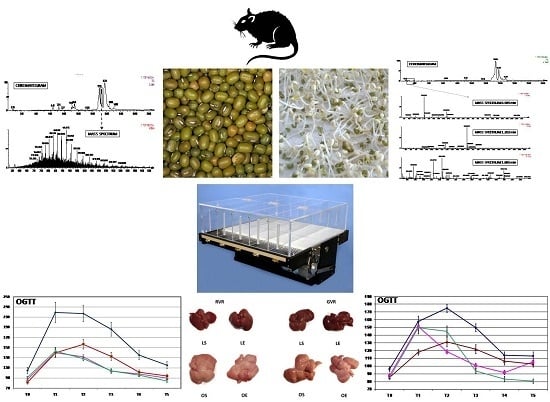
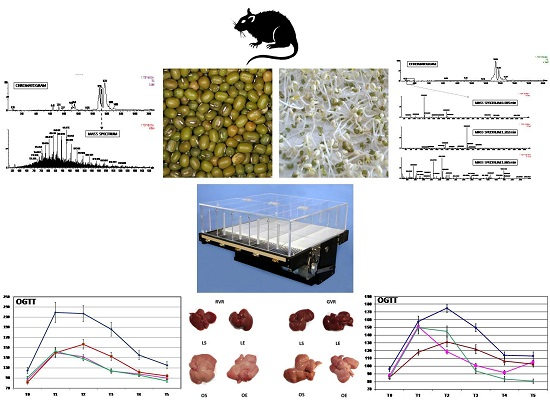
Figure 1.
Detection processes of V. radiata protein digestion by germination process.Band pattern in SDS-PAGE. M, molecular weight markers; 1, raw V. radiata protein extract; 2, 4 day-germinated protein extract. The amount of Kjeldahl-N loaded per lane was 2.0 µg. The figure is representative of 3 independent analyses.
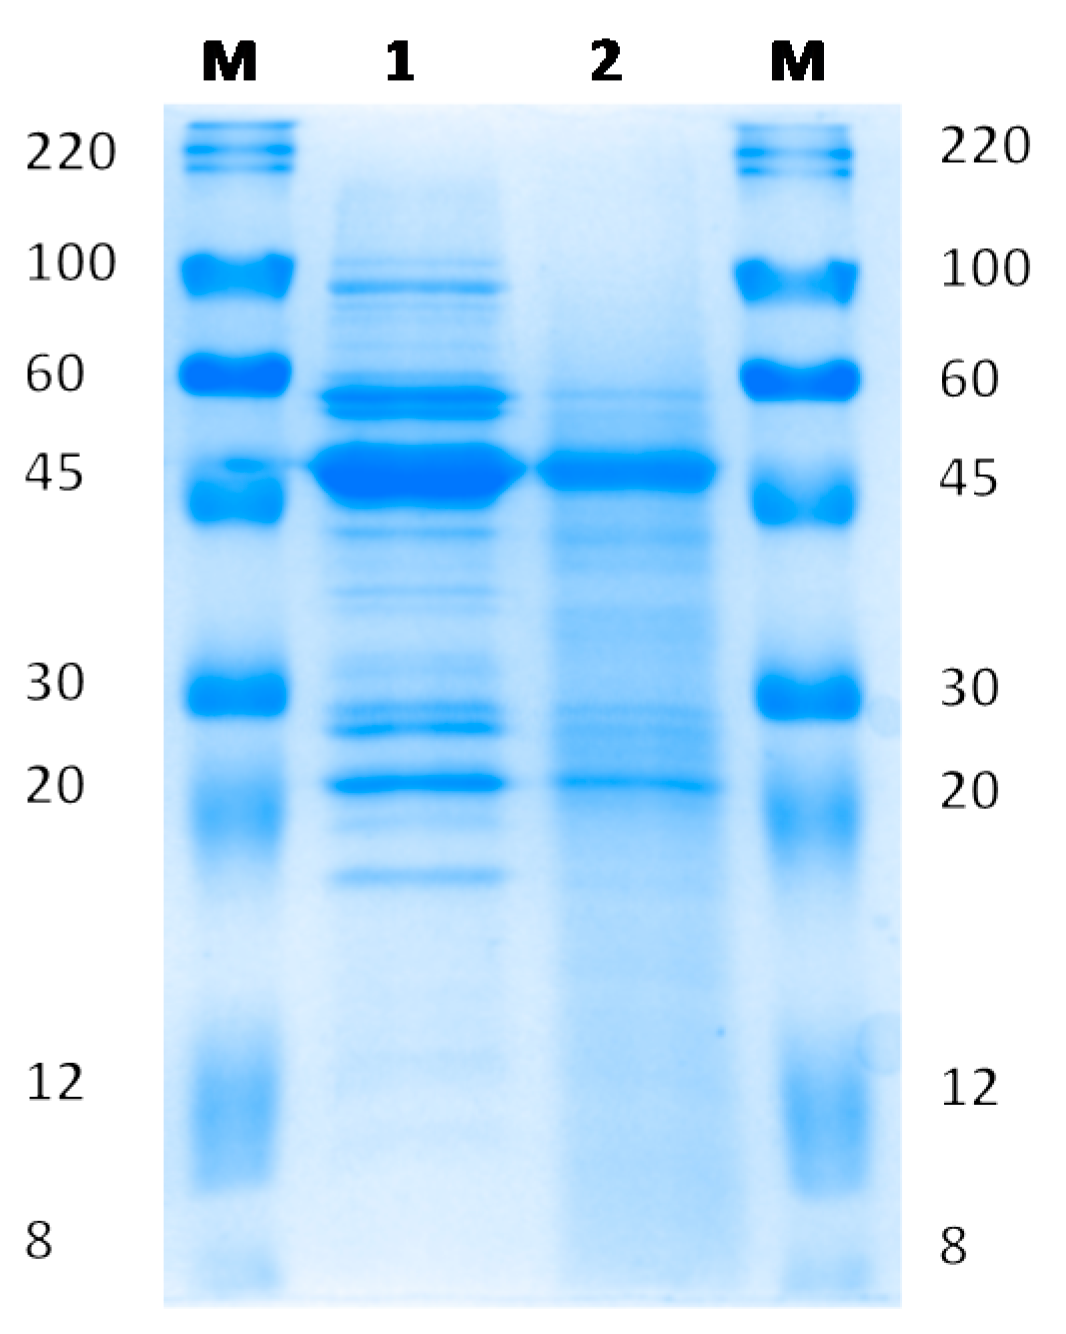
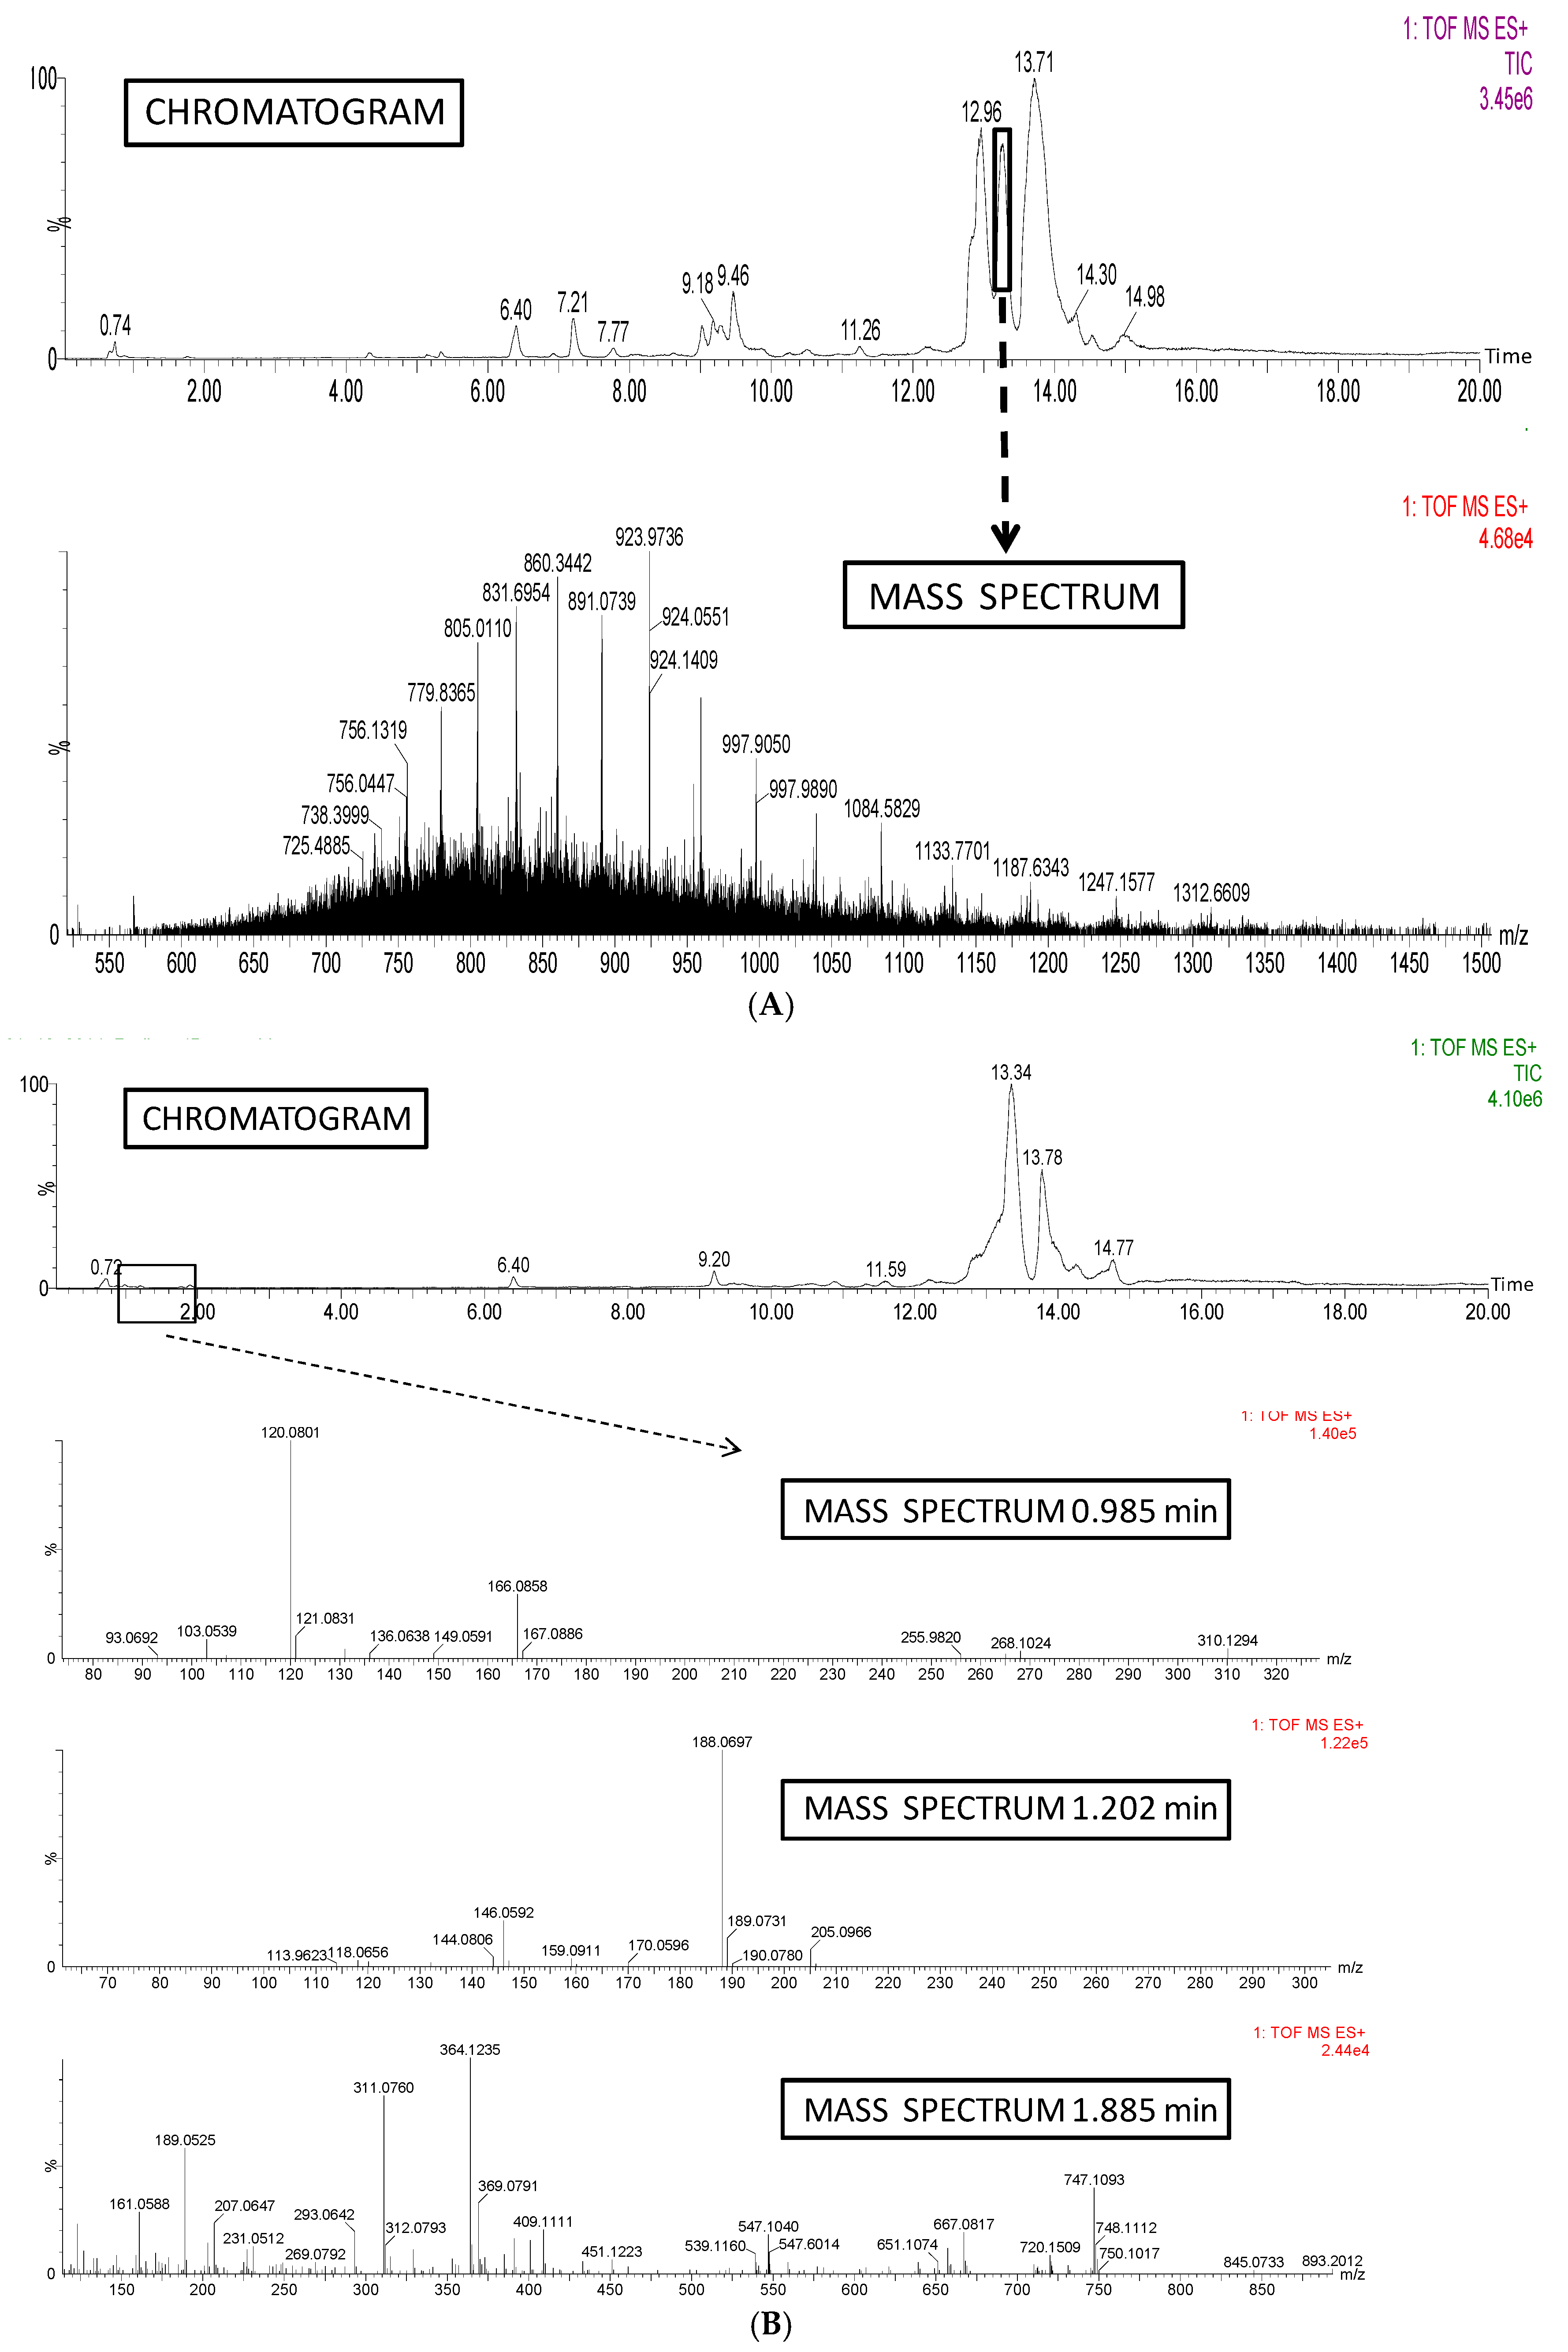
Figure 2.
(A) Chromatogram of raw V. radiata protein and Mass Spectrum of major peak (13.270 min) of chromatogram; (B) Chromatogram of 4 day-germinated V. radiata protein after hydrolysis and Mass Spectrum of hydrolysis-derived peaks (0.985, 1.202, and 1.885 min, respectively) of chromatogram.
Figure 2.
(A) Chromatogram of raw V. radiata protein and Mass Spectrum of major peak (13.270 min) of chromatogram; (B) Chromatogram of 4 day-germinated V. radiata protein after hydrolysis and Mass Spectrum of hydrolysis-derived peaks (0.985, 1.202, and 1.885 min, respectively) of chromatogram.
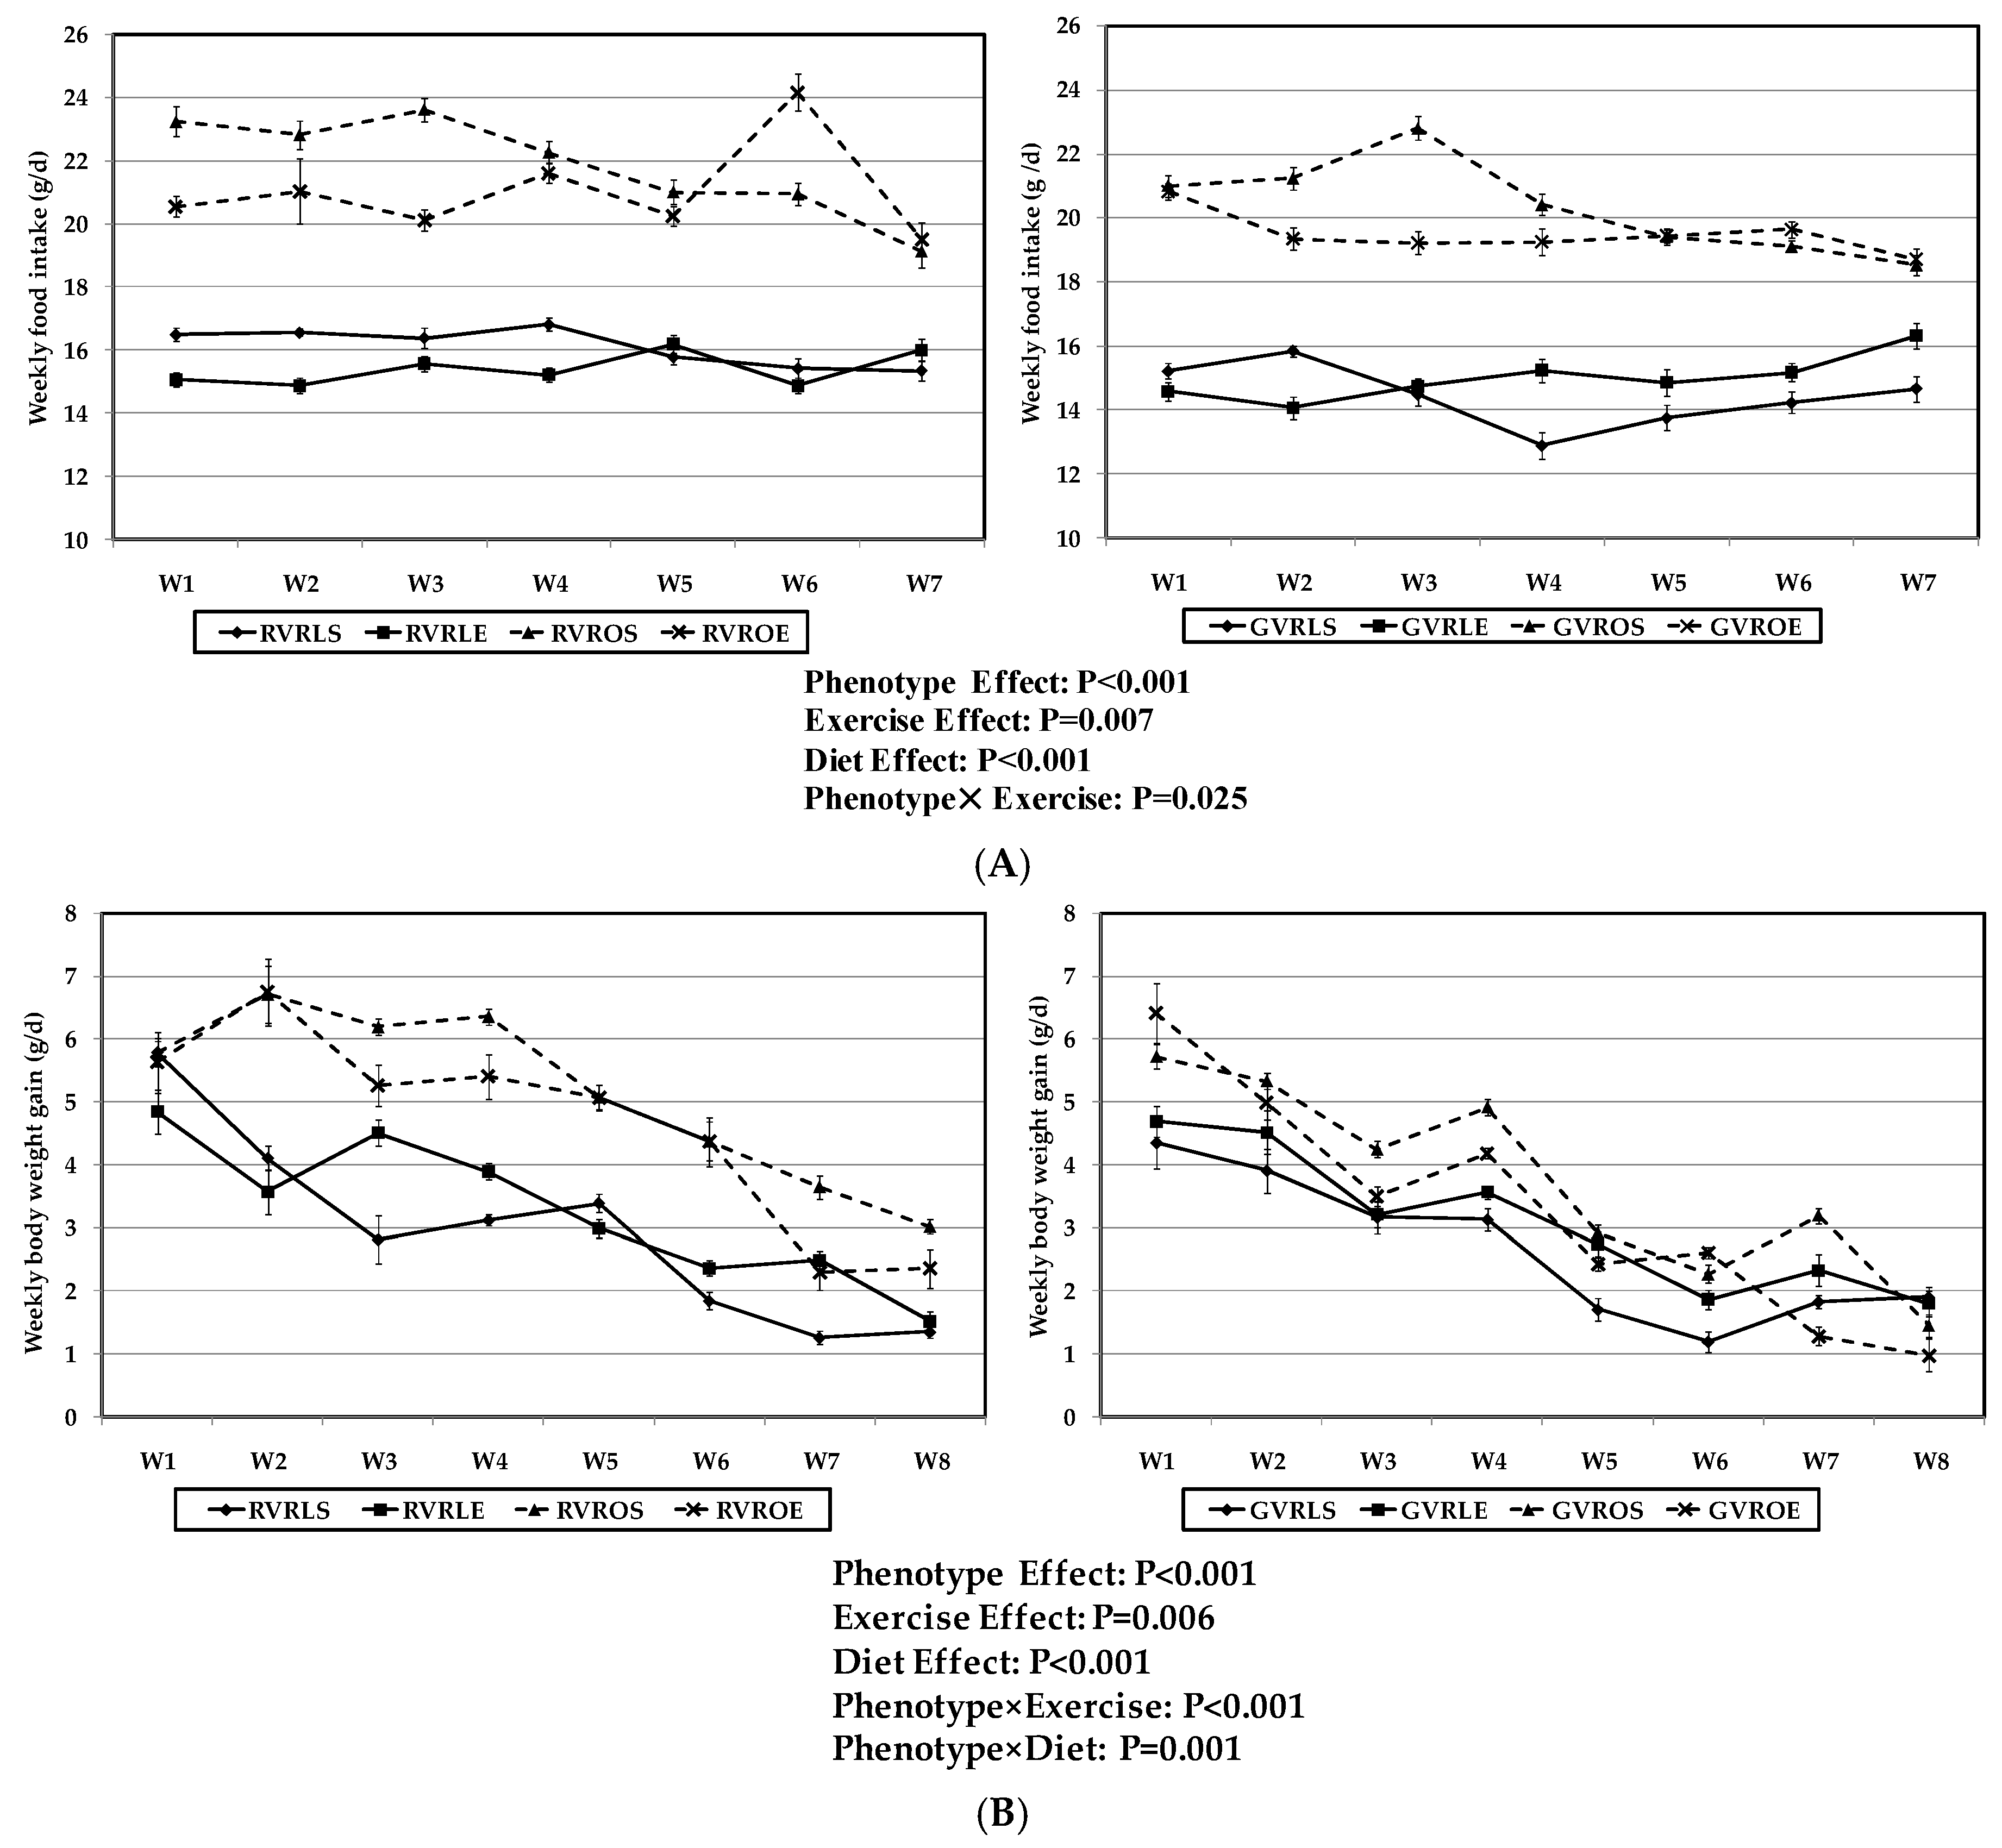
Figure 3.
Effect of dietary treatment with raw or 4 day-germinated V. radiata and aerobic interval training protocol on food intake (A) and body weight gain (B) of lean and obese Zucker rats. (A) Weekly food intake (g DM/day); (B) Weekly body weight gain (g/day). DM, dry matter, RVR, raw V. radiata, GVR, 4 day-germinated V. radiata. Groups: LS, Lean (fa/+) sedentary rats, LE, Lean (fa/+) rats performing aerobic interval exercise, OS, Obese (fa/fa) sedentary rats, OE, Obese (fa/fa) rats performing aerobic interval exercise. W, week. Values are means ± SEM depicted by vertical bars (n = 10).
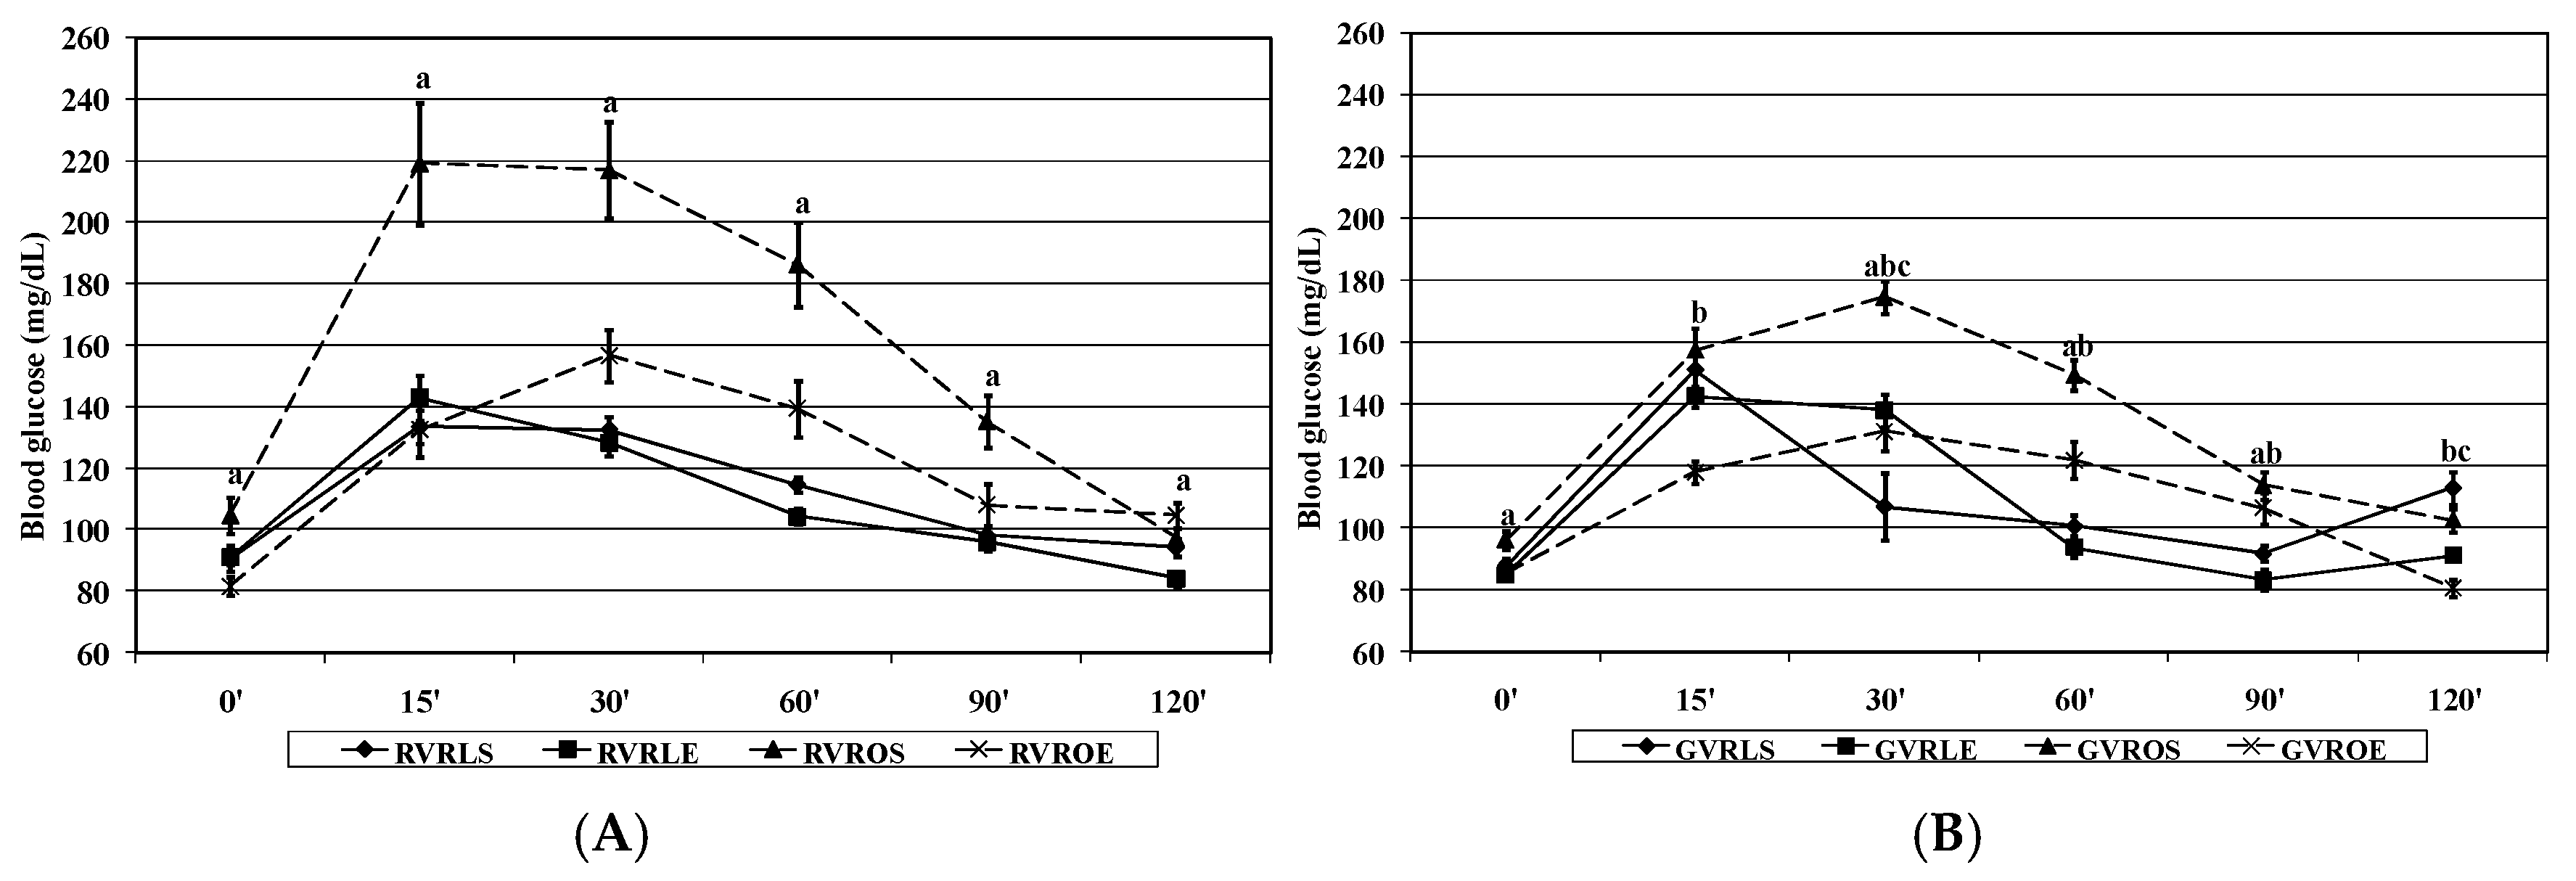
Figure 4.
Effect of dietary treatment with raw or 4 day-germinated V. radiata and aerobic interval training protocol on blood glucose levels of lean and obese Zucker rats prior to or at different time points after oral glucose overload. (A) raw V. radiata (RVR), (B) 4 day-germinated V. radiata (GVR). Groups: LS, Lean (fa/+) sedentary rats, LE, Lean (fa/+) rats performing aerobic interval exercise, OS, Obese (fa/fa) sedentary rats, OE, Obese (fa/fa) rats performing aerobic interval exercise. Values are means ± SEM depicted by vertical bars (n = 10). The following notation is used to express significant differences (p < 0.05) between groups pointed out by Dunnet’s t-test: a, OS vs. LS, b, OE vs. LS, c, LE vs. LS.
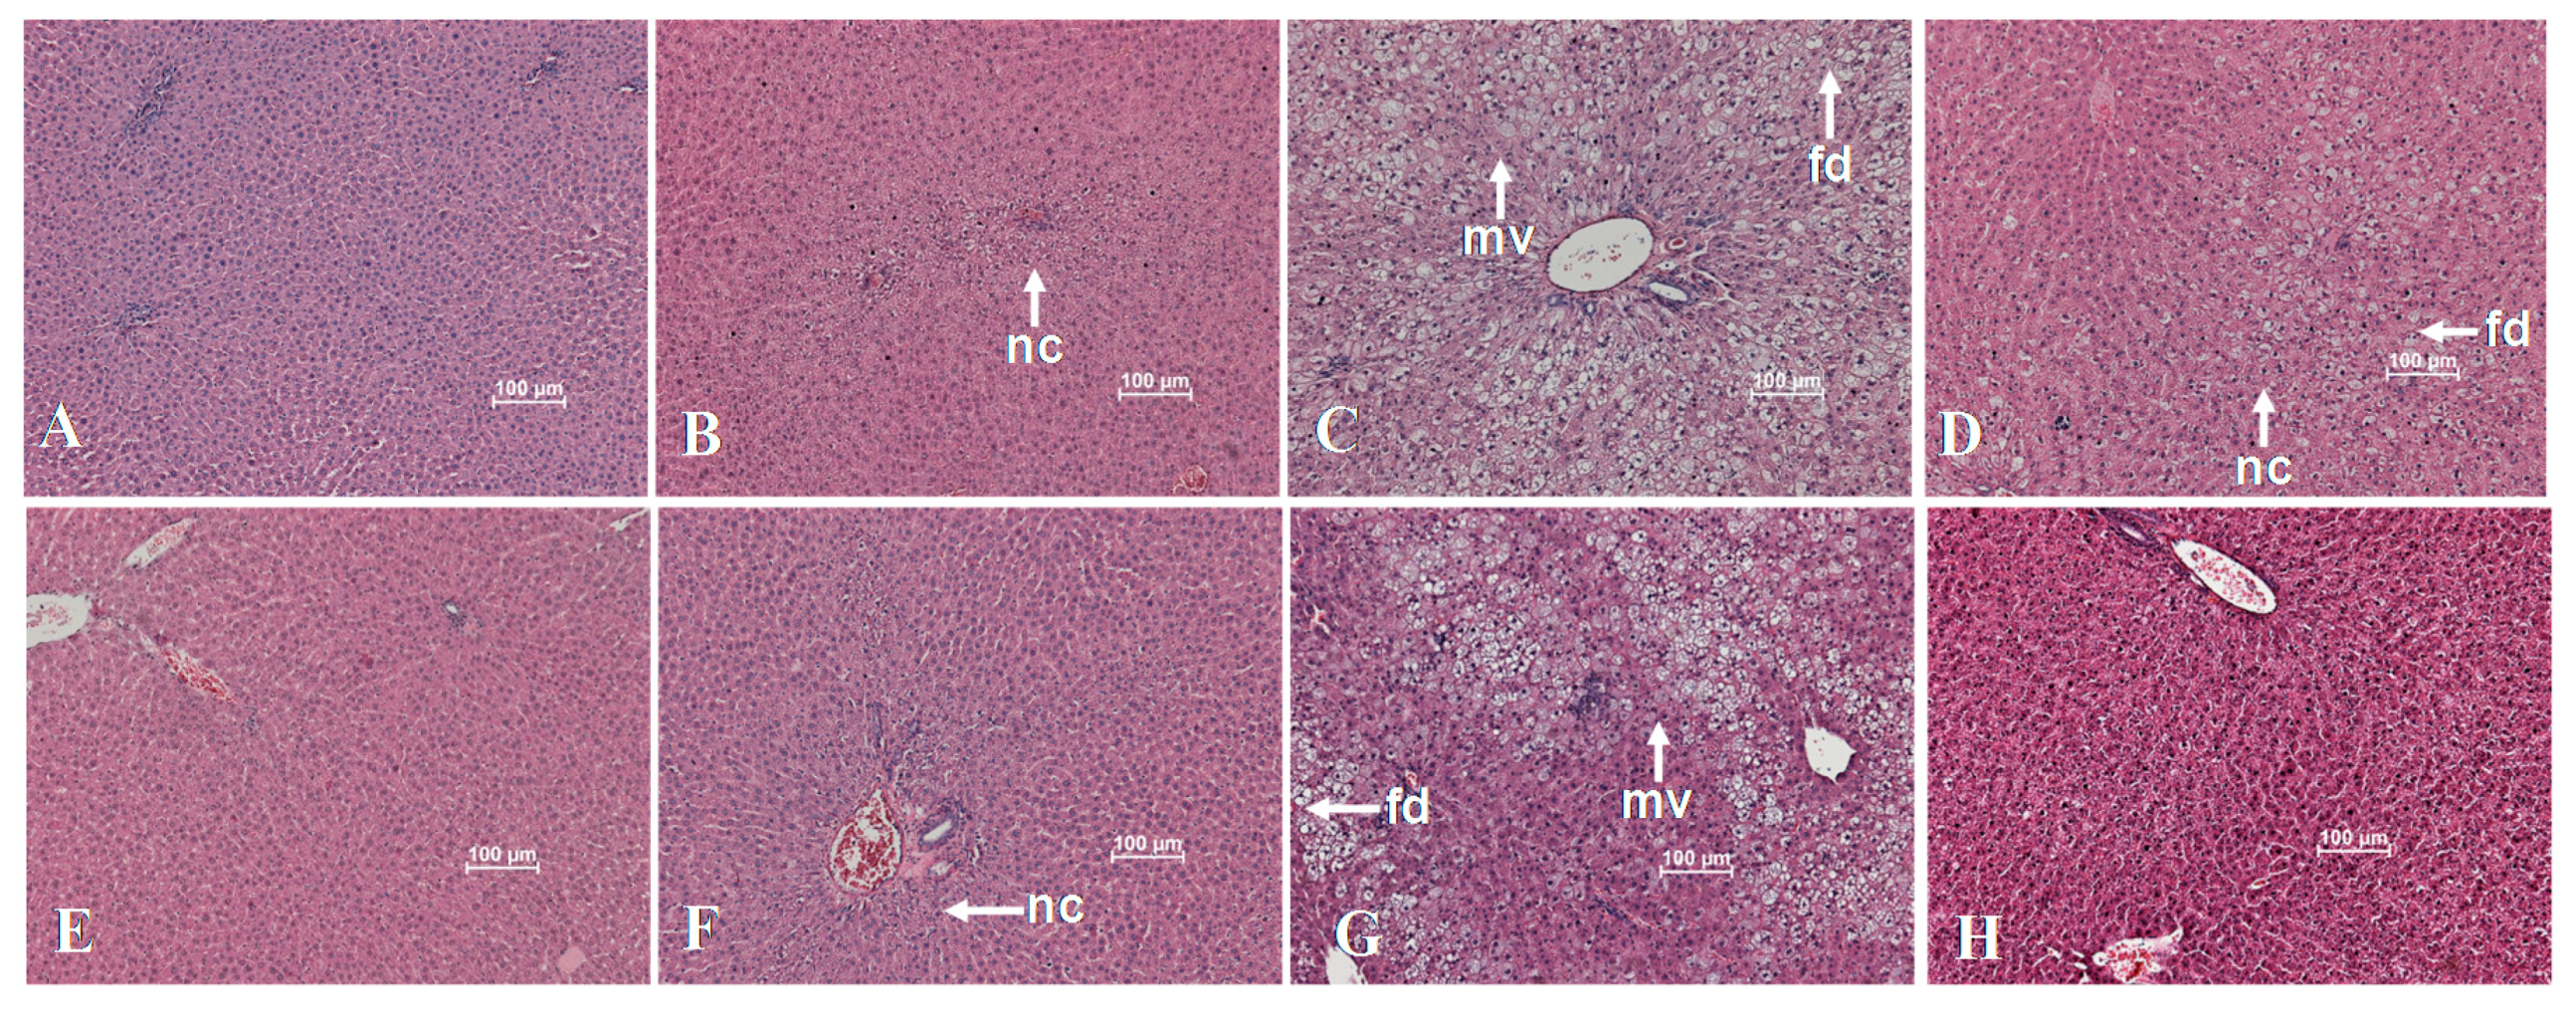
Figure 5.
Effect of dietary treatment with raw or 4 day-germinated V. radiata and AIT protocol on liver histology (hematoxylin-eosin stain) of lean and obese Zucker rats. (A) RVR-LS, (B) RVR-LE, (C) RVR-OS, (D) RVR-OE, (E) GVR-LS, (F) GVR-LE, (G) GVR-OS, (H) GVR-OE. RVR, raw V. radiata, GVR, 4 day-germinated V. radiata. Groups: LS, Lean (fa/+) sedentary rats, LE, Lean (fa/+) rats performing aerobic interval exercise, OS, Obese (fa/fa) sedentary rats, OE, Obese (fa/fa) rats performing aerobic interval exercise. Photographs are representative of livers of 10 different rats for each experimental group. nc, necrosis, mv, microvesicular steatosis, fd, fatty droplet accumulation.
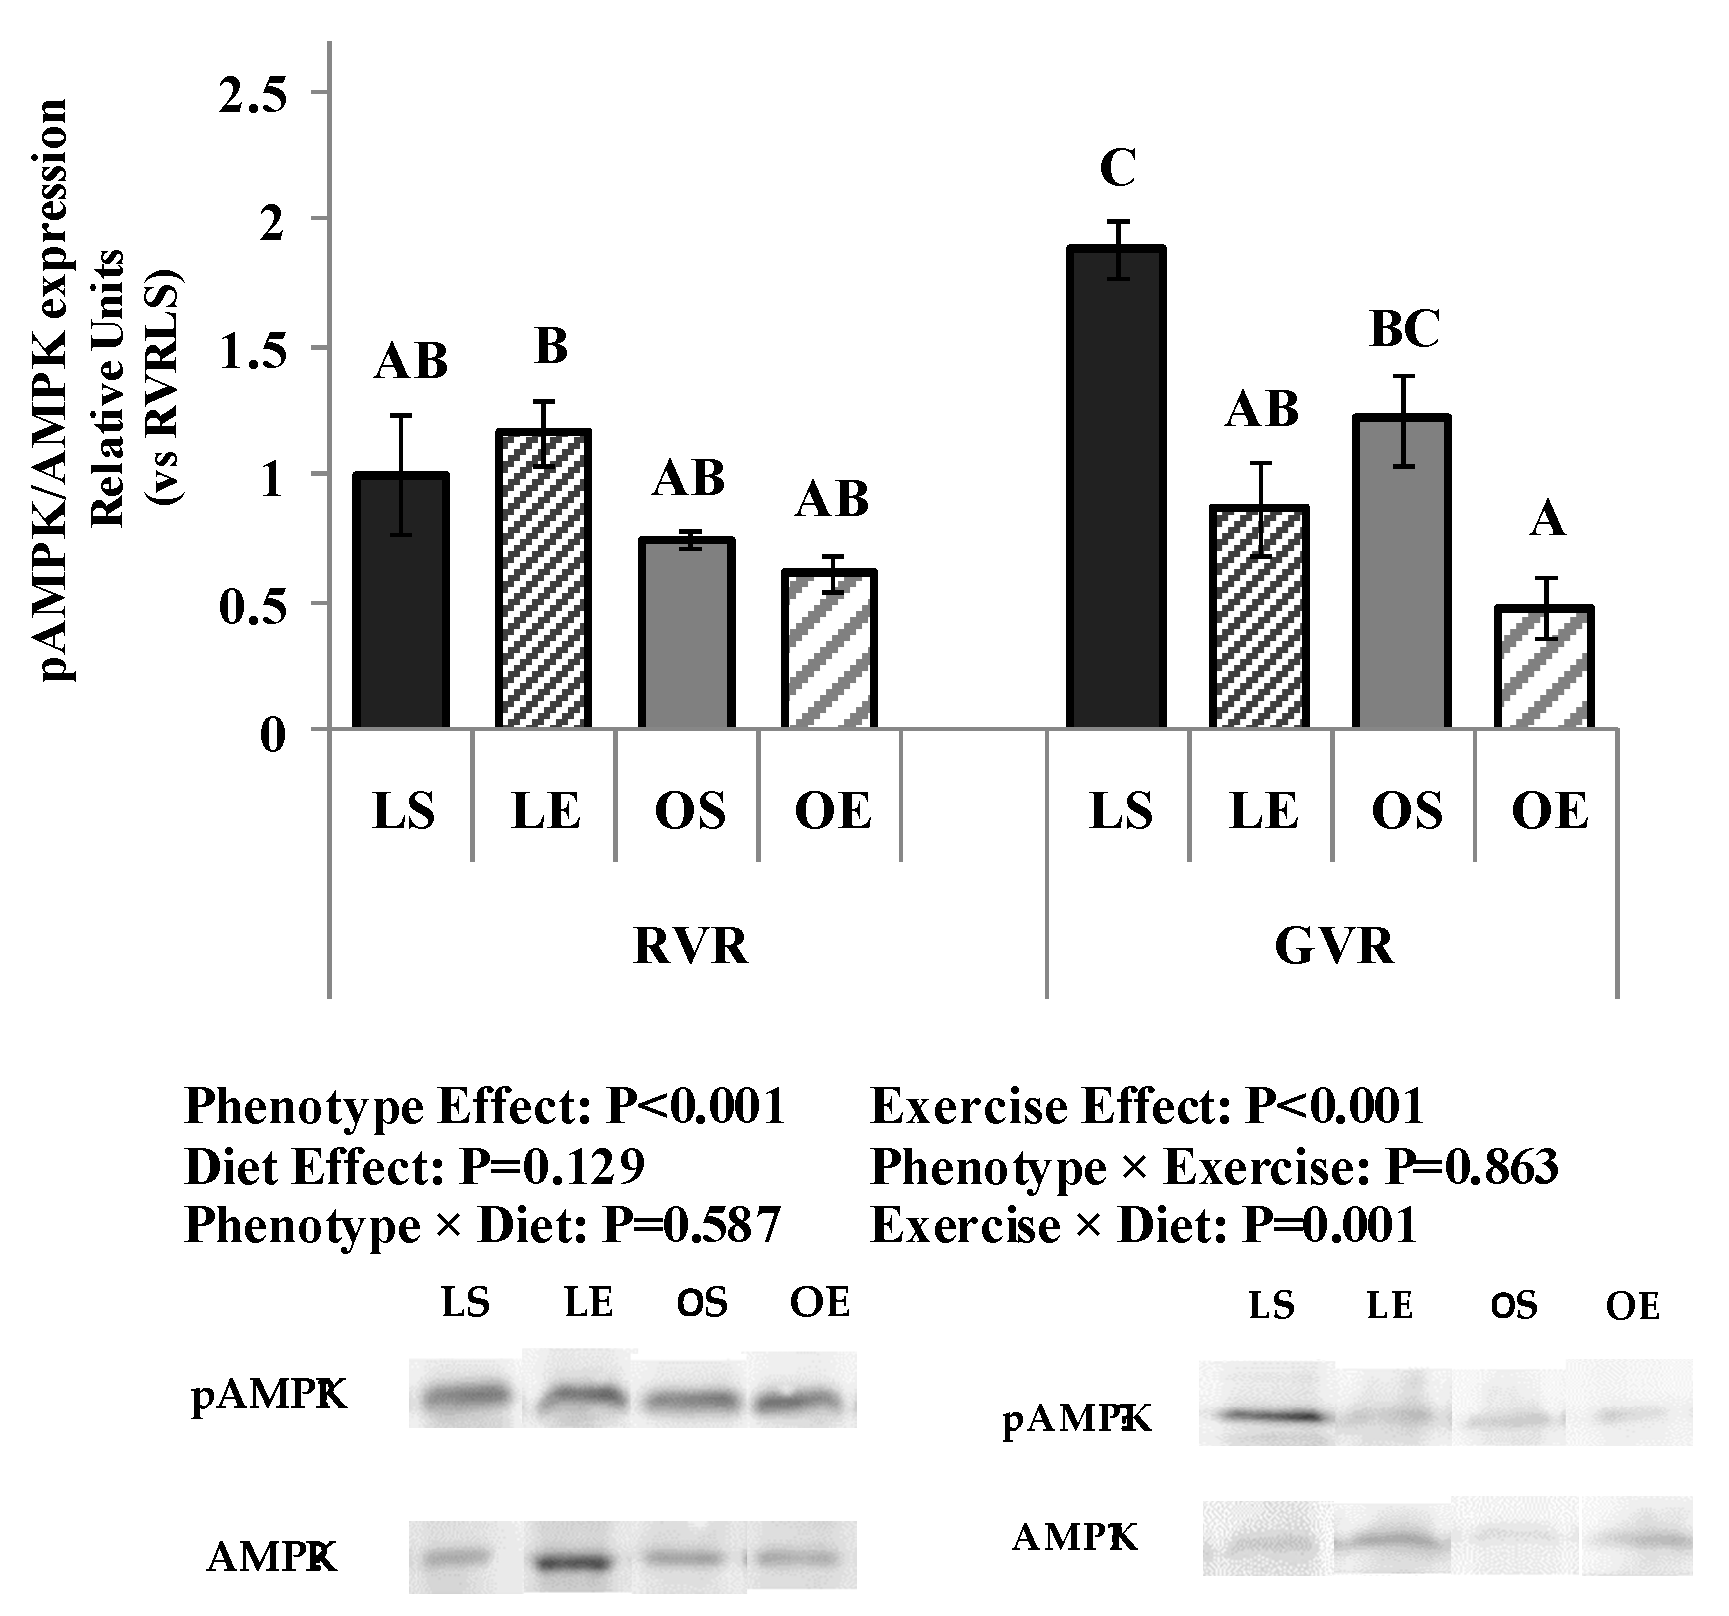
Figure 6.
Effect of dietary treatment with raw or 4 day-germinated V. radiata and aerobic interval training protocol on AMPKα/pAMPKα protein expression in the liver of lean and obese Zucker rats measured by Western blot analysis. AMPK, 5′-AMP-activated protein kinase; phosphorylated-AMPK, pAMPK. RVR, raw V. radiata, GVR, 4 day-germinated V. radiata. Groups: LS, Lean (fa/+) sedentary rats, LE, Lean (fa/+) rats performing aerobic interval exercise, OS, Obese (fa/fa) sedentary rats, OE, Obese (fa/fa) rats performing aerobic interval exercise. Immunoblots are representative of liver homogenates of eight different rats for each experimental group; all samples were derived at the same time and processed in parallel. The amount of sample loaded per lane was 100 µg of protein. Levels of pAMPK were normalized to the total AMPK. Densitometric analysis values represented in the graphs are means ± SEM depicted by vertical bars (n = 8). Means without a common letter differ, p < 0.05.
Table 1.
Composition of raw and 4 day-germinated V. radiata flours and experimental diet formulation.
Table 1.
Composition of raw and 4 day-germinated V. radiata flours and experimental diet formulation.
| V. radiata Flour | RVR | GVR |
| Moisture (g/kg) | 83.0 | 88.4 |
| Total N (g/kg DM) | 34.4 | 42.0 |
| Insoluble N (%) | 12.9 | 9.4 |
| Soluble Protein N (%) | 81.6 | 50.9 |
| Soluble Non Protein N (%) | 5.5 | 39.7 |
| Total fat (g/Kg) | 17.0 | 14.6 |
| Ash (g/kg DM) | 37.1 | 43.4 |
| Diet Formulation (g/kg) | RVR | GVR |
| Raw V. radiata | 367 | - |
| Germinated V. radiata | - | 333 |
| Whey Protein | 56 | 56 |
| Sucrose | 100 | 100 |
| Cellulose | 11 | 21 |
| Methionine | 5 | 5 |
| Sunflower Oil | 40 | 40 |
| Mineral premix | 35 | 35 |
| Vitamin premix | 10 | 10 |
| Choline bitartrate | 2.5 | 2.5 |
| Starch | 427 | 411 |
Table 2.
Details of the aerobic interval training (AIT) protocol.
Table 2.
Details of the aerobic interval training (AIT) protocol.
| Week (5 Days/Week) | Work Time (min/Day) | % VO2 max |
|---|
| 1 | 45′ | 50%→3 min |
| 65%→4 min |
| 2 | 50′ | 55%→3 min |
| 70%→4 min |
| 3 | 50′ | 60%→3 min |
| 75%→4 min |
| 4 | 55′ | 60%→3 min |
| 75%→4 min |
| 5–8 | 60′ | 65%→3 min |
| 80%→4 min |
Table 3.
Effect of diet, phenotype, and aerobic interval training protocol on aerobic capacity, physical performance and related hematic parameters of Zucker rats.
Table 3.
Effect of diet, phenotype, and aerobic interval training protocol on aerobic capacity, physical performance and related hematic parameters of Zucker rats.
| | RVR | GVR | R2 | Phenotype Effect | Diet Effect | Exercise Effect | Phenotype× Diet | Phenotype × Exercise | Exercise × Diet |
|---|
| Lean | Obese | Lean | Obese |
|---|
| SED | EXC | SED | EXC | SED | EXC | SED | EXC |
|---|
| Lactate (mmol/L) | 6.65A (0.44) | 5.07A (0.68) | 13.62C (0.68) | 10.21B (0.57) | 7.53A (0.38) | 6.91A (0.56) | 13.94C (0.74) | 10.08B (0.69) | 0.769 | p < 0.001 | p = 0.077 | p < 0.001 | p = 0.121 | p = 0.002 | p = 0.744 |
| VO2max (mL/min/kg0.75) | 18.5A (1.25) | 25.4E (0.85) | 21.4BCD (0.15) | 22.2CD (0.28) | 19.1AB (0.69) | 25.9E (0.38) | 20.6ABC (0.38) | 23.4CD (0.70) | 0.668 | p = 0.440 | p = 0.469 | p < 0.001 | p = 0.654 | p < 0.001 | p = 0.277 |
| Running Time (min) | 12.5A (0.82) | 21.3D (0.77) | 9.51A (0.52) | 13.9BC (1.05) | 14.2BC (0.36) | 27.1E (0.91) | 8.75A (0.35) | 16.3C (0.51) | 0.915 | p < 0.001 | p < 0.001 | p < 0.001 | p = 0.001 | p < 0.001 | p < 0.001 |
| Maximal Speed (cm/s) | 53.8B (2.43) | 81.6D (2.49) | 41.5A(1.56) | 51.4B (3.24) | 57.8BC (1.02) | 96.0E (2.81) | 41.2A (0.92) | 63.4C (1.50) | 0.908 | p < 0.001 | p < 0.001 | p < 0.001 | p = 0.195 | p < 0.001 | p < 0.001 |
| Distance (cm) | 28,434B (2459) | 65,985D (3928) | 17,260A (1352) | 29,931BC (3437) | 32,675BC (2749) | 94,789E (4190) | 16,593A (635) | 39,616C (1917) | 0.931 | p < 0.001 | p < 0.001 | p < 0.001 | p < 0.001 | p < 0.001 | p < 0.001 |
| RBC (×106/μL) | 8.77A (0.09) | 9.57AB (0.34) | 9.29AB (0.31) | 9.42AB (0.44) | 9.16AB (0.09) | 9.98B (0.19) | 8.92AB (0.36) | 8.57A (0.28) | 0.243 | p = 0.086 | p = 0.583 | p = 0.075 | p = 0.006 | p = 0.009 | p = 0.443 |
| HGB (g/dL) | 13.2AB (0.12) | 16.0CD (0.58) | 13.8ABC (0.50) | 16.1 D (0.69) | 13.8ABC (0.15) | 15.3CD (0.35) | 11.8A (0.84) | 14.5BCD (0.31) | 0.475 | p = 0.125 | p = 0.015 | p < 0.001 | p = 0.003 | p = 0.462 | p = 0.509 |
| HCT (%) | 43.3A (0.43) | 49.6BC (1.75) | 46.2AB (1.58) | 50.5BC (2.32) | 45.5AB (0.57) | 51.4C (1.10) | 42.8A (1.91) | 42.4A (1.35) | 0.489 | p = 0.012 | p = 0.290 | p < 0.001 | p < 0.001 | p = 0.012 | p = 0.131 |
| MCV (fL) | 49.6A (0.15) | 51.8B (0.14) | 49.7A (0.28) | 52.0B (0.31) | 49.7A (0.23) | 51.5B (0.23) | 49.8A (0.26) | 51.1B (0.23) | 0.670 | p = 0.693 | p = 0.101 | p < 0.001 | p = 0.367 | p = 0.427 | p = 0.017 |
| MCH (pg) | 15.1A (0.07) | 17.1C (0.29) | 14.8A (0.24) | 16.1B (0.24) | 15.1A (0.08) | 15.3AB (0.14) | 14.8A (1.09) | 17.0C (0.30) | 0.681 | p = 0.866 | p = 0.165 | p < 0.001 | p < 0.001 | p = 0.019 | p = 0.117 |
| RDW (fL) | 28.5A (0.09) | 30.4B (0.17) | 30.9B (0.30) | 34.6C (1.01) | 29.8AB (0.21) | 29.8AB (0.30) | 29.8AB (0.21) | 32.9C (0.68) | 0.714 | p < 0.001 | p = 0.087 | p < 0.001 | p = 0.002 | p < 0.001 | p = 0.024 |
Table 4.
Effect of diet, phenotype, and aerobic interval training protocol on blood and plasma parameters related to glucose and lipid metabolism.
Table 4.
Effect of diet, phenotype, and aerobic interval training protocol on blood and plasma parameters related to glucose and lipid metabolism.
| | RVR | GVR | R2 | Phenotype Effect | Diet Effect | Exercise Effect | Phenotype × Diet | Phenotype × Exercise | Exercise × Diet |
|---|
| Lean | Obese | Lean | Obese |
|---|
| SED | EXC | SED | EXC | SED | EXC | SED | EXC |
|---|
| Glucose (mg/dL) | 87.0A (2.2) | 91.2A (2.3) | 104.9B (5.9) | 81.8A (3.4) | 86.2A (2.7) | 85.0A (1.7) | 93.8AB (2.0) | 85.5A (2.5) | 0.365 | p = 0.044 | p = 0.088 | p = 0.002 | p = 0.926 | p < 0.001 | p = 0.285 |
| AUC (arbitrary units) | 3611BC (129) | 2433AB (233) | 7226D (549) | 5878D (61) | 1965A (178) | 2722AB (255) | 4312C (333) | 3445BC (396) | 0.770 | p < 0.001 | p < 0.001 | p = 0.002 | p < 0.001 | p = 0.039 | p = 0.007 |
| T-Cholesterol (mg/dL) | 72.5A (2.2) | 83.0A (3.6) | 223.9D (10.1) | 172.3C (5.7) | 79.4A (1.5) | 88.9A (2.7) | 207.3D (11.5) | 120.1B (6.8) | 0.936 | p < 0.001 | p < 0.001 | p < 0.001 | p < 0.001 | p < 0.001 | p = 0.011 |
| LDL-Cholesterol (mg/dL) | 3.2A (0.3) | 12.8B (1.8) | 39.5D (4.2) | 27.1C (3.2) | 3.4A (0.3) | 7.9AB (0.8) | 36.6D (3.3) | 16.0B (1.6) | 0.849 | p < 0.001 | p = 0.001 | p = 0.001 | p = 0.099 | p < 0.001 | p = 0.018 |
| HDL-Cholesterol (mg/dL) | 26.0A (0.4) | 29.1AB (1.7) | 59.9D (2.2) | 46.1C (3.7) | 27.6AB (0.5) | 28.1AB (0.9) | 44.3C (3.6) | 35.1B (2.6) | 0.803 | p < 0.001 | p < 0.001 | p < 0.001 | p < 0.001 | p < 0.001 | p = 0.701 |
| Triglycerides (mg/dL) | 31.2A (5.0) | 23.4A (6.0) | 468.9C (58.7) | 353.4B (39.1) | 28.8A (2.3) | 40.2A (7.8) | 470.1C (71.4) | 303.6B (17.9) | 0.883 | p < 0.001 | p = 0.603 | p < 0.001 | p = 0.341 | p < 0.001 | p = 0.629 |
Table 5.
Effect of phenotype, diet, and aerobic interval training protocol on liver weight, chemical composition, and functionality.
Table 5.
Effect of phenotype, diet, and aerobic interval training protocol on liver weight, chemical composition, and functionality.
| | RVR | GVR | R2 | Phenotype Effect | Diet Effect | Exercise Effect | Phenotype × Diet | Phenotype × Exercise | Exercise × Diet |
|---|
| Lean | Obese | Lean | Obese |
|---|
| SED | EXC | SED | EXC | SED | EXC | SED | EXC |
|---|
| Weight (g FW) | 8.6A (0.18) | 9.7A (0.64) | 17.4D (0.75) | 14.7C (0.94) | 9.2A (0.34) | 10.4A (0.58) | 14.1BC (0.71) | 12.4B (0.31) | 0.832 | p < 0.001 | p = 0.001 | p = 0.219 | p < 0.001 | p = 0.001 | p = 0.638 |
| Surface (cm2) | 14.2A (0.51) | 14.0A (0.65) | 24.0D (0.61) | 18.1C (0.47) | 14.9AB (0.34) | 15.4AB (0.43) | 18.2C (0.46) | 16.9BC (0.91) | 0.755 | p < 0.001 | p = 0.002 | p < 0.001 | p < 0.001 | p < 0.001 | p = 0.002 |
| Moisture (%) | 69.3D (0.15) | 69.3D (0.13) | 58.2A (1.55) | 64.5BC (0.82) | 69.4D (0.09) | 67.7CD (0.50) | 63.0B (0.94) | 67.1CD (0.30) | 0.671 | p < 0.001 | p = 0.026 | p = 0.002 | p = 0.001 | p > 0.001 | p = 0.149 |
| Fat (g/100 g DM) | 1.52A (0.33) | 3.05A (0.37) | 21.9B (2.09) | 6.09A (2.12) | 3.58A (0.28) | 6.93A (0.22) | 17.9B (1.53) | 6.15A (0.44) | 0.714 | p < 0.001 | p = 0.512 | p < 0.001 | p = 0.020 | p < 0.001 | p = 0.151 |
| Triglycerides (mg/g DM) | 0.59A (0.08) | 0.90A (0.24) | 17.99C (0.87) | 1.72A (1.75) | 0.25A (0.06) | 0.37A (0.08) | 12.4B (1.41) | 0.95A (0.33) | 0.802 | p < 0.001 | p = 0.209 | p < 0.001 | p = 0.008 | p < 0.001 | p = 0.020 |
| Cholesterol (mg/g DM) | 6.59A (0.34) | 6.40A (0.18) | 4.95AB (0.32) | 6.85A (0.62) | 5.46A (0.10) | 4.60B (0.21) | 4.77B (0.21) | 4.51B (0.34) | 0.470 | p = 0.061 | p < 0.001 | p = 0.567 | p = 0.683 | p = 0.011 | p = 0.008 |
| Liver Function Plasma Markers | | | | | | | | | | | |
| AST (U/L) | 95.4C (5.34) | 61.6A (2.35) | 178.0D (7.58) | 96.1C (9.91) | 67.3AB (4.13) | 57.9A (2.94) | 104.4C (11.20) | 88.8BC (6.21) | 0.826 | p < 0.001 | p < 0.001 | p < 0.001 | p = 0.002 | p = 0.001 | p < 0.001 |
| ALT (U/L) | 37.3A (2.66) | 28.6A (1.94) | 160.8D (11.45) | 59.0B (6.38) | 35.5A (4.05) | 26.6A (2.42) | 115.4C (13.13) | 25.6A (1.83) | 0.922 | p < 0.001 | p < 0.001 | p < 0.001 | p < 0.001 | p < 0.001 | p = 0.379 |
| ALP (U/L) | 99.0AB (2.69) | 152.6CD (7.57) | 268.2F (11.33) | 180.2DE (8.30) | 80.8A (2.52) | 140.7C (3.43) | 201.8E (16.44) | 124.6BC (4.92) | 0.892 | p < 0.001 | p < 0.001 | p = 0.008 | p < 0.001 | p < 0.001 | p = 0.364 |
Table 6.
Effect of phenotype, diet, and aerobic interval training protocol on liver histology of Zucker rats.
Table 6.
Effect of phenotype, diet, and aerobic interval training protocol on liver histology of Zucker rats.
| | RVR | GVR |
|---|
| Lean | Obese | Lean | Obese |
|---|
| SED | EXC | SED | EXC | SED | EXC | SED | EXC |
|---|
| Microvescicularsteatosis | - | -/+ | ++++/+++++ | +++/++++ | - | +/++ | ++++/+++++ | +/++ |
| Fatty droplets | - | - | ++++ | ++/+++ | - | - | ++++ | + |
| Multinucleic cells | - | - | - | - | - | - | - | - |
| Lipogranulomas | - | + | ++/+++ | ++/+++ | ++ | ++ | ++ | +/++ |
| Portal Inflammation | -/+ | +/++ | +++ | ++ | +/++ | +/++ | +++ | ++ |
| Necrosis | - | + | - | + | - | +/++ | - | ++ |
| Fibrosis | - | - | - | - | - | - | - | - |

 ,
, 


