Trends in High School Dropout and Completion Rates in the United States
The status dropout rate is the number of 16- to 24-year-olds who are not enrolled in school and have not earned a high school diploma or an alternative credential, such as a GED, as a percentage of the total number of 16- to 24-year-olds in the population. The status dropout rate is different from the event dropout rate (see Indicator 1) because the status dropout rate includes all dropouts in a particular age range, regardless of when or where they last attended school, including individuals who may have never attended school in the United States, whereas the event dropout rate includes individuals in a particular age range who left a U.S. high school within a particular 1-year period.
In this indicator, status dropout rates are estimated using both the American Community Survey (ACS) and the Current Population Survey (CPS). The ACS covers a broad population, including individuals living in households, as well as individuals living in noninstitutionalized group quarters (such as college or military housing) and institutionalized group quarters (such as correctional or nursing facilities).1 The ACS can provide detail on small demographic groups because it has a large number of respondents. The CPS household survey covers a narrower population and has fewer respondents, but it has been collected annually for decades and can be used to examine long-term trends in the civilian, noninstitutionalized population.
Status dropout rates from the American Community Survey
2017 status dropout rates by institutional status
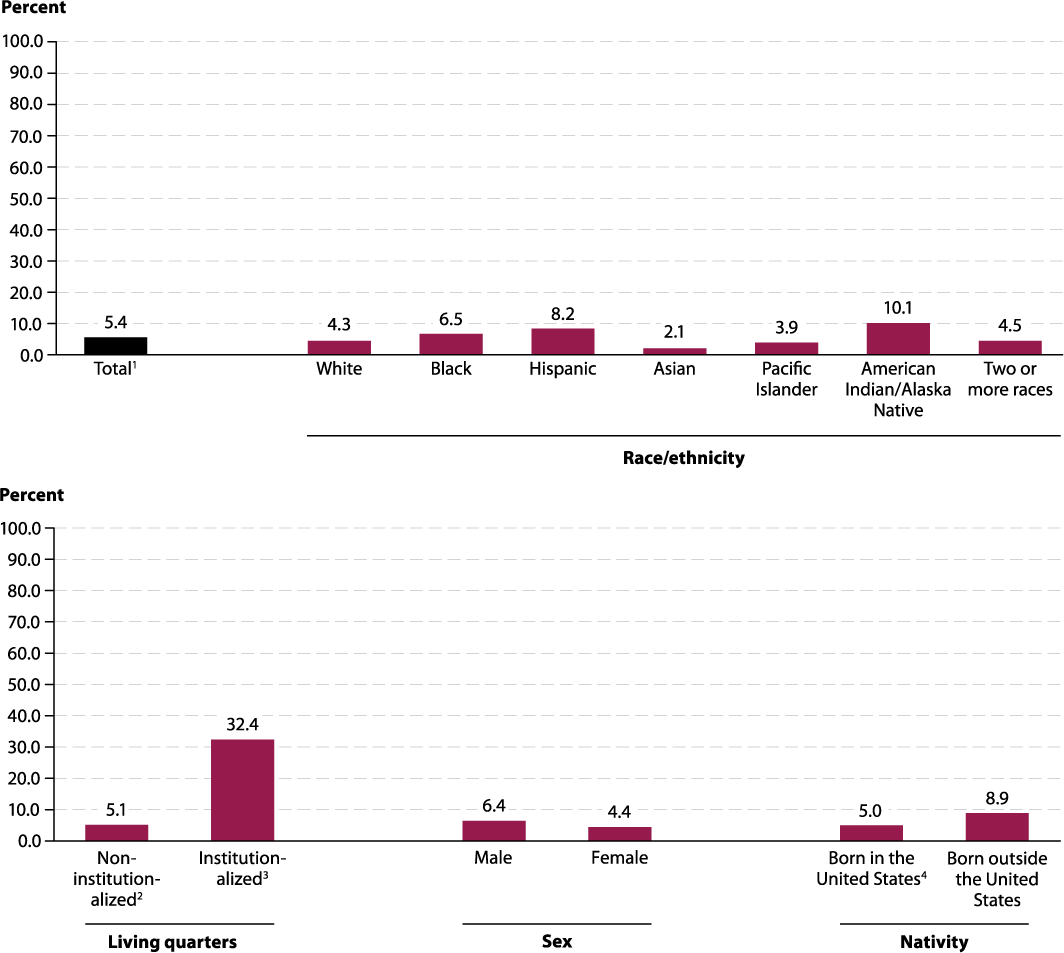
In 2017, the ACS status dropout rate for all 16- to 24-year-olds was 5.4 percent (figure 2.1 and table 2.1). The rate was 5.1 percent for the noninstitutionalized population, which includes individuals living in households and noninstitutionalized group quarters, such as college and university housing, military quarters, facilities for workers and religious groups, and temporary shelters for the homeless. In contrast, the rate was 32.4 percent for the institutionalized population, which includes individuals in adult and juvenile correctional facilities, nursing facilities, and other healthcare facilities.
Figure 2.1. Percentage of high school dropouts among persons 16 through 24 years old (status dropout rate), by selected characteristics: 2017
1 Includes data from respondents who wrote in some other race that was not included as an option on the questionnaire.
2 Persons living in households as well as persons living in noninstitutionalized group quarters. Noninstitutionalized group quarters include college and
university housing, military quarters, facilities for workers and religious groups, and temporary shelters for the homeless.
3 Persons living in institutionalized group quarters, including adult and juvenile correctional facilities, nursing facilities, and other health care facilities.
4 Includes those born in the 50 states, the District of Columbia, Puerto Rico, American Samoa, Guam, the U.S. Virgin Islands, and the Northern Marianas, as
well as those born abroad to U.S.-citizen parents.
NOTE: “Status” dropouts are 16- to 24-year-olds who are not enrolled in school and who have not completed a high school program, regardless of when they
left school and whether they ever attended school in the United States. People who received an alternative credential such as a GED are counted as high
school completers. Race categories exclude persons of Hispanic ethnicity. Data are based on sample surveys of the entire population of 16- to 24-year-olds
residing within the United States. Estimates may differ from those based on the Current Population Survey (CPS) because of differences in survey design and
target populations.
SOURCE: U.S. Department of Commerce, Census Bureau, American Community Survey (ACS), 2017. See table 2.1.
2017 status dropout rates by race/ethnicity
The status dropout rate varied by race/ethnicity in 2017. American Indian/Alaska Native youth had the highest status dropout rate (10.1 percent) of all racial/ ethnic groups, including youth who were Hispanic (8.2 percent), Black (6.5 percent), of Two or more races (4.5 percent), White (4.3 percent), Pacific Islander (3.9 percent), and Asian (2.1 percent; figure 2.1 and table 2.1). In addition, the status dropout rate for Hispanic youth was higher than the rate for Black youth. Hispanic and Black youth also had higher status dropout rates than youth of Two or more races, White, Pacific Islander, and Asian youth. In contrast, Asian youth had the lowest status dropout rate of all racial/ ethnic groups except for Pacific Islander youth, whose status dropout rate was not measurably different from the rate for Asian youth.
2017 status dropout rates by sex and race/ethnicity
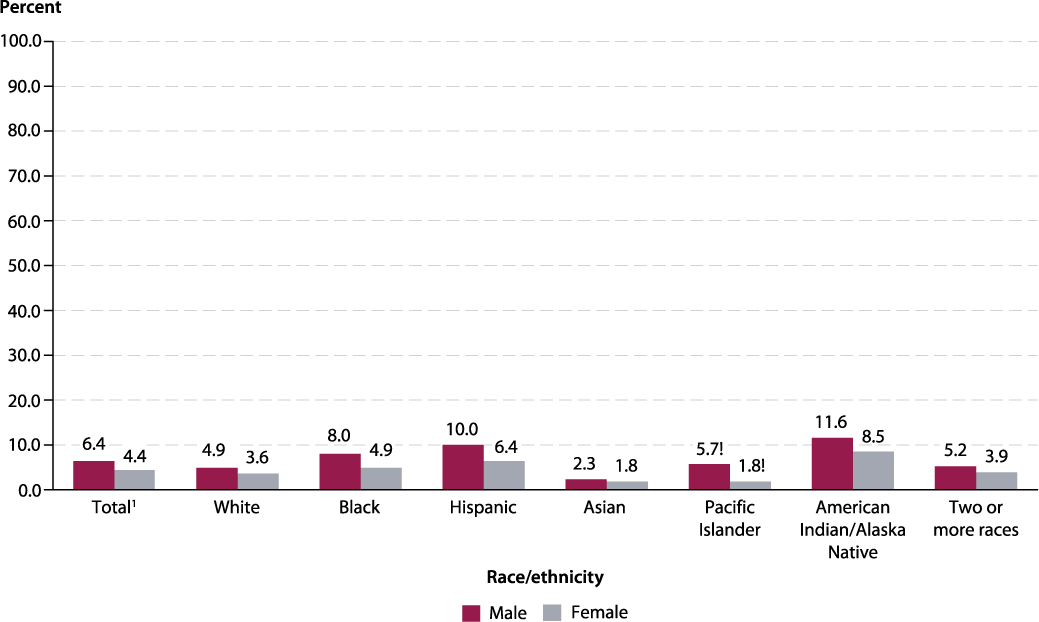
In 2017, the ACS status dropout rate for female 16- to 24-year-olds (4.4 percent) was lower than the rate for their male peers (6.4 percent; figure 2.2 and table 2.1). For 16- to 24-year-olds who were White, Black, Hispanic, American Indian/Alaska Native, and of Two or more races, the status dropout rates were higher for males than for females. Among these groups, the male-female gap in status dropout rates ranged from 1.2 percentage points for White 16- to 24-year-olds to 3.6 percentage points for Hispanic 16- to 24-year-olds. There were no measurable differences by sex in the status dropout rates for Asian and Pacific Islander individuals.
Figure 2.2. Percentage of high school dropouts among persons 16 through 24 years old (status dropout rate), by race/ethnicity and sex: 2017
! Interpret data with caution. The coefficient of variation (CV) for this estimate is between 30 and 50 percent.
1 Includes data from respondents who wrote in some other race that was not included as an option on the questionnaire.
NOTE: “Status” dropouts are 16- to 24-year-olds who are not enrolled in school and who have not completed a high school program, regardless of when they
left school and whether they ever attended school in the United States. People who received an alternative credential such as a GED are counted as high
school completers. Race categories exclude persons of Hispanic ethnicity. Data are based on sample surveys of the entire population of 16- to 24-year-olds
residing within the United States. Estimates may differ from those based on the Current Population Survey (CPS) because of differences in survey design and
target populations.
SOURCE: U.S. Department of Commerce, Census Bureau, American Community Survey (ACS), 2017. See table 2.1.
2017 status dropout rates by nativity and race/ ethnicity
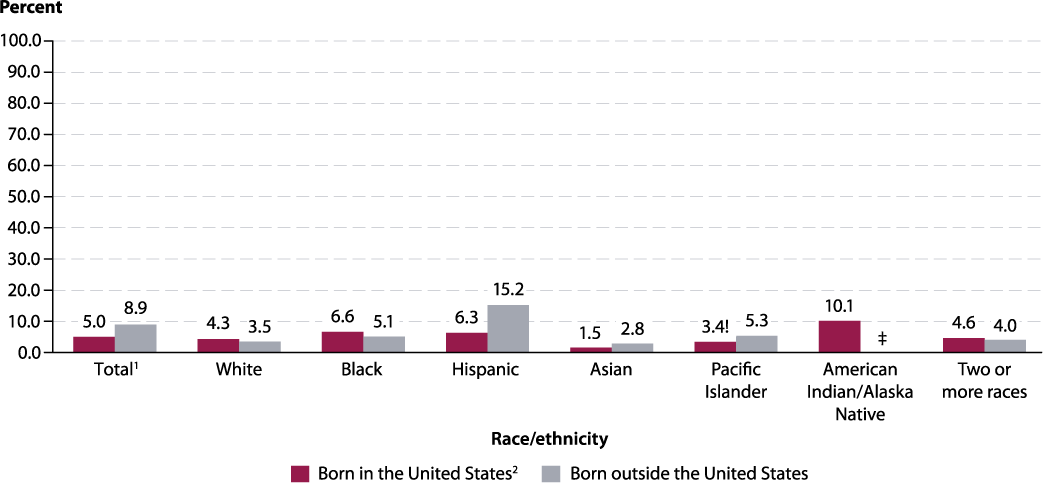
Data from the ACS also enable comparisons between the status dropout rates of U.S.-born2 and foreign-born individuals in the noninstitutionalized population.3 Overall, the status dropout rate was lower for U.S.-born 16- to 24-year-olds (5.0 percent) than for their foreignborn peers (8.9 percent; figure 2.3 and table 2.1). Following a similar pattern, status dropout rates were lower for U.S.-born individuals than for their foreignborn counterparts in the Hispanic (6.3 vs. 15.2 percent) and Asian (1.5 vs. 2.8 percent) racial/ethnic groups. However, status dropout rates were higher for U.S.-born individuals than for their foreign-born counterparts who were White (4.3 vs. 3.5 percent) and Black (6.6 vs. 5.1 percent). The status dropout rates for U.S.-born 16- to 24-year-olds who were Pacific Islanders and of Two or more races were not measurably different from the rates for their foreign-born peers.
Figure 2.3. Percentage of high school dropouts among persons 16 through 24 years old (status dropout rate), by race/ethnicity and nativity: 2017
! Interpret data with caution. The coefficient of variation (CV) for this estimate is between 30 and 50 percent.
‡ Reporting standards not met. Either there are too few cases for a reliable estimate or the coefficient of variation (CV) is 50 percent or greater.
1 Includes data from respondents who wrote in some other race that was not included as an option on the questionnaire.
2 Includes those born in the 50 states, the District of Columbia, Puerto Rico, American Samoa, Guam, the U.S. Virgin Islands, and the Northern Marianas, as
well as those born abroad to U.S.-citizen parents.
NOTE: “Status” dropouts are 16- to 24-year-olds who are not enrolled in school and who have not completed a high school program, regardless of when they
left school and whether they ever attended school in the United States. People who received an alternative credential such as a GED are counted as high
school completers. Race categories exclude persons of Hispanic ethnicity. Data are based on sample surveys of the entire population of 16- to 24-year-olds
residing within the United States. Estimates may differ from those based on the Current Population Survey (CPS) because of differences in survey design and
target populations.
SOURCE: U.S. Department of Commerce, Census Bureau, American Community Survey (ACS), 2017. See table 2.1.
2017 status dropout rates by disability status
The status dropout rate also differed by disability status4 in 2017. The status dropout rate was 12.1 percent for youth with a disability versus 5.0 percent for youth without a disability in 2017 (table 2.1).
2013–2017 average status dropout rates by Hispanic and Asian subgroup
While this indicator presents overall high school status dropout rates for Hispanic and Asian 16- to 24-year-olds, there is much diversity within each of these groups. ACS data on status dropout rates are available for many specific Asian and Hispanic subgroups, including, for example, 16- to 24-year-olds of Chinese, Vietnamese, Mexican, and Puerto Rican descent. Detailed data by national origin were not available for other racial/ethnic groups. This indicator presents average status dropout rates based on five years of ACS data in order to obtain more stable estimates for small population groups, including Hispanic and Asian subgroups.
The 2013–2017 5-year-average status dropout rate5 for Hispanic 16- to 24-year-olds was 9.9 percent overall, while status dropout rates by Hispanic subgroup ranged from 1.5 percent for individuals of Bolivian descent to 24.5 percent for individuals of Guatemalan descent (figure 2.4 and table 2.2). Status dropout rates for Hispanics of Guatemalan (24.5 percent), Honduran (17.6 percent), and Salvadoran descent (13.5 percent) were higher than the total Hispanic status dropout rate. In contrast, status dropout rates for Hispanics of Puerto Rican (9.2 percent), Other Hispanic (8.5 percent), Dominican (7.9 percent), Ecuadorian (7.6 percent), Nicaraguan (6.9 percent), Cuban (5.7 percent), Uruguayan (5.2 percent), Other Central American (4.6 percent), Spaniard (4.5 percent), Chilean (4.2 percent), Costa Rican (3.7 percent), Colombian (3.2 percent), Panamanian (2.8 percent), Peruvian (2.8 percent), Venezuelan (2.6 percent), Paraguayan (2.5 percent), Argentinian (2.0 percent), and Bolivian descent (1.5 percent) were lower than the total Hispanic status dropout rate. The status dropout rates for individuals of Mexican descent were not measurably different from the total Hispanic rate.6
Figure 2.4. Percentage of high school dropouts among persons 16 through 24 years old (status dropout rate), by selected Hispanic subgroups: 2013–2017

! Interpret data with caution. The coefficient of variation (CV) for this estimate is between 30 and 50 percent.
‡ Reporting standards not met. Either there are too few cases for a reliable estimate or the coefficient of variation (CV) is 50 percent or greater.
1 If the estimation procedure were repeated many times, 95 percent of the calculated confidence intervals would contain the true status dropout rate for the
population group.
NOTE: “Status” dropouts are 16- to 24-year-olds who are not enrolled in school and who have not completed a high school program, regardless of when
they left school. People who received an alternative credential such as a GED are counted as high school completers. This figure presents 2013–2017 5-year average
status dropout rates. Use of a 5-year average increases the sample size, thereby reducing the sampling error and producing more stable estimates. Data are based on sample surveys of the entire population of 16- to 24-year-olds residing within the United States, including both noninstitutionalized
persons (e.g., those living in households, college housing, or military housing located within the United States) and institutionalized persons (e.g., those
living in prisons, nursing facilities, or other healthcare facilities). Estimates may differ from those based on the Current Population Survey (CPS) because of
differences in survey design and target populations.
SOURCE: U.S. Department of Commerce, Census Bureau, American Community Survey (ACS), 2013–2017. See table 2.2.
The 2013–2017 average status dropout rate for Asian 16- to 24-year-olds was 2.3 percent overall, while status dropout rates by Asian subgroup ranged from 1.1 to 23.2 percent (figure 2.5 and table 2.2). The status dropout rates for Asians of Burmese (23.2 percent), Bhutanese (19.3 percent), Nepalese (9.9 percent), Cambodian (6.5 percent), Thai (5.8 percent), Laotian (5.0 percent), Southeast Asian (4.4 percent), Hmong (4.2 percent), and Bangladeshi descent (4.2 percent) were higher than the total Asian rate. Status dropout rates for individuals of Asian Indian (1.8 percent), Chinese (1.3 percent), Japanese (1.3 percent), and Korean (1.1 percent) descent were lower than the total Asian rate. Status dropout rates for individuals of Filipino and Pakistani descent were not measurably different from the total Asian rate.7
Figure 2.5. Percentage of high school dropouts among persons 16 through 24 years old (status dropout rate), by selected Asian subgroups: 2013–2017

‡ Reporting standards not met. Either there are too few cases for a reliable estimate or the coefficient of variation (CV) is 50 percent or greater.
1 If the estimation procedure were repeated many times, 95 percent of the calculated confidence intervals would contain the true status dropout rate for the
population group.
NOTE: “Status” dropouts are 16- to 24-year-olds who are not enrolled in school and who have not completed a high school program, regardless of when
they left school. People who received an alternative credential such as a GED are counted as high school completers. This figure presents 2013–2017 5-year average
status dropout rates. Use of a 5-year average increases the sample size, thereby reducing the sampling error and producing more stable estimates.
Data are based on sample surveys of the entire population of 16- to 24-year-olds residing within the United States, including both noninstitutionalized
persons (e.g., those living in households, college housing, or military housing located within the United States) and institutionalized persons (e.g., those
living in prisons, nursing facilities, or other healthcare facilities). Estimates may differ from those based on the Current Population Survey (CPS) because of
differences in survey design and target populations. Asian subgroups exclude persons of Hispanic ethnicity.
SOURCE: U.S. Department of Commerce, Census Bureau, American Community Survey (ACS), 2013–2017. See table 2.2.
2013–2017 average status dropout rates by state
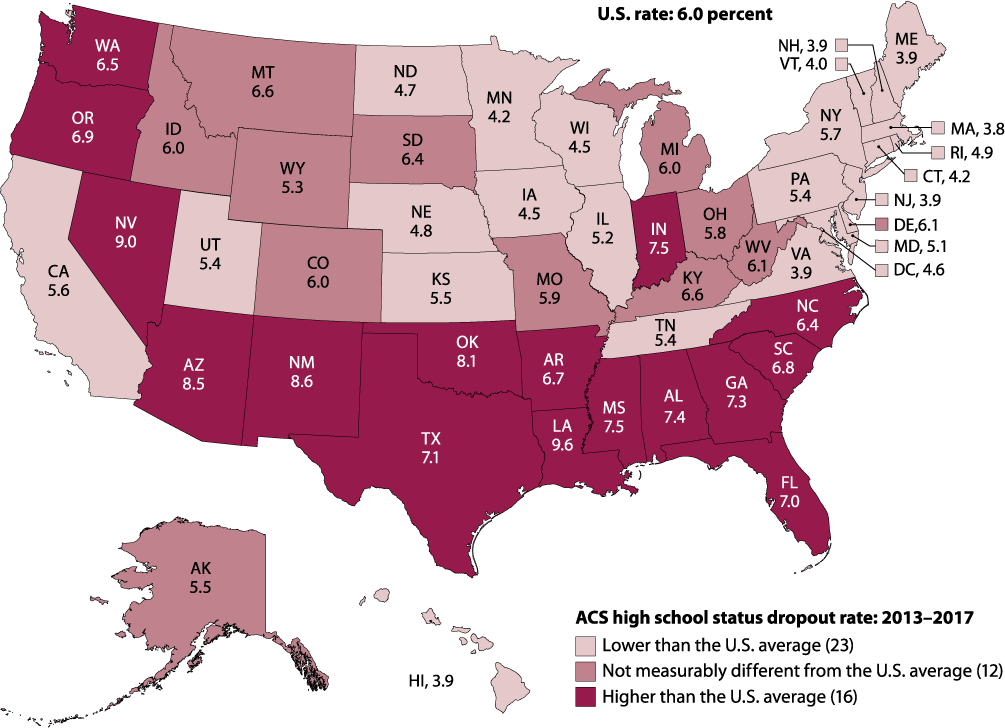
Averaged data from five years of the ACS can also be used to calculate status dropout rates for 16- to 24-year-olds in each state. The average 2013–2017 status dropout rates ranged from 3.8 percent in Massachusetts to 9.6 percent in Louisiana (figure 2.6 and table 2.3). In all, 16 states—most of which were located either in the South (10 states) or the West regions (5 states)—had higher status dropout rates than the national average for 16- to 24-year-olds (6.0 percent). Twenty-two states and the District of Columbia had ACS status dropout rates lower than the national average. The remaining 12 states had status dropout rates that were not measurably different from the national average. (See figure 2.6, which presents the status dropout rates for the 50 states and the District of Columbia.)
Figure 2.6. Percentage of high school dropouts among persons 16 through 24 years old (status dropout rate), by
state: 2013–2017
NOTE: “Status” dropouts are 16- to 24-year-olds who are not enrolled in school and who have not completed a high school program, regardless of when
they left school. People who received an alternative credential such as a GED are counted as high school completers. This figure presents 2013-2017 5-year average
status dropout rates. Use of a 5-year average increases the sample size, thereby reducing the sampling error and producing more stable estimates.
Data are based on sample surveys of the entire population of 16- to 24-year-olds residing within the United States, including both noninstitutionalized
persons (e.g., those living in households, college housing, or military housing located within the United States) and institutionalized persons (e.g., those
living in prisons, nursing facilities, or other healthcare facilities). Estimates may differ from those based on the Current Population Survey (CPS) because of
differences in survey design and target populations.
SOURCE: U.S. Department of Commerce, Census Bureau, American Community Survey (ACS), 2013–2017. See table 2.3.
2013–2017 average White-Black gap of status dropout rate by state
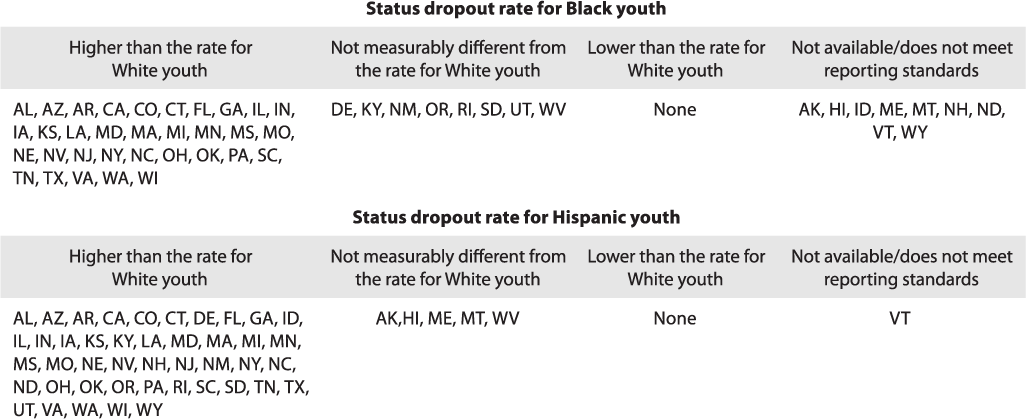
Based on 5 years of ACS data, the 2013–2017 average status dropout rate for White 16- to 24-year-olds (4.5 percent) was 3.0 percentage points lower than the rate for their Black peers (7.5 percent) (table 2.3). In total, 33 states had statistically significant White-Black gaps, and in each of these states the White status dropout rate was lower than the Black status dropout rate (figure 2.7). Among these 33 states, the White-Black gap ranged from 1.1 percentage points in Alabama to 7.1 percentage points in Nebraska. There was no measurable difference between the status dropout rates of White and Black 16- to 24-year-olds in 8 states, and reliable estimates were unavailable for one of the two subgroups in 9 states and the District of Columbia. (See figure 2.7 for listings of states in which the Black status dropout rate was higher than the White status dropout rate, states in which the two rates were not measurably different, and states in which reliable estimates were unavailable for one of these two subgroups.)
Figure 2.7. States in which status dropout rates for Black and Hispanic 16- to 24-year-olds are higher than, not measurably different from, or lower than the status dropout rate for White 16- to 24-year-olds: 2013–2017
NOTE: “Status” dropouts are 16- to 24-year-olds who are not enrolled in school and who have not completed a high school program, regardless of when
they left school. People who received an alternative credential such as a GED are counted as high school completers. Race categories exclude persons of
Hispanic ethnicity. This figure presents 2013–2017 5-year-average status dropout rates. Use of a 5-year average increases the sample size, thereby reducing
the sampling error and producing more stable estimates. Data are based on sample surveys of the entire population of 16- to 24-year-olds residing within the
United States, including both noninstitutionalized persons (e.g., those living in households, college housing, or military housing located within the United
States) and institutionalized persons (e.g., those living in prisons, nursing facilities, or other healthcare facilities). Estimates may differ from those based on
the Current Population Survey (CPS) because of differences in survey design and target populations. Status dropout rate gaps between White students and
Black and Hispanic students in DC could not be calculated because the dropout rates for White students were suppressed in DC.
SOURCE: U.S. Department of Commerce, Census Bureau, American Community Survey (ACS), 2013–2017. See table 2.3.
2013–2017 average White-Hispanic gap of status dropout rate by state
Based on 5 years of ACS data, the 2013–2017 average status dropout rate for White 16- to 24-year-olds (4.5 percent) was 5.5 percentage points lower than the rate for their Hispanic peers (9.9 percent, table 2.3). In total, 44 states had statistically significant White-Hispanic gaps, and in each of these states the White status dropout rate was lower than the Hispanic status dropout rate (figure 2.7). Among these 44 states, the White-Hispanic gap ranged from 2.9 percentage points in New Mexico to 10.5 percentage points in Oklahoma. In 5 states, there was no measurable difference between the status dropout rates of White and Hispanic 16- to 24-year-olds, and in Vermont and the District of Columbia, reliable estimates were unavailable for one of the two subgroups. (See figure 2.7 for listings of states in which the Hispanic status dropout rate was higher than the White status dropout rate and states in which the two rates were not measurably different).
Status dropout rate trends from the Current Population Survey
Total status dropout rate trends
Based on data from the CPS, which is available for a longer time period than the ACS, status dropout rates have trended downward over the past 40 years, declining from 14.1 percent in 19778 to 5.8 percent in 2017 (figure 2.8 and table 2.4). During the most recent 10-year period of available data (2007 to 2017), the status dropout rate decreased from 8.7 percent to 5.8 percent.
Figure 2.8. Percentage of high school dropouts among persons 16 through 24 years old (status dropout rate), by race/ethnicity: October 1977 through 2017

1 Includes other racial/ethnic categories not separately shown.
NOTE: “Status” dropouts are 16- to 24-year-olds who are not enrolled in school and who have not completed a high school program, regardless of when they
left school. People who received an alternative credential such as a GED are counted as high school completers. Race categories exclude persons of Hispanic
ethnicity. White and Black exclude persons of Two or more races after 2002. Data are based on sample surveys of the civilian noninstitutionalized population,
which excludes persons in the military and persons living in institutions (e.g., prisons or nursing facilities). Because of changes in data collection procedures,
data for years 1992 and later may not be comparable with figures for years prior to 1992.
SOURCE: U.S. Department of Commerce, Census Bureau, Current Population Survey (CPS), October, 1977 through 2017. See table 2.4.
Status dropout rate trends by race/ethnicity
Between 1977 and 2017, status dropout rates decreased for White, Black, and Hispanic 16- to 24-year-olds (figure 2.8 and table 2.4). During this time period, the White status dropout rate decreased from 11.9 percent to 4.6 percent, the Black status dropout rate decreased from 19.8 percent to 5.7 percent, and the Hispanic status dropout rate decreased from 33.0 percent to 9.5 percent. Between 2007 and 2017, status dropout rates decreased for Black and Hispanic 16- to 24-year-olds (from 8.4 percent to 5.7 percent and from 21.4 percent to 9.5 percent, respectively), while the rate for White 16- to 24-year-olds showed no measurable change.
The status dropout rate for White 16- to 24-year-olds was consistently lower than the rate for their Black peers between 1977 and 2015 (figure 2.8 and table 2.4). The White-Black gap in status dropout rates was 7.9 percentage points in 1977 and it fell to 3.1 percentage points in 2007. After 2007, the White status dropout rate remained lower than the Black rate until 2016 and 2017, two years in which there was no measurable gap between the White and Black status dropout rates. In addition, the White status dropout rate was consistently lower than the Hispanic rate between 1977 and 2017, although the gap decreased from 21.1 percentage points to 4.8 percentage points over that period. During the most recent 10-year period of available data (2007 to 2017), the White-Hispanic gap in the status dropout rate decreased from 16.2 percentage points to 4.8 percentage points.
Status dropout rate trends by sex
The downward trend in the overall status dropout rate from 1977 to 2017 was observed for both male (from 14.5 to 6.6 percent) and female 16- to 24-year-olds (from 13.8 to 5.0 percent; table 2.4). Between 2007 and 2017, the status dropout rate for male 16- to 24-year-olds fell from 9.8 percent to 6.6 percent, and the status dropout rate for female 16- to 24-year-olds fell from 7.7 percent to 5.0 percent. From 1977 to 2017, the male status dropout rate was generally higher than the female status dropout rate; however, in certain years during the period (1977–1979, 1987, 1990–1993, 1995–1996, 2013, and 2015) there was no measurable difference between the male and female status dropout rates.
Figure 2.9. Percentage distribution of high school dropouts among persons 16 through 24 years old (status dropouts), by labor force status: Selected years, October 1977 through 2017

NOTE: “Status” dropouts are 16- to 24-year-olds who are not enrolled in school and who have not completed a high school program, regardless of when
they left school. People who received an alternative credential such as a GED are counted as high school completers. Data are based on sample surveys of
the civilian noninstitutionalized population. The rates reported in this figure are not the same as official employment and unemployment rates released by
Bureau of Labor Statistics.
SOURCE: U.S. Department of Commerce, Census Bureau, Current Population Survey (CPS), selected years, October 1977 through 2017. See table 2.5.
Trends in the labor force status of status dropouts
Among 16- to 24-year-olds who were status dropouts in 2017, some 46.7 percent were employed, 44.9 percent were not in the labor force, and 8.3 percent were unemployed (figure 2.9 and table 2.5). These percentages are not comparable to the Bureau of Labor Statistics unemployment rates, which exclude individuals who were not in the labor force. The percentage of status dropouts who were employed in 2017 (46.7 percent) was lower than the percentage in 1977 (52.9 percent). Similarly, the percentage of status dropouts who were unemployed in 2017 (8.3 percent) was also lower than the percentage in 1977 (13.6 percent). The percentage of status dropouts who were not in the labor force increased from 33.3 percent in 2007 to 44.9 percent in 2017.
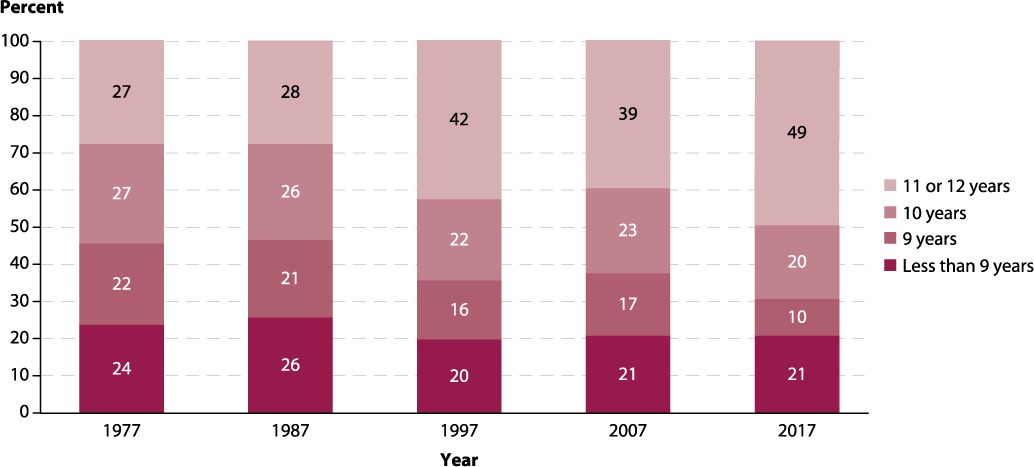
Figure 2.10. Percentage distribution of high school dropouts among persons 16 through 24 years old (status dropouts), by years of school completed: Selected years, October 1977 through 2017
NOTE: “Status” dropouts are 16- to 24-year-olds who are not enrolled in school and who have not completed a high school program, regardless of when they
left school. People who received an alternative credential such as a GED are counted as high school completers. Data are based on sample surveys of the
civilian noninstitutionalized population.
SOURCE: U.S. Department of Commerce, Census Bureau, Current Population Survey (CPS), selected years, October 1977 through 2017. See table 2.5.
Trends in the years of school completed by status dropouts
In 2017, some 21.0 percent of status dropouts had completed fewer than 9 years of school, 9.8 percent had completed 9 years, 20.3 percent had completed 10 years, and 49.0 percent had completed 11 or 12 years (figure 2.10 and table 2.4). Between 1977 and 2017, the percentage of status dropouts who had completed 9 years decreased by 12.0 percentage points. Similarly, the percentage of status dropouts who had completed 10 years of school decreased by 7.0 percentage points. By contrast, the percentage of status dropouts who had completed 11 or 12 years increased by 22.4 percentage points. Between 2007 and 2017, the percentage of status dropouts who had completed 9 years of school decreased by 7.2 percentage points, while the percentage of status dropouts who had completed 11 or 12 years increased by 10.0 percentage points and the percentage of status dropouts who had completed 10 years showed no measurable change.
1 While useful for measuring overall educational attainment among young adults in the United States, the status dropout rate is limited as an
indicator of the performance of U.S. schools because it includes individuals who never attended school in the United States.
2 U.S.-born individuals include those born in the 50 states, the District of Columbia, Puerto Rico, American Samoa, Guam, the U.S. Virgin
Islands, and the Northern Marianas, as well as those born abroad to U.S.-citizen parents.
3 The noninstitutionalized population includes persons living in households as well as persons living in noninstitutionalized group quarters.
Noninstitutionalized group quarters include college and university housing, military quarters, facilities for workers and religious groups, and
temporary shelters for the homeless.
4 In this indicator, a disability is a long-lasting physical, mental, or emotional condition that can make it difficult for a person to do activities
such as walking, climbing stairs, dressing, bathing, learning, or remembering. The condition can also impede a person from being able to go
outside the home alone or to work at a job or business. For more details, see https://www.census.gov/topics/health/disability/about/glossary.html.
5 These estimates are derived from a sample collected over a period of 5 years (from 2013 to 2017). The use of a 5-year average increases the
sample size, thereby reducing the size of sampling errors and producing more stable estimates.
6 A reliable estimate was not available for Other South American 16- to 24-year-olds.
7 Reliable estimates were not available for Taiwanese, Sri Lankan, Indonesian, and Malaysian 16- to 24-year-olds.
8 Because of changes in data collection procedures, use caution when comparing data for 1992 and later years to earlier data. For more
information on the data collection changes, see Kaufman, Alt, and Chapman (2004).


