Trends in High School Dropout and Completion Rates in the United States
The adjusted cohort graduation rate (ACGR) provides information about the percentage of United States (U.S.) public high school students who graduate on time with a regular diploma.1 Specifically, the ACGR is the number of students who graduate in 4 years with a regular high school diploma divided by the number of students who form the adjusted cohort for the graduating class. From the beginning of 9th grade (or the earliest high school grade), students who are entering that grade for the first time form a cohort that is “adjusted” by adding any students who subsequently transfer into the cohort and subtracting any students who subsequently transfer out, emigrate to another country, or die. In this indicator, data for the United States include public schools in the 50 states and the District of Columbia, except for the Bureau of Indian Education schools. State education agencies calculate the ACGR using detailed data that track each student over time. The ACGR is considered the most accurate measure available for reporting on-time graduation rates (Seastrom et al. 2006b). However, the ACGR is a relatively new graduation rate measure, and in many states the student-level data required to calculate the ACGR have only become available in recent years.
ACGRs are more comparable across states than the graduation rates previously compiled by the U.S. Department of Education. However, there has been some variation in the way that individual states have implemented ACGR requirements.2 In addition, graduation requirements for obtaining a regular public high school diploma vary across states.
The ACGR is different from the averaged freshman graduation rate (AFGR) presented in Indicator 5. The AFGR uses aggregated public school enrollment data and diploma counts to approximate a 4-year graduation rate. The AFGR estimate is not as accurate as the ACGR, but the AFGR can be estimated annually as far back as the 1960s. The ACGR has only been available nationally since 2010–11.
The ACGR is also different from the high school status completion rate, which is presented in Indicator 3. The status completion rate measures the percentage of all civilian, noninstitutionalized 18- to 24-year-olds living in the United States who have a high school credential (i.e., a regular high school diploma or alternative credential, such as a GED) obtained from a public or private school or institution, including credentials from foreign schools or institutions. In contrast, the ACGR focuses on regular high school diploma recipients among a single cohort of U.S. public high school students. In addition, the status completion rate is not sensitive to the timing of when students obtained their credentials, while the ACGR counts as graduates only those students who obtain a regular high school diploma within 4 years of starting 9th grade.
Figure 4.1. Adjusted cohort graduation rate (ACGR) of public high school students, by state: 2016–17
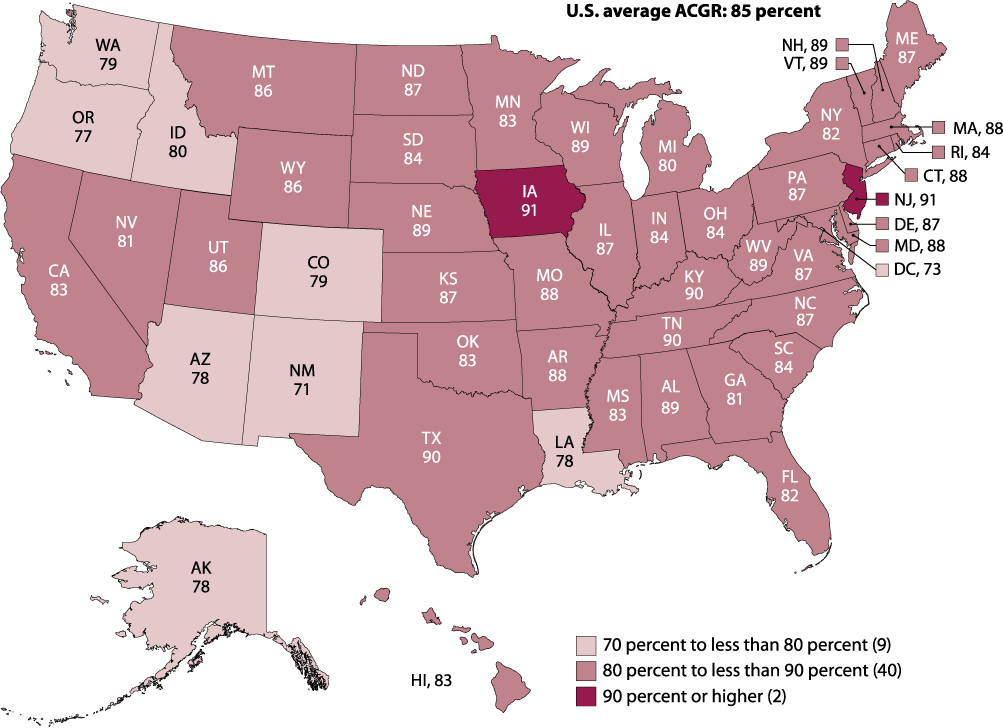
NOTE: The adjusted cohort graduation rate (ACGR) is the percentage of public high school freshmen who graduate with a regular diploma within 4 years
of starting 9th grade. Students who are entering 9th grade for the first time form a cohort for the graduating class. This cohort is “adjusted” by adding any
students who subsequently transfer into the cohort and subtracting any students who subsequently transfer out, emigrate to another country, or die. The
Bureau of Indian Education and Puerto Rico were not included in the United States 4-year ACGR. The graduation rates displayed above have been rounded to
whole numbers. Categorizations are based on unrounded percentages.
SOURCE: U.S. Department of Education, Office of Elementary and Secondary Education, Consolidated State Performance Report, 2016–17. See table 4.1.
Total ACGR
The U.S. average ACGR for public high school students increased over the first 7 years it was collected, from 79 percent in 2010–11 to 85 percent in 2016–17 (table 4.1). That is, of the students who were first-time ninth-graders in 2013–14, more than four out of five had completed high school within 4 years (by the end of SY 2016–17). In 2016–17, the ACGR ranged from 71 percent in New Mexico to 91 percent in Iowa. More than three-quarters of states (40) reported ACGRs that were 80 percent or higher and less than 90 percent.3
Figure 4.2. Adjusted cohort graduation rate (ACGR) of public high school students, by race/ethnicity: 2016–17
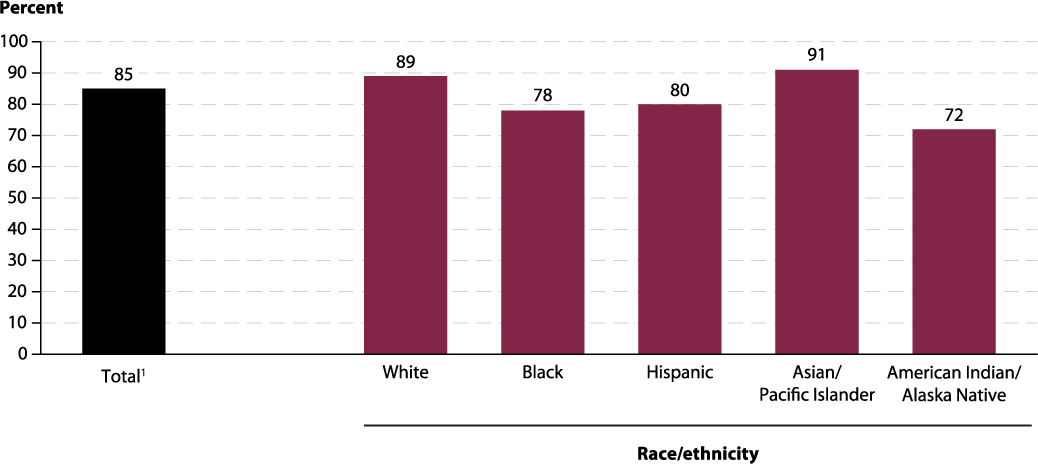
1 Includes other race/ethnicity categories not separately shown.
NOTE: The adjusted cohort graduation rate (ACGR) is the percentage of public high school freshmen who graduate with a regular diploma within 4 years
of starting 9th grade. Students who are entering 9th grade for the first time form a cohort for the graduating class. This cohort is “adjusted” by adding any
students who subsequently transfer into the cohort and subtracting any students who subsequently transfer out, emigrate to another country, or die. The
Bureau of Indian Education and Puerto Rico were not included in the United States 4-year ACGR. Race categories exclude persons of Hispanic ethnicity.
Although rounded numbers are displayed, the figures are based on unrounded data.
SOURCE: U.S. Department of Education, Office of Elementary and Secondary Education, Consolidated State Performance Report, 2016–17. See table 4.1.
ACGR by race/ethnicity
In 2016–17, the ACGRs for American Indian/Alaska Native (72 percent),4 Black (78 percent), and Hispanic (80 percent) public high school students were below the U.S. average of 85 percent. The ACGRs for White students (89 percent) and Asian/Pacific Islander students (91 percent)5 were above the U.S. average ACGR (figure 4.2 and table 4.1). Across states, ACGRs for White students ranged from 76 percent in New Mexico to 95 percent in New Jersey; additionally, in 37 states and the District of Columbia, the rates for White students were higher than the U.S. average ACGR. The rates for Black students ranged from 65 percent in Minnesota to 87 percent in West Virginia. Alabama, Maryland, Texas, and West Virginia were the only four states in which the ACGRs for Black students were higher than the U.S. average ACGR. The ACGRs for Hispanic students ranged from 66 percent in Minnesota to 92 percent in West Virginia; in six states (Alabama, Arkansas, Maine, Texas, Vermont, and West Virginia), ACGRs for Hispanic students were higher than the U.S. average ACGR. For Asian/Pacific Islander students, ACGRs ranged from 78 percent in the District of Columbia to 95 percent or higher in Alabama, Connecticut, Delaware, Maryland, New Jersey, Texas, and West Virginia; in 43 states, ACGRs for Asian/Pacific Islander students were higher than the U.S. average ACGR. ACGRs for American Indian/ Alaska Native students ranged from 50 percent in South Dakota to 92 percent in New Jersey, and in six states (Arkansas, Connecticut, Maryland, New Jersey, Tennessee, and Texas) the rates were higher than the U.S. average ACGR.6 (See table 4.1 for additional statelevel data.)
Figure 4.3. Adjusted cohort graduation rate (ACGR) of Black and White public high school students, by state: 2016–17
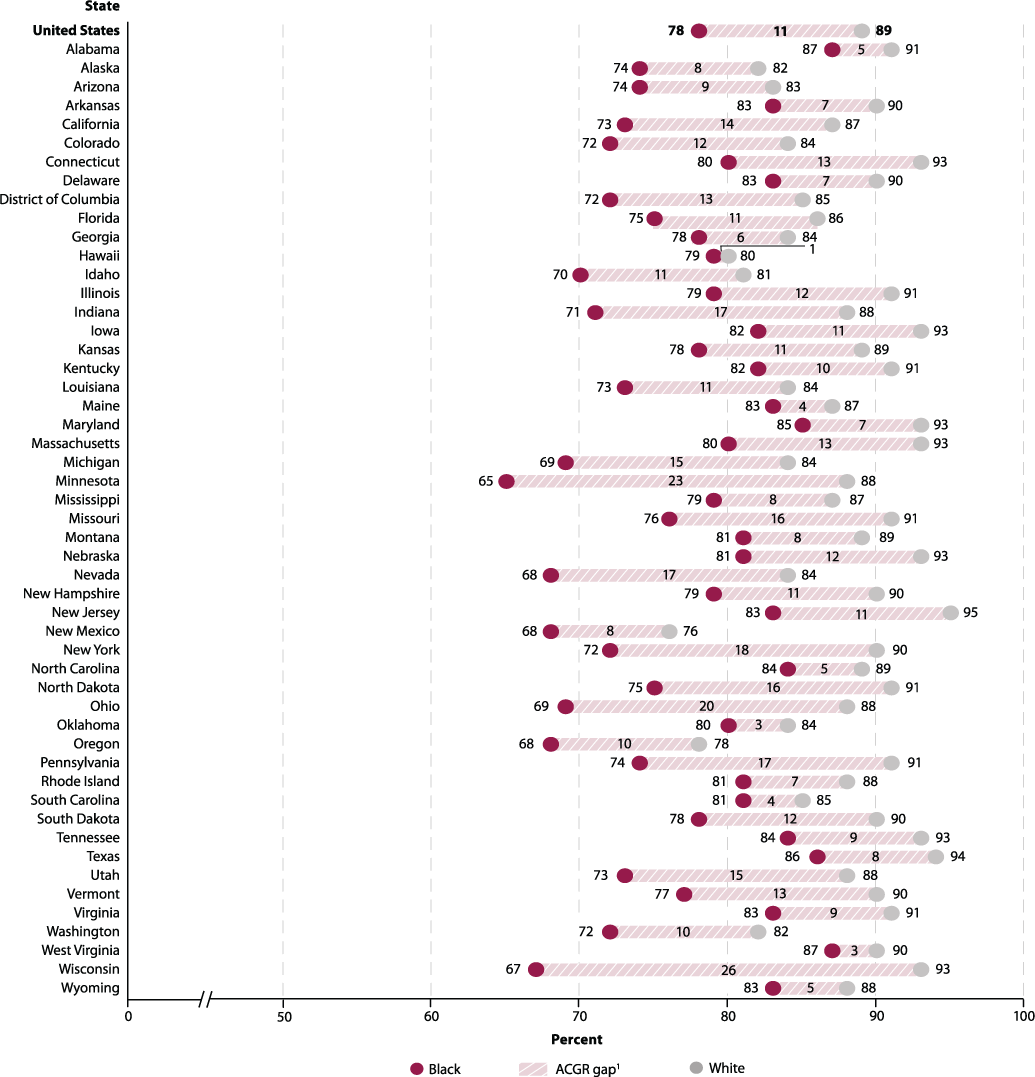
1 The graduation rate gaps were calculated using the most precise graduation rates available for public use; some rates were rounded to one decimal place
and some rates were rounded to whole numbers. These gaps may vary slightly from those that would be calculated using unrounded rates.
NOTE: The adjusted cohort graduation rate (ACGR) is the percentage of public high school freshmen who graduate with a regular diploma within 4 years
of starting 9th grade. Students who are entering 9th grade for the first time form a cohort for the graduating class. This cohort is “adjusted” by adding any
students who subsequently transfer into the cohort and subtracting any students who subsequently transfer out, emigrate to another country, or die. The
Bureau of Indian Education and Puerto Rico were not included in the United States 4-year ACGR. Race categories exclude persons of Hispanic ethnicity.
Although rounded numbers are displayed, the figures are based on unrounded data.
SOURCE: U.S. Department of Education, Office of Elementary and Secondary Education, Consolidated State Performance Report, 2016–17. See table 4.1.
The U.S. average ACGR for White public high school students (89 percent) was 11 percentage points higher than the U.S. average ACGR for their Black peers (78 percent) in 2016–17 (figure 4.3 and table 4.1).7 White students had higher ACGRs than Black students in every state and the District of Columbia. Minnesota and Wisconsin reported the largest gaps between the ACGRs for White and Black students (23 percentage points and 26 percentage points, respectively).
Figure 4.4. Adjusted cohort graduation rate (ACGR) of Hispanic and White public high school students, by state: 2016–17
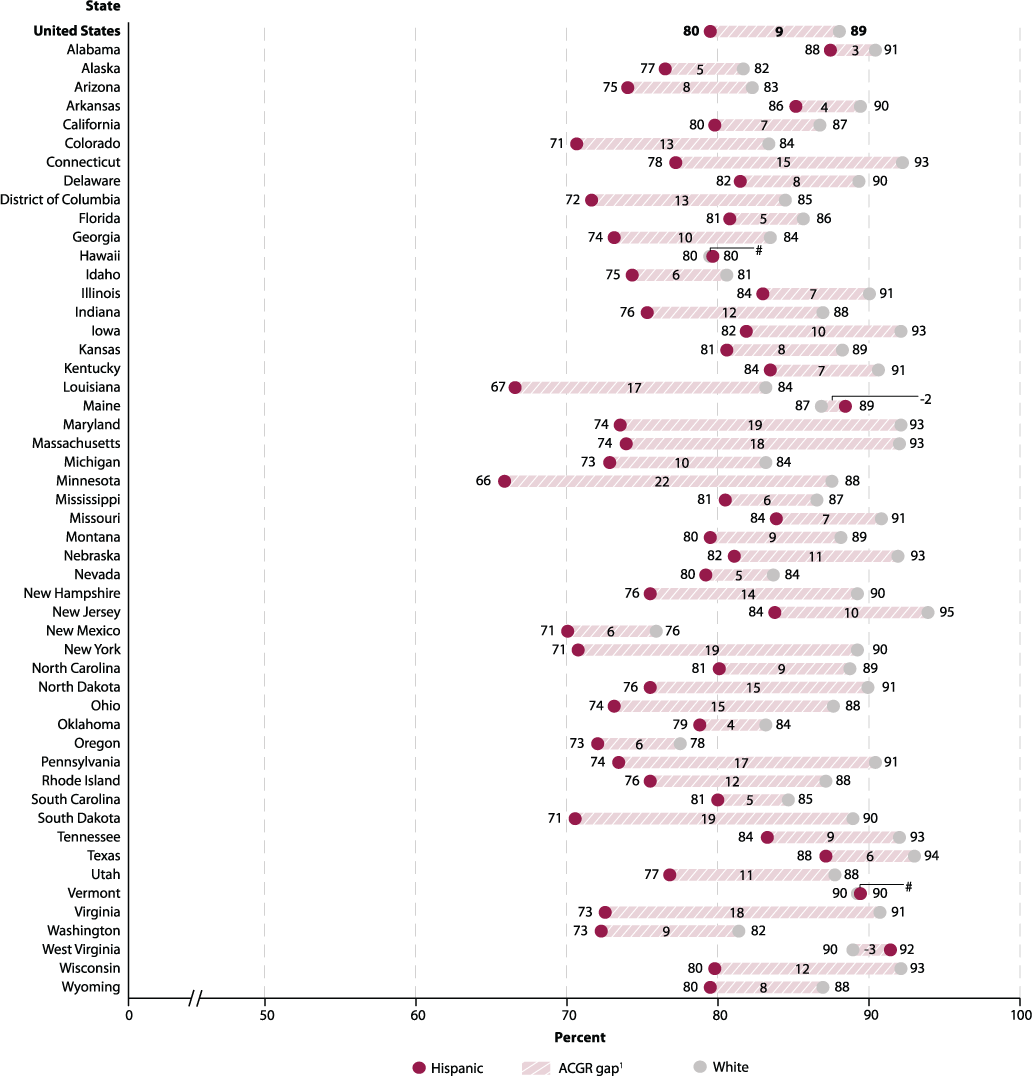
# Rounds to zero.
1 The graduation rate gaps were calculated using the most precise graduation rates available for public use; some rates were rounded to one decimal place
and some rates were rounded to whole numbers. These gaps may vary slightly from those that would be calculated using unrounded rates.
NOTE: The adjusted cohort graduation rate (ACGR) is the percentage of public high school freshmen who graduate with a regular diploma within 4 years
of starting 9th grade. Students who are entering 9th grade for the first time form a cohort for the graduating class. This cohort is “adjusted” by adding any
students who subsequently transfer into the cohort and subtracting any students who subsequently transfer out, emigrate to another country, or die. The
Bureau of Indian Education and Puerto Rico were not included in the United States 4-year ACGR. Race categories exclude persons of Hispanic ethnicity.
Although rounded numbers are displayed, the figures are based on unrounded data.
SOURCE: U.S. Department of Education, Office of Elementary and Secondary Education, Consolidated State Performance Report, 2016–17. See table 4.1.
The U.S. average ACGR for White students (89 percent) was 9 percentage points higher than the U.S. average ACGR for Hispanic students (80 percent) in 2016–17 (figure 4.4 and table 4.1). The ACGRs for White students were higher than the ACGRs for Hispanic students in 46 states and the District of Columbia. In Hawaii, the ACGRs for Hispanic and White students were both 80 percent. In Maine, Vermont, and West Virginia, the ACGRs for Hispanic students were higher than the ACGRs for White students.
ACGR by special populations
The U.S. Department of Education also collects ACGR data for economically disadvantaged students,8 students with disabilities,9 and limited-English-proficient students.10 In 2016–17, the U.S. average ACGRs for economically disadvantaged students (78 percent), limited-English-proficient students (66 percent), and students with disabilities (67 percent) were lower than the U.S. average ACGR of 85 percent (table 4.1).11 However, the criteria under which students are counted in these subgroups vary across states. ACGRs for students with disabilities, in particular, vary according to a state’s definition of what constitutes a regular high school diploma. The types of data used to determine whether a student is economically disadvantaged or whether a student has limited English proficiency also vary across states. In addition, the point in time at which subgroup status is determined varies across states. States may determine subgroup status based on students’ characteristics when they enter high school or when they exit high school, or they may determine subgroup status based on whether students were ever categorized in a particular subgroup during the course of their high school career. This variation is particularly important to keep in mind when interpreting the graduation rates for limited-English-proficient students. Some students enter high school as limited-Englishproficient but attain English proficiency before graduation.
ACGRs for economically disadvantaged students ranged from 65 percent in Wyoming to 87 percent in West Virginia.12 ACGRs varied even more widely for limited-English-proficient students and students with disabilities. ACGRs ranged from 30 percent in Arizona to 82 percent in Arkansas for limited-English-proficient students.13 For students with disabilities, ACGRs ranged from 36 percent in Mississippi to 84 percent in Arkansas.14
1 Those students who were awarded an alternate credential, such as a GED, are not included as graduates in the ACGR calculations.
2 Examples of ways in which the calculated ACGR may vary among states include how students are identified for inclusion in certain subgroups,
how the beginning of the cohort is defined, and whether summer school students are included.
3 Based on unrounded graduation rates.
4 The U.S. average ACGRs for American Indian/Alaska Native students include estimated data for Alabama, since the state did not report
ACGR rates to the U.S. Department of Education for this subgroup. Estimated data for Alabama were based on data published on the Alabama
State Department of Education website.
5 Reporting practices for data on Asian and Pacific Islander students vary by state. Asian/Pacific Islander data in this indicator represent either the
value reported by the state for the “Asian/Pacific Islander” group or an aggregation of separate values reported by the state for “Asian” and “Pacific
Islander.” “Pacific Islander” includes the “Filipino” group, which only California reports separately.
6 Discussion of ACGRs for American Indian/Alaska Native students excludes data for Alabama, the District of Columbia, Vermont, and West
Virginia. The American Indian/Alaska Native data for the District of Columbia and Vermont are suppressed to protect student privacy and are
unavailable for Alabama. The ACGR for American Indian/Alaska Native students in West Virginia is greater than or equal to 80 percent. To
protect student privacy, the exact value is not displayed.
7 Percentage point gaps are calculated using the most precise graduation rates available for public use; some rates were rounded to one decimal
place and some rates were rounded to whole numbers. These gaps may vary slightly from those that would be calculated using unrounded rates.
8 Students who met the state criteria for classification as economically disadvantaged.
9 Students identified as children with disabilities under the Individuals with Disabilities Education Act (IDEA).
10 Students who met the definition of “limited English proficient” as outlined in the EDFacts workbook. For more information, see https://www2.ed.gov/about/inits/ed/edfacts/eden-workbook.html.
11 The U.S. average ACGRs for students with disabilities, limited-English-proficient students, and economically disadvantaged students include
estimated data for Alabama, since the state did not report ACGR rates to the U.S. Department of Education for these subgroups. Estimated data
for Alabama were based on data published on the Alabama State Department of Education website.
12 Discussion of ACGRs for economically disadvantaged students excludes data for Alabama. In 2016–17, the ACGR for economically
disadvantaged students in Alabama was unavailable.
13 Discussion of ACGRs for limited-English-proficient students excludes data for Alabama and West Virginia. In 2016–17, the ACGR for
limited-English-proficient students in Alabama was unavailable, and data for West Virginia were suppressed to protect student privacy.
14 Discussion of ACGRs for students with disabilities excludes data for Alabama. In 2016–17, the ACGR for students with disabilities in
Alabama was unavailable.


