Trends in High School Dropout and Completion Rates in the United States
The averaged freshman graduation rate (AFGR) is an estimate of the percentage of public high school students who graduate on time (i.e., 4 years after starting 9th grade) with a regular diploma. The rate uses aggregate student enrollment data to estimate the size of an incoming freshman class and aggregate counts of the number of diplomas awarded 4 years later. Regular diploma earners are individuals who were awarded a regular high school diploma or a diploma that recognizes some higher level of academic achievement. They can be thought of as students who met or exceeded the coursework and performance standards for high school graduation established by a state or other relevant authority. Other high school completers (those who were awarded a certificate of completion, a GED, or other alternate credentials) are not included as graduates in the AFGR calculations because they are not considered regular diploma earners.
The AFGR is different from the adjusted cohort graduation rate (ACGR), presented in Indicator 4. The AFGR uses aggregate enrollment data and diploma counts to estimate a graduation rate, while the ACGR uses detailed student-level data to track enrollment and completions over time and calculate a precise graduation rate. Although it is less accurate than the ACGR, the AFGR can be estimated historically over a 40-year time span, whereas the student-level records required for the ACGR have become available only in recent years in many states.
National AFGR
The AFGR decreased from 74 percent in 1990–91 to 71 percent in 1995–96, and then rose from 71 percent in 1998–99 to 75 percent in 2004–05 (figure 5.1).1 After a brief decline to 73 percent in 2005–06, the AFGR rose steadily to reach 82 percent in 2012–13, the highest rate observed in the years for which the AFGR is available (table 5.1).2 (In comparison, the ACGR for 2012–13 was 81 percent [table 4.1]). Data for 2013–14 and later years are currently unavailable.
Figure 5.1. Averaged freshman graduation rate (AFGR) for public secondary schools in the United States: Selected years, 1990–91 through 2012–13
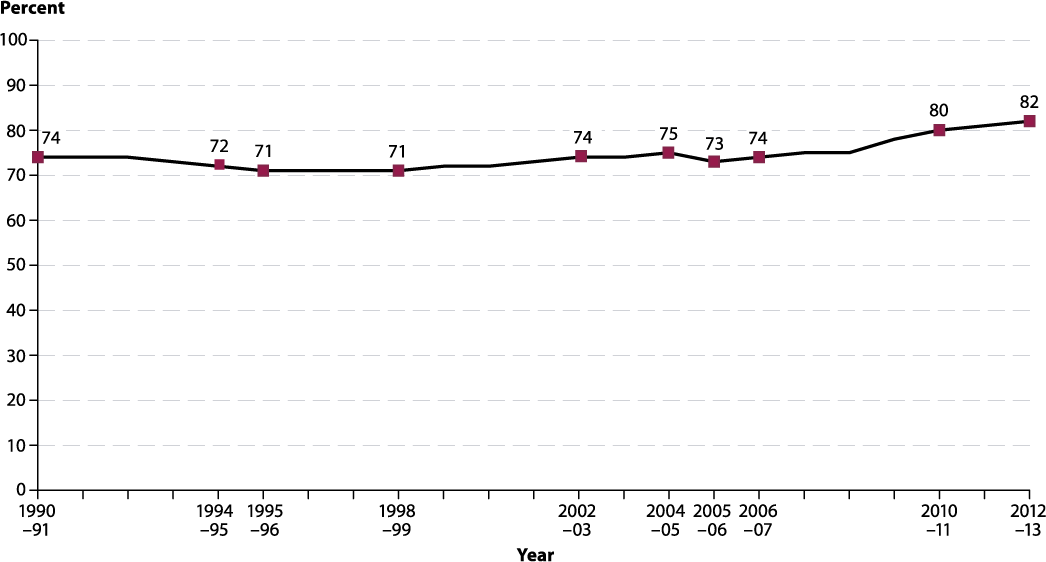
NOTE: The averaged freshman graduation rate (AFGR) provides an estimate of the percentage of students who receive a regular diploma within 4 years
of entering 9th grade. The AFGR uses aggregate student enrollment data to estimate the size of an incoming freshman class and aggregate counts of the
number of diplomas awarded 4 years later. The rates in this figure are based on reported totals of enrollment by grade and high school graduates, rather than
on details reported by race/ethnicity.
SOURCE: U.S. Department of Education, National Center for Education Statistics, Common Core of Data (CCD), “State Nonfiscal Survey of Public Elementary/Secondary Education,” 1986–87 through 2007–08; “State Dropout and Completion Data File,” 2005–06 through 2012–13. See table 5.1.
AFGR by state
In 2012–13, the AFGR ranged from 68 percent in Nevada and Mississippi to 93 percent in Nebraska and Wisconsin (table 5.2). The AFGR was also above 90 percent in Minnesota (91 percent) and North Dakota (91 percent). In contrast, seven states had AFGRs of less than 75 percent: South Carolina (74 percent), Alabama (74 percent), Louisiana (73 percent), New Mexico (72 percent), Georgia (71 percent), Mississippi (68 percent), and Nevada (68 percent).
1 This indicator uses graduation rates that have been rounded to whole numbers. Comparisons across time and between states may differ slightly
from comparisons based on unrounded rates.
2 The averaged freshman graduation rate is available for school years 1969–70 through 2012–13. See table 5.1.


