- Surveys & Programs
- Data & Tools
- Fast Facts
- News & Events
- Publications & Products
- About Us

Indicator 7: Racial/Ethnic Concentration in Public Schools
(Last Updated: February 2019)
In fall 2015, approximately 30 percent of public school students attended schools in which minority students comprised at least 75 percent of total enrollment. Over half of Hispanic, Black, and Pacific Islander students attended such schools.
Racial/ethnic distributions of public school students have shifted between fall 2000 and fall 2015 (see indicator Elementary and Secondary Enrollment). As a result, the proportion of minority students who attended public schools with a majority-minority enrollment has increased over time. Minority students include students who are Black, Hispanic, Asian, Pacific Islander, American Indian/Alaska Native, and of Two or more races.
Figure 7.1. Percentage of public elementary and secondary school students enrolled in schools with at least 75 percent minority enrollment, by student race/ethnicity: Fall 2000, fall 2010, and fall 2015

— Not available.
NOTE: Minority students include students who are Black, Hispanic, Asian, Pacific Islander, American Indian/Alaska Native, and of Two or more races. Prior to 2010, separate data on students who are Asian, Pacific Islander, and of Two or more races were not collected. Data reflect racial/ethnic data reported by schools. Race categories exclude persons of Hispanic ethnicity. Although rounded numbers are displayed, the figures are based on unrounded data.
SOURCE: U.S. Department of Education, National Center for Education Statistics, Common Core of Data (CCD), “Public Elementary/Secondary School Universe Survey,” 2000–01, 2010–11, and 2015–16. See Digest of Education Statistics 2017, table 216.50.
In fall 2015, public schools where minority students comprised at least 75 percent of the student population enrolled 30 percent of all public elementary and secondary students, compared with 21 percent in fall 2000. Among individual racial/ethnic groups, the percentage of students enrolled in these schools increased between 2000 and 2015 for White, Black, Hispanic, and American Indian/Alaska Native students. For example, the percentage of American Indian/Alaska Native students in such schools increased from 29 percent in 2000 to 37 percent in 2015. Similarly, the percentage of Black students in these schools increased from 51 percent in 2000 to 58 percent in 2015. Increases in enrollments in these schools was 4 percentage points for Hispanic students and 2 percentage points for White students during this time.
For students who are Asian, Pacific Islander, and of Two or more races, separate data was not available until fall 2010. Between 2010 and 2015, the percentage of Asian students enrolled in public schools where minority students comprised at least 75 percent of the student population increased 2 percentage points, from 36 percent in 2010 to 38 percent in 2015. However, the percentage of Pacific Islander students enrolled in these schools was 1 percentage point lower in 2015 (53 percent) than in 2010 (54 percent), and the percentage of students of Two or more races enrolled in these schools was less than 1 percentage point lower in 2015 (19 percent) than in 2010 (20 percent).
Figure 7.2. Percentage distribution of public elementary and secondary school students, by student race/ethnicity and percentage of minority enrollment in the school: Fall 2015

NOTE: Minority students include students who are Black, Hispanic, Asian, Pacific Islander, American Indian/Alaska Native, and of Two or more races. Data
reflect racial/ethnic data reported by schools. Race categories exclude persons of Hispanic ethnicity. Detail may not sum to totals because of rounding. SOURCE: U.S. Department of Education, National Center for Education Statistics, Common Core of Data (CCD), “Public Elementary/Secondary School Universe Survey,” 2015–16. See Digest of Education Statistics 2017, table 216.50.
As noted above, in fall 2015, approximately 30 percent of public students attended public schools in which the combined enrollment of minority students was at least 75 percent of total enrollment. Over half of Hispanic (60 percent), Black (58 percent), and Pacific Islander students (53 percent) attended such schools. In contrast, less than half of Asian students (38 percent), American Indian/Alaska Native students (37 percent), students of Two or more races (19 percent), and White students (5 percent) attended such schools. Instead, the majority of White students (51 percent) attended schools where the combined enrollment minority students was 25 percent or less of total enrollment.
Figure 7.3. Percentage distribution of public elementary and secondary school students, by student race/ethnicity and percentage of own racial/ethnic group enrolled in the school: Fall 2015
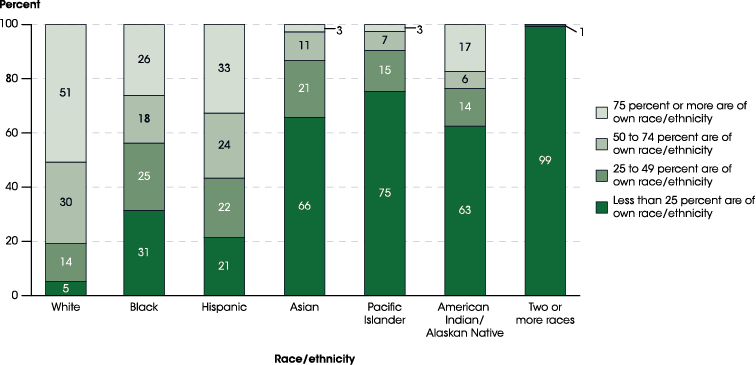
NOTE: Categories not shown in the figure round to zero. Data reflect racial/ethnic data reported by schools. Race categories exclude persons of Hispanic ethnicity.
SOURCE: U.S. Department of Education, National Center for Education Statistics, Common Core of Data (CCD), “Public Elementary/Secondary School Universe Survey,” 2015–16. See Digest of Education Statistics 2017, table 216.55.
The enrollment data for the individual racial/ethnic data provide a more detailed look at the school enrollment patterns. These data show the extent to which students attend public schools with peers of the same racial/ethnic group. In fall 2015, some 51 percent of White students were enrolled in public schools that were predominantly composed of students of their own race (i.e., 75 percent or more of enrollment was White). Lower percentages of American Indian/Alaska Native (17 percent), Asian (3 percent), Pacific Islander (3 percent) students were enrolled in public schools that were predominantly composed of students of their own racial/ethnic group. Instead, the majority of students of these racial/ethnic groups were enrolled in public schools in which less than a quarter of the students are of their own race. In comparison, 5 percent of White students were enrolled in such schools. About 26 percent of Black students were enrolled in public schools that were predominantly Black, while 31 percent of Black students were enrolled in schools in which less than a quarter of the students were Black. Similarly, 33 percent of Hispanic students were enrolled in public schools that were predominantly Hispanic, while 21 percent were enrolled in schools in which less than a quarter of the students were Hispanic.
Reference Tables
- Table 216.50 (Digest of Education Statistics 2017) Number and percentage distribution of public elementary and secondary school students, by percentage of minority enrollment in the school and student's racial/ethnic group: Selected years, fall 1995 through fall 2015
- Table 216.55 (Digest of Education Statistics 2017) Number and percentage distribution of public elementary and secondary school students, by percentage of student's racial/ethnic group enrolled in the school and student's racial/ethnic group: Selected years, fall 1995 through fall 2015
Related Indicators and Resources
Elementary and Secondary Enrollment; Elementary and Secondary Enrollment (The Condition of Education); Public Charter School Enrollment (The Condition of Education)
Data Sources
Common Core of Data (CCD)


