- Surveys & Programs
- Data & Tools
- Fast Facts
- News & Events
- Publications & Products
- About Us

Indicator 29: Youth and Young Adults Neither Enrolled in School nor Working
(Last Updated: February 2019)
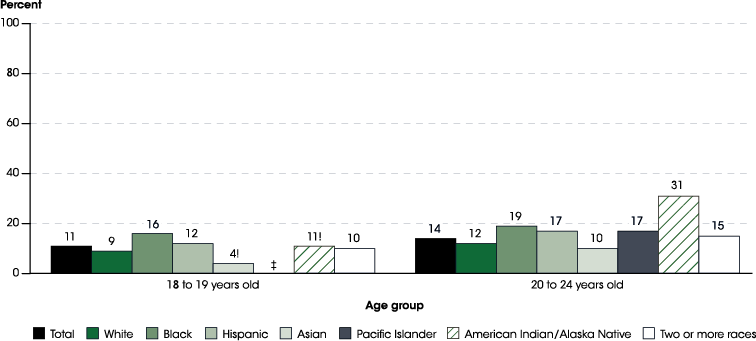
In 2017, the percentage of 20- to 24-year-olds who were neither enrolled in school nor working ranged from 10 percent for Asian young adults to 31 percent for American Indian/Alaska Native young adults.
Youth and young adults who are neither enrolled in school nor working may face limited future opportunities because they are detached from these core activities for this age group.1 There are many reasons why youth and young adults between the ages of 18 and 24 may be neither enrolled in school nor working. For example, they may be seeking but unable to find work or they may have left the workforce or school—either temporarily or permanently—for financial or personal reasons related to illness, disability, or the care of family members. This indicator provides information on youth and young adults at an age when most are transitioning into postsecondary education or the workforce. This is a critical period for young people as they pursue educational, occupational, and other goals.
Figure 29.1. Percentage of 18- to 24-year-olds who were neither enrolled in school nor working, by age group and race/ethnicity: 2017
! Interpret data with caution. The coefficient of variation (CV) for this estimate is between 30 and 50 percent.
‡ Reporting standards not met. Either there are too few cases for a reliable estimate or the coefficient of variation (CV) is 50 percent or greater.
NOTE: Data are based on sample surveys of the civilian noninstitutionalized population. Race categories exclude persons of Hispanic ethnicity. Although rounded numbers are displayed, the figures are based on unrounded estimates.
SOURCE: U.S. Department of Commerce, Census Bureau, Current Population Survey (CPS), Annual Social and Economic Supplement, 2017. See Digest of Education Statistics 2017, table 501.30.
In 2017, lower percentages of youth ages 18 and 19 (11 percent) than of young adults ages 20 to 24 (14 percent) were neither enrolled in school nor working. This same pattern was observed for most racial/ethnic groups. For youth and young adults who were of Two or more races and who were Black, there were no measurable differences.2
There were also differences among racial/ethnic groups in the percentages of youth and young adults neither enrolled in school nor working. Among youth ages 18 and 19, a higher percentage of Black youth (16 percent) were neither enrolled in school nor working than youth who were Hispanic (12 percent), of Two or more races (10 percent), White (9 percent), and Asian (4 percent).
Among young adults ages 20 to 24, a higher percentage of American Indian/Alaska Native young adults (31 percent) than of young adults of all other racial/ethnic groups were neither enrolled in school nor working. Additionally, the percentages of Black and Hispanic young adults (19 and 17 percent, respectively) neither enrolled in school nor working were higher than the percentages of White and Asian young adults (12 percent and 10 percent, respectively).
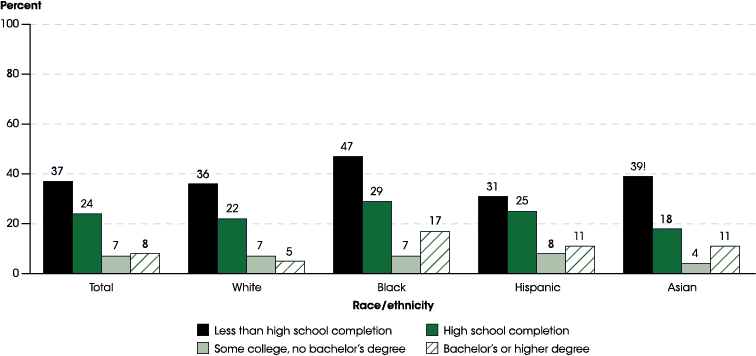
Figure 29.2. Percentage of 20- to 24-year-olds who were neither enrolled in school nor working, by race/ethnicity and educational attainment: 2017
! Interpret data with caution. The coefficient of variation (CV) for this estimate is between 30 and 50 percent.
NOTE: Data are based on sample surveys of the civilian noninstitutionalized population. High school completion includes equivalency credentials, such as the GED credential. Some college, no bachelor’s degree includes persons with no college degree as well as those with an associate’s degree. Total includes other racial/ethnic groups not separately shown, including Pacific Islander, American Indian/Alaska Native, and Two or more races. These groups are omitted from this figure since most of their estimates did not meet reporting standards. Race categories exclude persons of Hispanic ethnicity. Although rounded numbers are displayed, the figures are based on unrounded estimates.
SOURCE: U.S. Department of Commerce, Census Bureau, Current Population Survey (CPS), Annual Social and Economic Supplement, 2017. See Digest of Education Statistics 2017, table 501.30.
In 2017, the percentage of 20- to 24-year-olds neither in school nor working was generally higher for those with lower levels of educational attainment than for those with higher levels of educational attainment. This was also the case for White, Black, Hispanic, and Asian young adults.3 For instance, among White young adults, the percentage neither in school nor working was higher for those who had not completed high school (36 percent) than for those who had completed high school (22 percent), and the percentages for both groups were higher than the percentages for those with some college (7 percent) and those with a bachelor’s or higher degree (5 percent).
Similarly, among Black young adults, the percentage neither in school nor working was higher for those who had not completed high school (47 percent) than for those who had completed high school (29 percent), and the percentages for both groups were higher than the percentages for those with some college (7 percent) and those with a bachelor’s or higher degree (17 percent).
Endnotes
1 Fernandes-Alcantara, A.L. (2015). Disconnected Youth: A Look at 16 to 24 Year Olds Who Are Not Working or In School (CRS Report No. R40535). Retrieved from https://fas.org/sgp/crs/misc/R40535.pdf.
2 Comparisons for Pacific Islanders could not be made due to reporting standards not being met for youth ages 18 to 19.
3 Comparisons for young adults who were of Two or more races, Pacific Islander, and American Indian/Alaska were not made since most of their estimates did not meet reporting standards.
Reference Tables
- Table 501.30 (Digest of Education Statistics 2017) Number and percentage of persons 16 to 24 years old who were neither enrolled in school nor working, by educational attainment, age group, sex, family poverty status, and race/ethnicity: 2000, 2010, and 2017
Related Indicators and Resources
Employment and Unemployment Rate by Educational Attainment (The Condition of Education); Unemployment
Data Sources
Current Population Survey (CPS)


