- Surveys & Programs
- Data & Tools
- Fast Facts
- News & Events
- Publications & Products
- About Us

Indicator 19 Snapshot: College Participation Rates for Racial/Ethnic Subgroups
(Last Updated: February 2019)
Among Hispanic subgroups, the average college enrollment rate in 2016 ranged from 27 percent for Honduran 18- to 24-year-olds to 64 percent for Chilean 18- to 24-year-olds. Among Asian subgroups, the average college enrollment rate ranged from 23 percent for Burmese 18- to 24-year-olds to 81 percent for Other Southeast Asian (including Indonesian and Malaysian) 18- to 24-year-olds.
While the indicator College Participation Rates uses data from the Current Population Survey (CPS) to present overall average college enrollment rates for Hispanic and Asian young adults, there is much diversity within both racial/ethnic groups. This snapshot uses data from the American Community Survey (ACS) to estimate average college enrollment rates for Hispanic and Asian subgroups, including, for example, Mexican, Puerto Rican, Chinese, and Asian Indian. The indicator also examines average college enrollment rates by sex for Hispanic and Asian subgroups. The average college enrollment rate is defined as the percentage of 18- to 24-year-olds enrolled in degree-granting postsecondary institutions.
Figure 19S.1. Average college enrollment rates of 18- to 24-year-olds in degree-granting postsecondary institutions, by selected Hispanic subgroups: 2016

1 Includes other Central American subgroups not shown separately.
NOTE: Data are based on sample surveys of the entire population in the given age range residing within the United States, including both noninstitutionalized persons (e.g., those living in households, college housing, or military housing located within the United States) and institutionalized persons (e.g., those living in prisons, nursing facilities, or other healthcare facilities). Although rounded numbers are displayed, the figures are based on unrounded estimates.
SOURCE: U.S. Department of Commerce, Census Bureau, American Community Survey (ACS), 2016. See Digest of Education Statistics 2017, table 302.62.
In 2016, the average college enrollment rate for Hispanic 18- to 24-year-olds was 36 percent. Average college enrollment rates for the Honduran (27 percent), Guatemalan (29 percent), Puerto Rican (34 percent), and Mexican (35 percent) subgroups were lower than the rate for Hispanic young adults overall. The average college enrollment rates for the Salvadoran, Dominican, and Nicaraguan subgroups were not measurably different from the overall Hispanic rate. The average college enrollment rates for the remaining Hispanic subgroups were higher than the overall rate for Hispanic young adults and ranged from 42 percent for Other Hispanic young adults�who could not be classified into one of the predetermined subgroup categories�to 64 percent for Chilean young adults.
In 2016, the average college enrollment rate for female Hispanic young adults (41 percent) was higher than the enrollment rate for male Hispanic young adults (32 percent). This same pattern was observed for the Chilean, Spaniard, Colombian, Dominican, Puerto Rican, Honduran, Cuban, Mexican, Guatemalan, and Other Hispanic subgroups. The female-male enrollment gap ranged from 7 percentage points for Other Hispanic young adults to 33 percentage points for Chilean young adults. The average college enrollment rates for males and females were not measurably different for the Costa Rican, Ecuadorian, Nicaraguan, Other South American, Panamanian, Peruvian, Salvadoran, and Venezuelan subgroups.
Figure 19S.2. Average college enrollment rates of 18- to 24-year-olds in degree-granting postsecondary institutions, by selected Asian subgroups: 2016
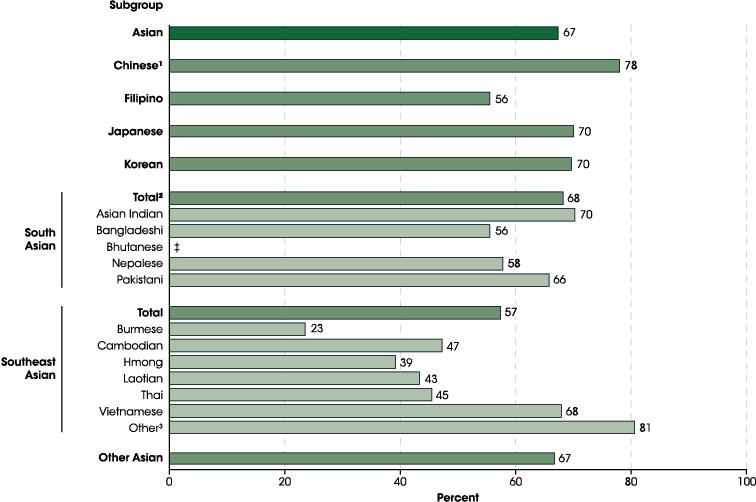
‡ Reporting standards not met (too few cases for a reliable estimate).
1 Includes Taiwanese.
2 In addition to the subgroups shown, also includes Sri Lankan.
3 Consists of Indonesian and Malaysian.
NOTE: Data are based on sample surveys of the entire population in the given age range residing within the United States, including both noninstitutionalized persons (e.g., those living in households, college housing, or military housing located within the United States) and institutionalized persons (e.g., those living in prisons, nursing facilities, or other healthcare facilities). Race categories exclude persons of Hispanic ethnicity. Although rounded numbers are displayed, the figures are based on unrounded estimates.
SOURCE: U.S. Department of Commerce, Census Bureau, American Community Survey (ACS), 2016. See Digest of Education Statistics 2017, table 302.62.
The average college enrollment rate for Asian 18- to 24-year-olds was 67 percent in 2016. The rates for the following Asian subgroups were lower than the overall Asian rate: Burmese (23 percent), Hmong (39 percent), Laotian (43 percent), Thai (45 percent), Cambodian (47 percent), Bangladeshi (56 percent), and Filipino (56 percent). Conversely, the average college enrollment rates for Chinese (78 percent) and Other Southeast Asian1 young adults (81 percent) were higher than the overall Asian rate. The enrollment rates for other Asian subgroups were not measurably different from the overall Asian rate.
In 2016, the average college enrollment rate for female Asian young adults (68 percent) was higher than the enrollment rate for male Asian young adults (66 percent). This same pattern was observed for the Laotian, Other Asian, and Filipino subgroups. The female-male enrollment gap was 6 percentage points for Filipino young adults, 11 percentage points for Other Asian young adults, and 24 percentage points for Laotian young adults. Conversely, the average college enrollment rate for female Nepalese young adults (48 percent) was lower than the enrollment rate for male Nepalese young adults (67 percent). The average college enrollment rates for males and females were not measurably different for the remaining twelve Asian subgroups.
Endnotes
1 Other Southeast Asian consists of Indonesian and Malaysian and excludes Burmese, Cambodian, Hmong, Laotian, Thai, and Vietnamese, which are shown separately.
Reference Tables
- Table 302.62 (Digest of Education Statistics 2017) Percentage of 18- to 24-year-olds enrolled in degree-granting postsecondary institutions and percentage distribution of those enrolled, by sex, race/ethnicity, and selected racial/ethnic subgroups: 2010 and 2016
Related Indicators and Resources
College Enrollment Rates (The Condition of Education); College Participation Rates; Undergraduate Enrollment
Data Sources
American Community Survey (ACS)


