- Surveys & Programs
- Data & Tools
- Fast Facts
- News & Events
- Publications & Products
- About Us

Indicator 15: Retention, Suspension, and Expulsion
(Last Updated: February 2019)
Between 2000 and 2016, the percentage of students retained in a grade decreased from 3.1 to 1.9 percent. This pattern was observed among White, Black, and Hispanic students.
This indicator examines racial/ethnic differences in the percentages of students who were retained in a grade,1 received one or more out-of-school suspensions, and were expelled by race/ethnicity. Retention, suspension, and expulsion are all associated with negative outcomes, such as an increased risk of dropping out of school.2 Suspensions and expulsions are disciplinary actions taken by a school or district in response to a student’s behavior. Retention, however, can be related to both disciplinary and academic issues; a student might be retained because of behavioral issues or because the student is not academically ready to progress to the next grade level.
The Current Population Survey asks parents to report the grade in which their child is enrolled in October of the current school year, and the grade in which their child was enrolled in October of the prior school year. Retention rates include students in kindergarten through grade 12 in public and private schools.
Figure 15.1. Percentage of elementary and secondary school students retained in grade, by race/ethnicity: 2000–2016
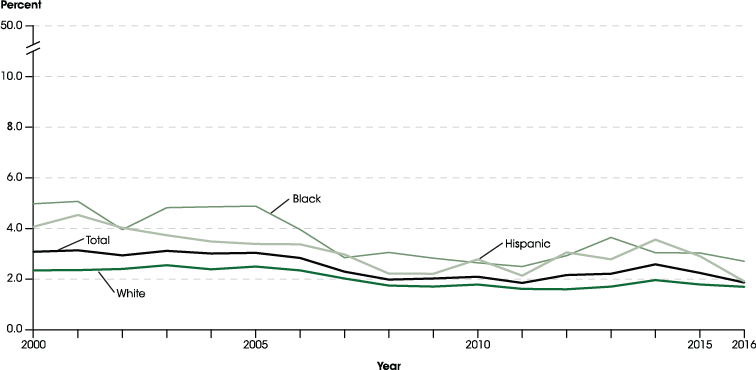
NOTE: Data are as of October of each survey year. Excludes students who were reported as being in a higher grade the previous year than the given year. Race categories exclude persons of Hispanic ethnicity. Totals include other racial/ethnic categories not separately shown.
SOURCE: U.S. Department of Commerce, Census Bureau, Current Population Survey, October, 2000 through 2016. See Digest of Education Statistics 2017, table 225.90.
In 2016, about 1.9 percent of students in kindergarten through grade 12 were retained in the same grade in which they were enrolled in the prior school year. This percentage was lower than the percentage of students retained in 2015 (2.2 percent). Between 2000 and 2016, the percentage of students retained decreased from 3.1 to 1.9 percent. This pattern was observed among White, Black, and Hispanic students.3 However, in all years between 2000 and 2016, a higher percentage of Black students than of White students were retained. The percentage of Hispanic students who were retained was also higher than the percentage of White students retained for most years over the same period, although the percentages of White and Hispanic students retained in 2016 were not measurably different.
Figure 15.2. Percentage of elementary and secondary school students retained in grade, by grade level and race/ethnicity: 2016
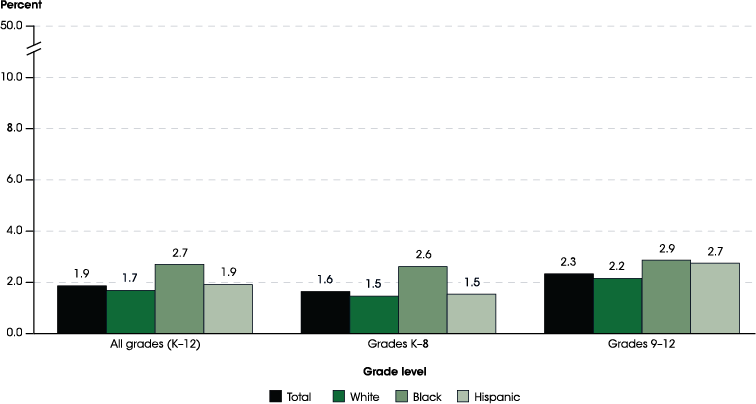
NOTE: Data are as of October of the survey year. Excludes students who were reported as being in a higher grade the previous year than the given year. Race categories exclude persons of Hispanic ethnicity. Totals include other racial/ethnic categories not separately shown. Although rounded numbers are displayed, the figures are based on unrounded estimates.
SOURCE: U.S. Department of Commerce, Census Bureau, Current Population Survey, October, 2016. See Digest of Education Statistics 2017, table 225.90.
In 2016, the percentage of Black students retained in kindergarten through grade 12 (2.7 percent) was higher than the percentage of White students retained (1.7 percent) but was not measurably different from the percentage of Hispanic students retained (1.9 percent). Among those in kindergarten through grade 8, a higher percentage of Black students (2.6 percent) than of White and Hispanic students (both 1.5 percent) were retained. Among those in grades 9 through 12, there were no measurable differences in the percentages of White, Black, and Hispanic students retained.
For White and Hispanic students in 2016, the percentage of kindergarten through 8th-grade students who were retained in grade (both 1.5 percent) was lower than the percentage of 9th- through 12th-grade students who were retained (2.2 and 2.7 percent, respectively). The percentage of Black students in kindergarten through 8th grade who were retained was not measurably different from the corresponding percentage of those in 9th through 12th grade.
Students may be suspended (in- or out-of-school)4 or expelled (with or without educational services)5 for disciplinary purposes. The Civil Rights Data Collection provides data on the number of public school students who were disciplined during the 2013–14 school year by the type of disciplinary action (e.g., suspension, expulsion). The remainder of this indicator discusses the percentages of public school students who received an out-of-school suspension and were expelled, by race/ethnicity.
Figure 15.3. Percentage of public school students who received out-of-school suspensions, by race/ethnicity and sex: 2013–14
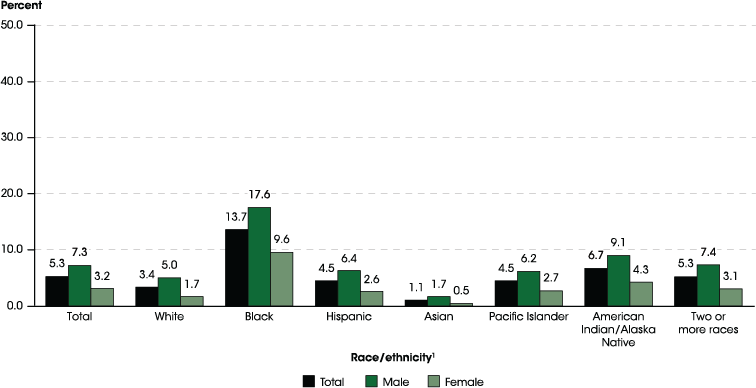
1 Data by race/ethnicity exclude students with disabilities served only under Section 504 (not receiving services under Individuals with Disabilities Act [IDEA]) since suspensions for these students are not available disaggregated by race/ethnicity in the underlying data. Students with disabilities served only under Section 504 made up approximately 2 percent of public school enrollment in 2013–14.
NOTE: An out-of-school suspension is an instance in which a student is temporarily removed from his or her regular school for disciplinary purposes for at least half a day (but less than the remainder of the school year) to another setting (e.g., home or behavior center). The percentage of students receiving a disciplinary action is calculated by dividing the cumulative number of students receiving that type of disciplinary action for the entire 2013–14 school year by the student enrollment based on a count of students taken on a single day between September 27 and December 31. Race categories exclude persons of Hispanic ethnicity. Although rounded numbers are displayed, the figures are based on unrounded estimates.
SOURCE: U.S. Department of Education, Office for Civil Rights, Civil Rights Data Collection, “2013–14 Discipline Estimations by Discipline Type” and “2013–14 Estimations for Enrollment.” See Digest of Education Statistics 2017, table 233.28.
In 2013–14, about 2.6 million public school students (5.3 percent) received one or more out-of-school suspensions. A higher percentage of Black students (13.7 percent) than of students from any other racial/ethnic group received an out-of-school suspension, followed by 6.7 percent of American Indian/Alaska Native students, 5.3 percent of students of Two or more races, 4.5 percent each of Hispanic and Pacific Islander students, 3.4 percent of White students, and 1.1 percent of Asian students.
More than twice as many male students (7.3 percent) than female students (3.2 percent) received one or more out-of-school suspensions in 2013–14. This pattern of higher percentages of male than female students receiving out-of-school suspensions was observed for all racial/ethnic groups. For example, 17.6 percent of Black male students received one or more out-of-school suspensions compared with 9.6 percent of Black female students. The percentage of Black male students who received out-of-school suspensions (17.6 percent) was the highest of male students from any racial/ethnic group. This percentage was nearly twice the percentage of the next highest racial/ethnic group—American Indian/Alaska Native male students with 9.1 percent—and was more than twice the percentage of male students from any other racial/ethnic group. A similar pattern was observed among female students, with Black female students receiving the highest percentage of out-of-school suspensions (9.6 percent).
About 111,000 students were expelled in 2013–14, amounting to 0.2 percent of public school students. The percentages of Black and American Indian/Alaska Native students who were expelled (both 0.4 percent) were higher than the percentages for students of all other racial/ethnic groups. Among other racial/ethnic groups, 0.3 percent of students of Two or more races, 0.2 percent of White students, 0.1 percent of Hispanic and of Pacific Islander students, and less than 0.1 percent of Asian students were expelled. As with the percentages of students who received out-of-school suspensions, a higher percentage of male (0.3 percent) than of female (0.1 percent) students were expelled. This pattern of higher percentages of male than female students receiving expulsions was observed for all racial/ethnic groups.
Endnotes
1 Retained students are defined as those who remain in the same grade from one school year to the next. Grade retention can happen at any school level.
2 Jimerson, S.R., Anderson, G.E., and Whipple, A.D. (2002). Winning the Battle and Losing the War: Examining the Relation Between Grade Retention and Dropping Out of High School. Psychology in the Schools, 39(4): 441�457. Retrieved February 24, 2017, from http://onlinelibrary.wiley.com/doi/10.1002/pits.10046/abstract; Stearns, E., and Glennie, E.J. (2006). When and Why Dropouts Leave High School. Youth & Society, 38(1): 29�57. Retrieved February 24, 2017, from http://journals.sagepub.com/doi/abs/10.1177/0044118X05282764.
3 Retention data are only available for White, Black, and Hispanic students. There are too few cases to conduct reliable analyses for students of other racial/ethnic groups.
4 An in-school suspension is an instance in which a student is temporarily removed from his or her regular classroom(s) for at least half a day but remains under the direct supervision of school personnel. An out-of-school suspension is an instance in which a student is temporarily removed from his or her regular school for disciplinary purposes for at least half a day (but less than the remainder of the school year) and sent to another setting (e.g., home or behavior center).
5 Expulsions are actions taken by a local education agency that result in the removal of a student from his or her regular school for disciplinary purposes for the remainder of the school year or longer in accordance with local education agency policy. Expulsions also include removals resulting from violations of the Gun Free Schools Act that are modified to less than 365 days.
Reference Tables
- Table 225.90 (Digest of Education Statistics 2017) Number and percentage of elementary and secondary school students retained in grade, by sex, race/ethnicity, and grade level: 1994 through 2016
- Table 233.27 (Digest of Education Statistics 2017) Number of students receiving selected disciplinary actions in public elementary and secondary schools, by type of disciplinary action, disability status, sex, and race/ethnicity: 2013-14
- Table 233.28 (Digest of Education Statistics 2017) Percentage of students receiving selected disciplinary actions in public elementary and secondary schools, by type of disciplinary action, disability status, sex, and race/ethnicity: 2013-14
Related Indicators and Resources
High School Status Dropout Rates; School Crime and Safety (The Condition of Education); Snapshot of High School Status Dropout Rates for Racial/Ethnic Subgroups; Status Dropout Rates (The Condition of Education)
Data Sources
Current Population Survey (CPS) and Civil Rights Data Collection (CRDC)


